. 2018 Feb 22;9(1):777.
doi: 10.1038/s41467-018-03089-z.

Landscape topography structures the soil microbiome in arctic polygonal tundra

Affiliations

Landscape topography structures the soil microbiome in arctic polygonal tundra

Neslihan Taş et al. Nat Commun. .

Abstract

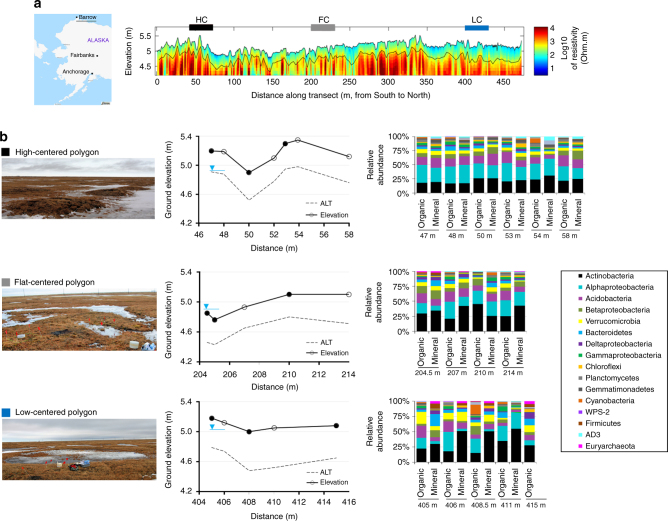
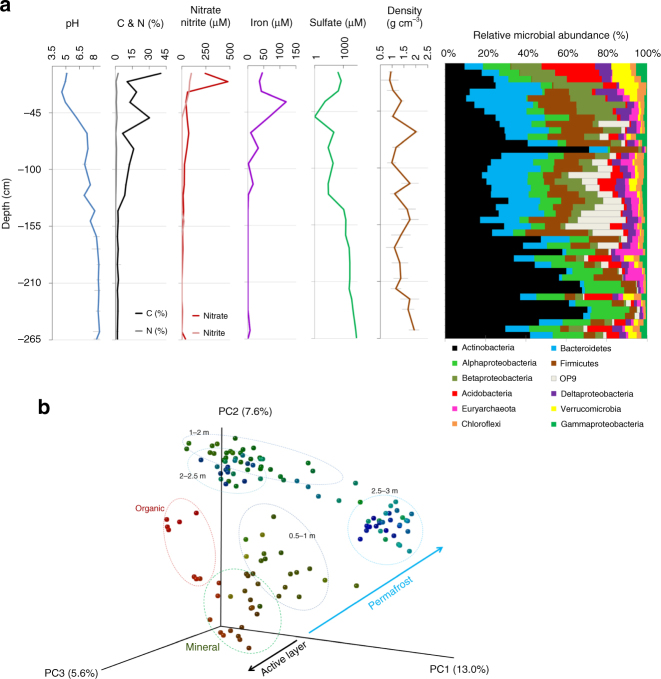
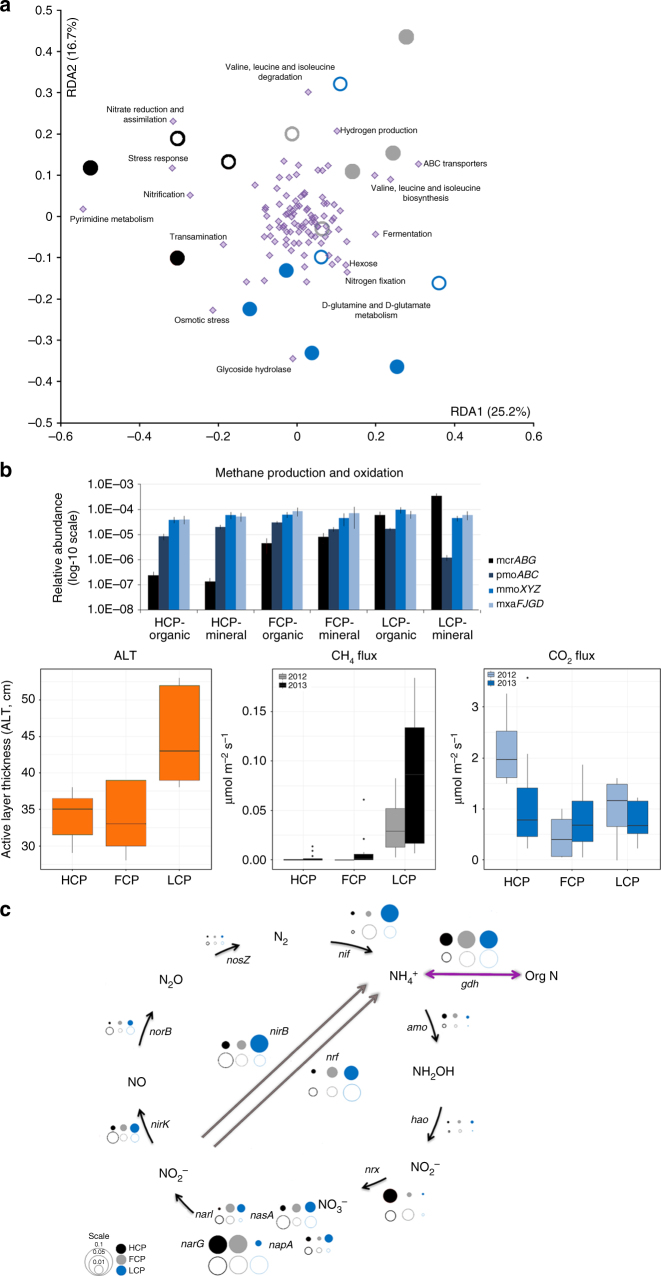
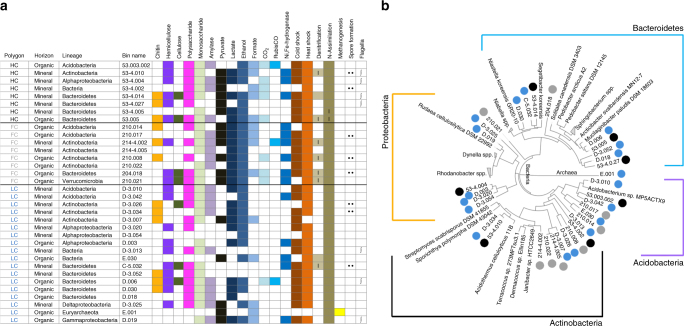
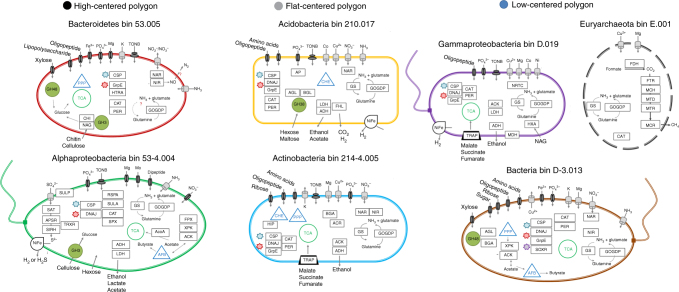
In the Arctic, environmental factors governing microbial degradation of soil carbon (C) in active layer and permafrost are poorly understood. Here we determined the functional potential of soil microbiomes horizontally and vertically across a cryoperturbed polygonal landscape in Alaska. With comparative metagenomics, genome binning of novel microbes, and gas flux measurements we show that microbial greenhouse gas (GHG) production is strongly correlated to landscape topography. Active layer and permafrost harbor contrasting microbiomes, with increasing amounts of Actinobacteria correlating with decreasing soil C in permafrost. While microbial functions such as fermentation and methanogenesis were dominant in wetter polygons, in drier polygons genes for C mineralization and CH4 oxidation were abundant. The active layer microbiome was poised to assimilate N and not to release N2O, reflecting low N2O flux measurements. These results provide mechanistic links of microbial metabolism to GHG fluxes that are needed for the refinement of model predictions.


Conflict of interest statement

The authors declare no competing financial interests.

Figures

Fig. 1
Fig. 1
Microbial communities of active layer are strongly correlated to landscape topography in arctic polygonal tundra. Samples were collected from active layer soils and permafrost layer along a transect of high- (black), flat- (gray) and low- (blue) centered polygons located at Barrow Experimental Observatory. Map is adapted from ©OpenStreetMap contributors, licensed CC-BY-SA. a Electrical resistivity tomographic (ERT) data were, collected along the ~480 m transect, coincident with soil core retrieval and many different types of in situ soil measurements. ERT data were used to characterize deeper permafrost variability and ice-wedge structures (deeper yellow-red-blue), as well as active layer variability (blue-green). Along this ERT transect, the first 0–150 m were dominated by HC polygons (black bar) which transitioned to FC (gray bar) and LC (blue bar) polygons afterwards. ERT and soil characterization data are described elsewhere. b Photographs (taken by the authors) show the differences in surface soil morphology among different polygon types. In HC polygons centers and troughs could have an elevation difference up to 0.6 m whereas elevation difference among rims, troughs, and centers of FC and LC polygons vary between 0.1–0.3 m. We collected samples for sequencing of the microbial community composition along the polygonal transect (circles show the sampling locations). Active layer thickness (ALT) was also measured at each sampling point. Water table (blue upside down triangle) levels are inferred from measured water levels in troughs and soil moisture measurements and show an estimated depth. CO2 and CH4 fluxes were measured in two consecutive years, 2012 and 2013 from rims, troughs, and centers of polygons (closed circles; Supplementary Fig. 9 and Supplementary Fig. 10)
Fig. 2
Fig. 2
Active layer and permafrost have contrasting microbiomes. Duplicate deep cores from a FC polygon were dissected in 5 cm intervals and analyzed to determine chemical and microbial composition. a Changes in soil and permafrost chemistry and microbial community composition with depth are reported as averages (n = 8 between 0 to 1 m, n = 4 between 1 to 2.64 m). Standard deviations of chemical measurements are represented by gray bars. Standard deviations among technical and biological replicates of microbial community relative abundances are provided in Supplementary Table 5. b Unifrac analysis of 16S rRNA sequence variation along the depth gradient from duplicate cores of a FC polygon. Samples were grouped according to organic (red) and mineral (brown-green) in active layer and permafrost (green-blue) horizons. The variance explained by each principal component (PC) axis is given in parentheses
Fig. 3
Fig. 3
Metabolic potential predicted from metagenomes vary among polygon types. Clustering of this functional potential via a principal component analysis of the relative abundance of functional genes (FOAM-KO Level2) showed an association of metabolic pathways to each polygon type. The percentage variation explained by the principal components is indicated on the axes. Organic (closed) and mineral (open) soil depths were represented as circles, metabolic pathways are represented in diamond shape symbols. Two PCA axes could explain 41.9% of the observed variation. Labels highlight FOAM pathways that showed a strong correlation to the ordination of samples. b Relative abundance of CH4 production (methyl coenzyme M reductase—mcrABG) and oxidation genes (particulate methane monooxygenase-pmoABC, soluble methane monooxygenase-mmoXYZ and methanol dehydrogenase-mxaFJGD), active layer thickness (ALT) was collected at the time of sampling for sequencing (09/24/2011); CO2 and CH4 fluxes were measured in two consecutive years, 2012 and 2013. Point locations for CO2 and CH4 flux measurements are represented in Fig. 1b, Supplementary Fig. 9 and Supplementary Fig. 10. In 2012, fluxes were measured from four locations per polygon (n = 4) as a single time point measurement on 12 August 2012. Between July–October 2013, fluxes were measured monthly from center, rim, and trough of each polygon (n = 3 per polygon). Error bars represent the standard error between measurements from same polygon. c Relative abundance of N cycle genes was also different among different polygons. Organic (closed) and mineral (open) soil depths were represented as circles sized to correspond to the relative abundance of each gene
Fig. 4
Fig. 4
Thirty-three nearly complete bacterial and one partial archaeal genome are binned from assembled soil metagenomic reads. a Distribution of the metabolic capacity for organic C utilization, fermentation, and respiration identified in the bacterial genomes reconstructed in this study. Dot sign shows presence of spore forming genes; integral sign denotes presence of flagellar movement genes; (I) designates incomplete pathways. b Maximum likelihood phylogenetic tree was constructed by using 49 highly conserved COG families from publicly available genomes
Fig. 5
Fig. 5
Barrow genome bins are indicative of metabolic flexibility and high potential for soil organic matter degradation. Metabolic models with detected genes (box) show a wide variety of functions in Barrow bins. Cell morphology is arbitrarily displayed. Pathways; PPP: pentose phosphate pathway, TCA: citric acid cycle, GG: glycolysis–glyconeogenesis, AFB: acetyl-CoA fermentation to butyrate, CHE: bacterial chemotaxis, TONB: ferric siderophore transport system. CAZymes; GH3: glycoside hydrolase family 3, GH38: glycoside hydrolase family 38, GH48: glycoside hydrolase family 48. Methanogenesis; FDH: formate dehydrogenase (EC 1.2.1.2), FTR: formylmethanofuran--tetrahydromethanopterin N-formyltransferase (EC: 2.3.1.101), MCH: methenyltetrahydromethanopterin cyclohydrolase (EC: 3.5.4.27), MTD: methylenetetrahydromethanopterin dehydrogenase (EC:1.5.98.1), MCR: methyl-coenzyme M reductase (EC:2.8.4.1), MTR: tetrahydromethanopterin S-methyltransferase (EC:2.1.1.86). Stress Response; CSP: cold shock protein, DNAJ: heat shock protein/chaperone protein, GrpE: heat shock protein, SOXR: redox-sensitive transcriptional activator SoxR, RSPA: starvation sensing, SULA: cell division inhibitor, SPX: superoxide dismutase [Fe] (EC 1.15.1.1), HIP: HipA protein, inhibits cell growth and induces persistence, ACR: arsenic resistance protein. Assimilatory sulfate reduction. Genes; SULP: sulfate permease, SAT: sulfate adenylyltransferase (EC 2.7.7.4), APSR: adenylyl-sulfate reductase [thioredoxin] (EC 1.8.4.10), SIRH: sulfite reductase [NADPH] (EC 1.8.1.2), TRXR: thioredoxin reductase (EC 1.8.1.9), PER: peroxidase (EC 1.11.1.7), CAT: catalase (EC 1.11.1.6), HTRA: protease, RUB: rubrerythrin, CYC-c551: cytochrome c551 peroxidase (EC 1.11.1.5), FPX: fructose-6-phosphate phosphoketolase (EC 4.1.2.22), XPK: xylulose-5-phosphate phosphoketolase (EC 4.1.2.9), ACK: acetate kinase (EC 2.7.2.1), ACS: acetyl-CoA synthetase (EC 6.2.1.1), NAR: assimilatory nitrate reductase (EC 1.7.99.4), NIR: ferredoxin nitrite reductase (EC 1.7.7.1), GS: glutamine synthatase (EC 6.3.1.2), GOGDP: glutamate synthetase (EC 1.4.1.13), AGL: alpha-glucosidase (EC 3.2.1.20), BGL: beta-glucosidase (EC 3.2.1.21), BGA: beta-galactosidase (EC 3.2.1.23), AXYL: alpha-xylosidase (EC 3.2.1.-), BXYL: beta-xylosidase (EC 3.2.1.37), CHI: chitinase (EC 3.2.1.14), NAG: beta-N-acetylglucosaminidase (EC: 3.2.1.96), ADH: alcohol dehydrogenase (EC 1.1.1.1), LDH: lactate dehydrogenase (EC 1.1.1.28), MDH: methanol dehydrogenase (EC:1.1.2.7), AP: alkaline phosphatase (EC 3.1.3.1), FHL: formate hydrogenlyase (EC 1.2.1.2), NRTC: nitrogen regulatory protein C (NtrC), HXA: hexosaminidase (EC 3.2.1.52)

References

    1. Hubbard SS, et al. Quantifying and relating land-surface and subsurface variability in permafrost environments using LiDAR and surface geophysical datasets. Hydrogeol. J. 2013;21:149–169. doi: 10.1007/s10040-012-0939-y. - DOI
    1. Wainwright HM, et al. Identifying multiscale zonation and assessing the relative importance of polygon geomorphology on carbon fluxes in an Arctic Tundra Ecosystem. J. Geophys. Res.: Biogeosci. 2015;120:788–808. doi: 10.1002/2014JG002799. - DOI
    1. Hinkel KM, et al. Spatial extent, age, and carbon stocks in drained thaw lake basins on the Barrow Peninsula, Alaska. Arct. Antarct. Alp. Res. 2003;35:291–300. doi: 10.1657/1523-0430(2003)035[0291:SEAACS]2.0.CO;2. - DOI
    1. Kirtman, B. et al. Climate Change 2013: The Physical Science Basis. Contribution of Working Group I to AR5. 953-1028 (Cambridge University Press, Cambridge, UK and New York, NY, 2013).
    1. Romanovsky VE, Smith SL, Christiansen HH. Permafrost thermal state in the polar Northern Hemisphere during the international polar year 2007–2009: a synthesis. Permafr. Periglac. Process. 2010;21:106–116. doi: 10.1002/ppp.689. - DOI

Publication types