. 2018 Feb 22;9(1):781.
doi: 10.1038/s41467-018-03149-4.

scNMT-seq enables joint profiling of chromatin accessibility DNA methylation and transcription in single cells

Affiliations

scNMT-seq enables joint profiling of chromatin accessibility DNA methylation and transcription in single cells

Stephen J Clark et al. Nat Commun. .

Abstract

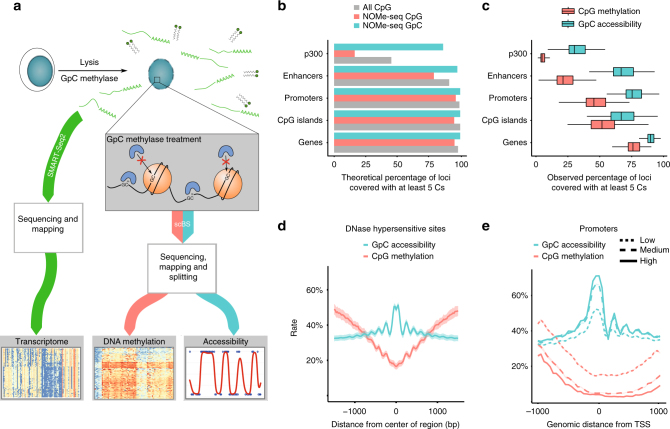
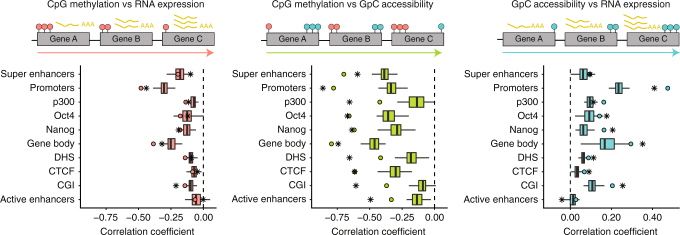
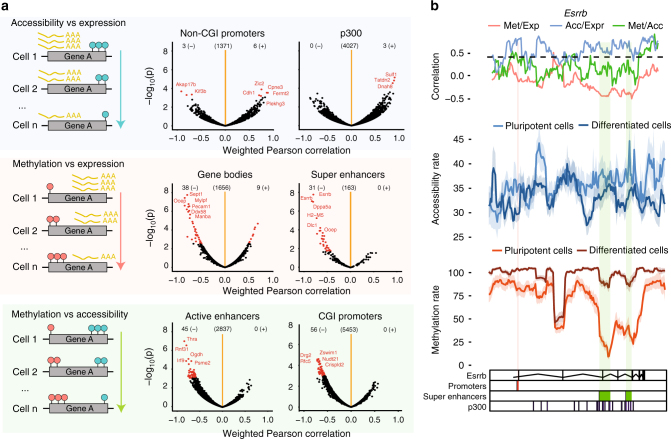
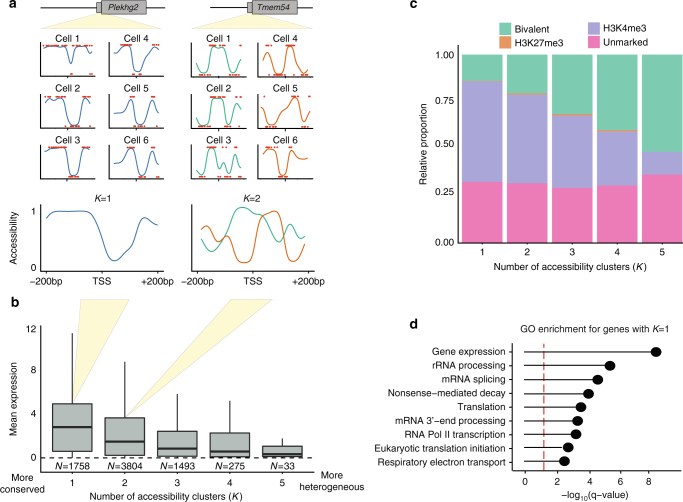
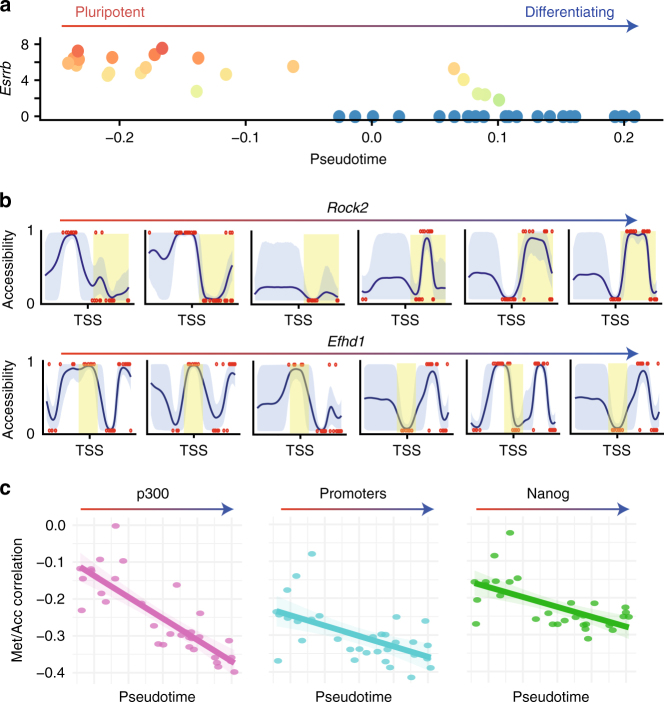
Parallel single-cell sequencing protocols represent powerful methods for investigating regulatory relationships, including epigenome-transcriptome interactions. Here, we report a single-cell method for parallel chromatin accessibility, DNA methylation and transcriptome profiling. scNMT-seq (single-cell nucleosome, methylation and transcription sequencing) uses a GpC methyltransferase to label open chromatin followed by bisulfite and RNA sequencing. We validate scNMT-seq by applying it to differentiating mouse embryonic stem cells, finding links between all three molecular layers and revealing dynamic coupling between epigenomic layers during differentiation.


Conflict of interest statement

W.R. is a consultant and shareholder of Cambridge Epigenetix. The remaining authors declare no competing financial interests.

Figures

Fig. 1
Fig. 1
scNMT-seq overview and genome-wide coverage. a Protocol overview. Single-cells are lysed and accessible DNA is labelled using GpC methyltransferase. RNA is then separated and sequenced using Smart-seq2, whilst DNA undergoes scBS-seq library preparation and sequencing. Methylation and chromatin accessibility data are separated bioinformatically. b Theoretical maximum CpG coverage of genomic contexts with known regulatory roles. Shown is the proportion of loci in different contexts that contain at least 5 cytosines. ‘All CpG’ considers any C-G dinucleotides (e.g., as in scBS-seq), ‘NOMe-seq CpG’ considers A–C–G and T–C–G trinucleotides and ‘NOMe-seq GpC’ considers G–C–A, G–C–C and G–C–T trinucleotides. c Empirical coverage in 61 mouse ES cells considering the same contexts as in b. Shown is the coverage distribution across cells after QC; box plots show median coverage and the first and third quartile, whiskers show 1.5 × the interquartile range above and below the box. d CpG methylation and GpC accessibility profiles at published DNase hypersensitive sites. The profiles were computed as a running average in 50 bp windows. Shading denotes standard deviation across cells. e CpG methylation and GpC accessibility profiles at gene promoters. Promoters are stratified by average expression level of the corresponding gene (log normalised counts less than 2 (low), between 2 and 6 (medium) and higher than 6 (high). The profile is generated by computing a running average in 50 bp windows
Fig. 2
Fig. 2
scNMT-seq recapitulates known global associations between molecular layers. Upper panel shows an illustration of the computation of the correlation across genes (one association test per cell). Left is CpG methylation and RNA expression associations, middle is CpG methylation and GpC accessibility associations, and right is GpC accessibility and RNA expression associations. Red circles represent CpG methylation levels, blue circles represent GpC accessibility levels and yellow polyA tails represent RNA abundance. Lower panel shows the Pearson correlation coefficients between molecular layers at different genomic contexts in the ESC data. Box plots show the distribution of correlation coefficients in single cells. Boxes display median coverage and the first and third quartile, whiskers show 1.5 × the interquartile range above and below the box. Dots show the correlation coefficient in the pseudo-bulked data estimated as average across all single-cells. Stars show the correlation coefficient using published bulk data from the same cell type,. Sample size for the single-cell data is determined by the number of cells which pass QC for both layers (61–64 cells, see Methods)
Fig. 3
Fig. 3
scNMT-seq enables the discovery of novel associations at individual loci. a Left panel shows an illustration for the correlation analysis across cells, which results in one association test per locus. The right panel shows the Pearson correlation coefficient (x-axis) and log10 p-value (y-axis) from association tests between different molecular layers at individual loci, stratified by genomic contexts. Significant associations (FDR <0.1, Benjamini–Hochberg adjusted), are highlighted in red. The number of significant positive (+) and negative (−) associations and the number of tests (centre) are indicated above. Sample size varies depending on the number of cells, which have coverage for a specific loci (see Methods). b Zoom-in view of the Esrrb gene locus. Shown from top to bottom are: Pairwise Pearson correlation coefficients between each pair of the three layers (Met methylation, Acc accessibility, Expr expression). Accessibility (blue) and methylation (red) profiles shown separately for pluripotent and differentiated sub-populations; mean rates (solid line) and standard deviation (shade) were calculated using a running window of 10 kb with a step size of 1000 bp; Track with genomic annotations, highlighting the position of regulatory elements: promoters, super enhancers, and p300 binding sites
Fig. 4
Fig. 4
Modelling chromatin accessibility profiles at gene promoters in single cells. a Accessibility profiles for each cell and gene are fitted at a single nucleotide resolution (+/–200 bp around the TSS), followed by clustering of profiles for each gene to estimate the most likely number of clusters. Genes with higher numbers of clusters correspond to genes with increased heterogeneity compared to genes with small numbers of clusters. b Relationship between heterogeneity in the accessibility profile and gene expression. Boxplots show the distribution of average gene expression levels for genes with increasing numbers of accessibility clusters. Upper and lower hinges display third and first quartiles; the bar displays the median and the whiskers 1.5 times the inter-quartile range above and below the boxes. c Proportion of gene promoters marked with H3K4me3 and/or H3K27me3 stratified by number of accessibility clusters. Promoters with high levels of accessibility heterogeneity are associated with the presence of bivalent histone marks (both H3K4me3 and H3K27me3). d Gene ontology terms significantly enriched in genes with most homogeneous accessibility profiles (K = 1)
Fig. 5
Fig. 5
Using scNMT-seq to explore dynamics of the epigenome during differentiation. a Embryoid body cells ordered in a developmental trajectory inferred from the RNA-seq data. Shown is the location of each cell in pseudotime (x axis) versus the expression level of Esrrb (y axis). b Reconstructed dynamics of variation in chromatin accessibility profiles across the developmental trajectory. Shown are profiles of representative cells for Rock2 and Efhd1. Axis ticks display –200 bp, 0 bp and +200 bp relative to the TSS. Shading is used to highlight changes between cells. c Developmental trajectory is associated changes in genome-wide methylation-accessibility coupling. Shown is the location of each cell in pseudotime (x axis) and the corresponding Pearson correlation coefficients between methylation and accessibility (y axis) in different genomic contexts

Similar articles

Cited by

References

    1. Degner JF, et al. DNase I sensitivity QTLs are a major determinant of human expression variation. Nature. 2012;482:390–394. doi: 10.1038/nature10808. - DOI - PMC - PubMed
    1. Varley KE, et al. Dynamic DNA methylation across diverse human cell lines and tissues. Genome Res. 2013;23:555–567. doi: 10.1101/gr.147942.112. - DOI - PMC - PubMed
    1. Angermueller C, et al. Parallel single-cell sequencing links transcriptional and epigenetic heterogeneity. Nat. Methods. 2016;13:229–232. doi: 10.1038/nmeth.3728. - DOI - PMC - PubMed
    1. Hou Y, et al. Single-cell triple omics sequencing reveals genetic, epigenetic, and transcriptomic heterogeneity in hepatocellular carcinomas. Cell Res. 2016;26:304–319. doi: 10.1038/cr.2016.23. - DOI - PMC - PubMed
    1. Hu Y, et al. Simultaneous profiling of transcriptome and DNA methylome from a single cell. Genome Biol. 2016;17:88. doi: 10.1186/s13059-016-0950-z. - DOI - PMC - PubMed

Publication types