. 2018 Feb 8:12:13.
doi: 10.3389/fnbeh.2018.00013. eCollection 2018.

Spike Train Similarity Space (SSIMS) Method Detects Effects of Obstacle Proximity and Experience on Temporal Patterning of Bat Biosonar

Affiliations

Spike Train Similarity Space (SSIMS) Method Detects Effects of Obstacle Proximity and Experience on Temporal Patterning of Bat Biosonar

Alyssa W Accomando et al. Front Behav Neurosci. .

Abstract

Bats emit biosonar pulses in complex temporal patterns that change to accommodate dynamic surroundings. Efforts to quantify these patterns have included analyses of inter-pulse intervals, sonar sound groups, and changes in individual signal parameters such as duration or frequency. Here, the similarity in temporal structure between trains of biosonar pulses is assessed. The spike train similarity space (SSIMS) algorithm, originally designed for neural activity pattern analysis, was applied to determine which features of the environment influence temporal patterning of pulses emitted by flying big brown bats, Eptesicus fuscus. In these laboratory experiments, bats flew down a flight corridor through an obstacle array. The corridor varied in width (100, 70, or 40 cm) and shape (straight or curved). Using a relational point-process framework, SSIMS was able to discriminate between echolocation call sequences recorded from flights in each of the corridor widths. SSIMS was also able to tell the difference between pulse trains recorded during flights where corridor shape through the obstacle array matched the previous trials (fixed, or expected) as opposed to those recorded from flights with randomized corridor shape (variable, or unexpected), but only for the flight path shape in which the bats had previous training. The results show that experience influences the temporal patterns with which bats emit their echolocation calls. It is demonstrated that obstacle proximity to the bat affects call patterns more dramatically than flight path shape.

Keywords: big brown bat; biosonar; clutter; echolocation; memory; sonar sound groups; spike train similarity space (SSIMS); temporal patterning.


Figures
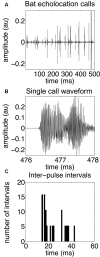
FIGURE 1
FIGURE 1
Bat echolocation calls. Bat echolocation calls are shown over a 500-millisecond time period (A), a single call waveform (B), and a histogram showing the distribution of inter-pulse intervals, or IPIs (C). In this example, microphone recordings of the bat’s echolocation signals are sampled at 192 kHz. The call shown in the middle panel is from the same recording as the top panel over the 476–478 ms time frame. Note that both “call” and “pulse” refer to the same type of echolocation vocalization. Notice the bimodal distribution of IPIs. Long IPIs occur between sonar sound groups and are 30–50 ms long, while shorter IPIs occur within a sonar sound group, and are approximately 15–25 ms long. Adapted with permission from Accomando et al. (2017).
FIGURE 2
FIGURE 2
Spike train similarity (SSIMS) algorithm processing steps. The input of the algorithm is a series of pulse trains (A). A matrix pair-wise distances between the pulse trains (B) are calculated using spike train metrics. The inset (adapted from Victor, 2005) shows an example of the series of operations taken to transform one pulse train into another by deleting (red), shifting (small blue arrows), or adding (green) spikes. The sum of the cost assigned to each operation determines the final cost estimate. The final step of the algorithm projects the pair-wise distance matrix into a low-dimensional similarity space (C). Light blue outlines show how an individual pulse train is represented at each stage in the process. In the final output, the distance between the points represents the degree of similarity between the pulse trains. Note that this schematic is for illustrative purposes and does not contain real data.
FIGURE 3
FIGURE 3
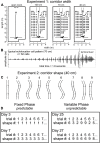
Experiment 1 and Experiment 2 methods. Flight room schematic for Experiment 1 (A). The back of the room is at the top of each diagram, and the front of the room where the experimenter released the bat is shown at the bottom of each diagram. The active flight volume was filled with rows and columns of chains except for an obstacle-free flight corridor in the center of the chain array. In Experiment 1, the open room had no chains, or the corridor was straight and 100 cm, 70 cm, or 40 cm wide [A, adapted from Wheeler et al. (2016)]. Arrows point to the wall where the bat was trained to land. A typical echolocation call pattern in the 70 cm corridor (B) shows pulse patterns while the bat navigated the chain array, followed by the terminal buzz – a stereotyped, very fast call pattern that bats emit when landing or intercepting prey. Before pulse intervals were analyzed, the terminal buzz was excluded. Bats typically flew for 1.5–2.5 s to traverse the obstacle array before landing. In Experiment 2, (C), the corridor was 40 cm wide and curved into 1 of 9 different configurations. Configuration 1 was identical to the 40 cm condition in Experiment 1 and was the starting point for all other configurations. The two movable crossbar joints (light gray) maintained consistent 40 cm spacing throughout the full corridor length and were moved 40 cm either to the right or to the left of center to create curved corridors of varying shapes, numbered 1–9. Experiment 2 consisted of two distinct phases: the fixed phase and the variable phase (D). In the fixed phase, trials, or flights through the obstacle array, repeated the same corridor configuration up to 10 times in the same day for multiple days. In the variable phase, trials (flights) through the array varied pseudo-randomly each day. Actual trials are shown for experimental days (not consecutive days) 3, 7, 25, and 27. Adapted with permission from Accomando et al. (2017).
FIGURE 4
FIGURE 4
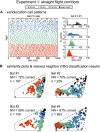
Similarity analysis reveals environment-dependent variation in call patterns. Raster of all recorded echolocation calls (points) over all of Bat #3’s flights (rows) (A, left panel). Inter-pulse interval (IPI) histograms (A, right panels) for Bat #3 in four conditions: open room (black), 100 cm corridor (blue), 70 cm corridor (green), and 40 cm corridor (orange). IPIs were shorter and more calls were emitted with increasing clutter. Similarity plots separated by bat are shown in (B). Each point represents a flight (over the same time interval presented in A), and the distance in the 2D space represents the estimated similarity between the call patterns. The similarity space was generated using calls recorded from all bats from 839 flights total. Nearest-neighbor (NN) classification results (10D similarity estimates) were calculated individually for each bat using leave-one-out cross validation. In all cases, classification exceeded expected chance levels (the upper limit of the 99% confidence interval obtained empirically from 1000 random label permutations was 46%). Dotted lines show that all bats are plotted in the same similarity space for ease of comparison. Adapted with permission from Accomando et al. (2017).
FIGURE 5
FIGURE 5
Effect of individual bat on temporal pattern similarity for Experiments 1 and 2. Comparison of normalized flight-by-flight pair-wise SSIMS distance within (black outline) and between (gray) bats for Experiment 1 (A) and Experiment 2 (B). Triangles indicate medians. Insets display the SSIMS projections, colored by bat (red = Bat 1, green = Bat 2, blue = Bat 3, and black = Bat 4). There was a significant difference in medians for between and within bats comparisons in both experiments (KW p < 0.0001). The ratio of between bats to within bats median SSIMS distance (B/W) is reported at the top of each plot. The B/W ratio is a measure of the effect size. The effect was more pronounced for Experiment 2: The ratio of between to within bat call pattern distances was 2.70 for Experiment 2 compared to 1.27 for Experiment 1. The normalized between-bat distances were significantly higher (KW p < 0.0001) for Experiment 2 (comparing the two gray distributions in A and B). Normalized within bat distances for Experiment 2 are significantly smaller than in Experiment 1 (KW p < 0.0001). Adapted with permission from Accomando et al. (2017).
FIGURE 6
FIGURE 6
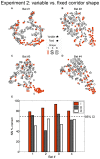
Effect of bat expectation on echolocation behavior. (A–D) Each star or dot represents a flight where the corridor configuration was straight (orange) (Configuration 1 in Figure 2), an S-curve (gray) (Configuration 6), or a reverse-S-curve (white with black outline) (Configuration 3). Dots represent flights from the fixed phase of Experiment 2, where the bats (A = Bat #1, B = Bat #2, C = Bat #3, D = Bat #4) each flew down the same corridor for 10 trials per day for several days. Stars represent flights that occurred in the variable phase of Experiment 2, where the corridor configuration was variable (i.e., unexpected) and changed pseudo-randomly from trial to trial. Flights in the unexpected straight-corridor (orange stars) had echolocation pulse trains that were classified as more similar to flights in the curved corridors than expected flights in the straight corridor (orange dots). (E) Histogram showing nearest-neighbor (NN) percent correct classification for each configuration and each bat (performed on 10D similarity estimates using leave-one-out cross validation). Dotted line represents the upper 95% confidence limit of the chance distribution (obtained empirically from 10,000 random label permutations). Histogram bars that cross the dotted line represent successful categorization of whether the flight occurred in the fixed or variable phase of Experiment 2. Adapted with permission from Accomando et al. (2017).
FIGURE 7
FIGURE 7
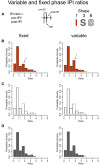
Higher probability of sonar sound grouping in unexpected straight flights. Without imposing limits on what constitutes a sonar sound group, one can look at the probable grouping of sounds by calculating the IPI ratio, or the pre-call time interval divided by the post-call time interval (Ratio = pre-IPI/post-IPI) (A) (Wheeler et al., 2016). Histograms in B–D show the proportions of IPI ratios for the same flights as in Figure 6. The fixed phase or expected flights are plotted in the left panels while the variable phase unexpected flights are plotted on the right. Straight corridor (shape 1) flights are in red (B), the reverse-S-curve flights (shape 6) are plotted in white, and the S-curve flights (shape 3) are plotted in gray (D). In the straight corridor configuration (B), bats emitted a greater proportion of calls having a post-IPI/pre-IPI ratio of 1.5–2 (arrows). The interval of time following these calls is roughly 1.5 times longer than the interval preceding these calls, which suggests that these calls represent the last call in a sonar sound group. The increase in proportion of these calls from the fixed to the variable phase indicates that bats use more sonar sound groups in unpredictable surroundings.

References

    1. Accomando A., Vargas-Irwin C., Simmons J. (2017). Neural spike train similarity algorithm detects differences in temporal patterning of bat echolocation call sequences. Proc. Meet. Acoust. 30:010002 10.1121/2.0000609 - DOI
    1. Aytekin M., Mao B., Moss C. F. (2010). Spatial perception and adaptive sonar behavior. J. Acoust. Soc. Am. 128 3788–3798. 10.1121/1.3504707 - DOI - PMC - PubMed
    1. Barchi J. R., Knowles J. M., Simmons J. A. (2013). Spatial memory and stereotypy of flight paths by big brown bats in cluttered surroundings. J. Exp. Biol. 216 1053–1063. 10.1242/jeb.073197 - DOI - PubMed
    1. Bates M. E., Stamper S. A., Simmons J. A. (2008). Jamming avoidance response of big brown bats in target detection. J. Exp. Biol. 211(Pt 1), 106–113. 10.1242/jeb.009688 - DOI - PubMed
    1. Denny M. (2007). Blip, Ping, Buzz: Making Sense of Radar and Sonar. Baltimore, MD: Johns Hopkins University Press.

LinkOut - more resources