

Changes in Brain Lateralization in Patients with Mild Cognitive Impairment and Alzheimer's Disease: A Resting-State Functional Magnetic Resonance Study from Alzheimer's Disease Neuroimaging Initiative
- PMID: 29472886
- PMCID: PMC5810419
- DOI: 10.3389/fneur.2018.00003
Changes in Brain Lateralization in Patients with Mild Cognitive Impairment and Alzheimer's Disease: A Resting-State Functional Magnetic Resonance Study from Alzheimer's Disease Neuroimaging Initiative
Abstract
Purpose: To detect changes in brain lateralization in patients with mild cognitive impairment (MCI) and Alzheimer's disease (AD) using resting-state functional magnetic resonance imaging (fMRI).
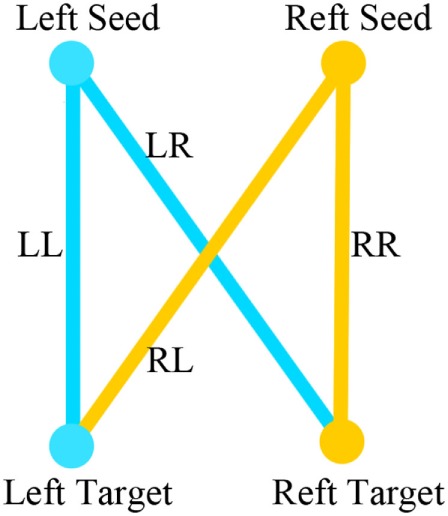
Materials and methods: Data from 61 well-matched right-handed subjects were obtained from the Alzheimer's Disease Neuroimaging Initiative, including 19 healthy controls (HCs), 25 patients with MCI, and 17 patients with AD. First, we divided 256 pairs of seed regions from each hemisphere covering the entire cerebral gray matter. Then, we used the intrinsic laterality index (iLI) approach to quantify the functional laterality using fMRI. One-way ANOVA was employed to estimate the differences in iLI among the three groups. The sum, number and mean value of the iLI were calculated within the thresholds of 0 < |iLI| < 0.2, 0.2 ≤ |iLI| < 0.4, 0.4 ≤ |iLI| < 0.8, and |iLI| ≥ 0.8, to explore the changes in the lateralization of resting-state brain function in patients with MCI and AD.
Results: One-way ANOVA revealed that the iLIs of the three groups were significantly different. The HCs showed a significant leftward interhemispheric difference within |iLI| ≥ 0.8. Compared with the HCs, the patients with MCI manifested a distinct abnormal rightward interhemispheric asymmetry, mainly within the thresholds of 0.2 ≤ |iLI| < 0.4 and 0.4 ≤ |iLI| < 0.8; in the patients with AD, the normal leftward lateralization that was observed in the HCs disappeared, and an abnormal rightward laterality was expressed within 0.4 ≤ |iLI| < 0.8. By directly comparing the patients with MCI with the patients with AD, an exclusive abnormal rightward laterality was observed in the patients with MCI within the 0.2 ≤ |iLI| < 0.4 threshold, and the normal leftward asymmetry vanished in the patients with AD within the |iLI| ≥ 0.8 threshold.
Conclusion: Global brain lateralization was different among three groups. The abnormal rightward dominance observed in the patients with MCI and AD may indicate that these patients use additional brain resources to compensate for the loss of cognitive function, and the observed disappearance of the leftward laterality in the patients with AD was likely associated with the damage in the left hemisphere. The observed disappearance of the rightward asymmetry in the patients with AD using the 0.2 ≤ |iLI| < 0.4 threshold was likely a sign of decompensation. Our study provides new insights that may improve our understanding of MCI and AD.
Keywords: Alzheimer’s disease; brain lateralization; intrinsic laterality index; mild cognitive impairment; resting-state functional magnetic resonance imaging.
Figures


References
-
- McGraw P, Mathews VP, Wang Y, Phillips MD. Approach to functional magnetic resonance imaging of language based on models of language organization. Neuroimaging Clin N Am (2001) 11:343. - PubMed
LinkOut - more resources
Full Text Sources
Other Literature Sources