

Dynamics and Control of Flagella Assembly in Salmonella typhimurium
- PMID: 29473025
- PMCID: PMC5809477
- DOI: 10.3389/fcimb.2018.00036
Dynamics and Control of Flagella Assembly in Salmonella typhimurium
Abstract
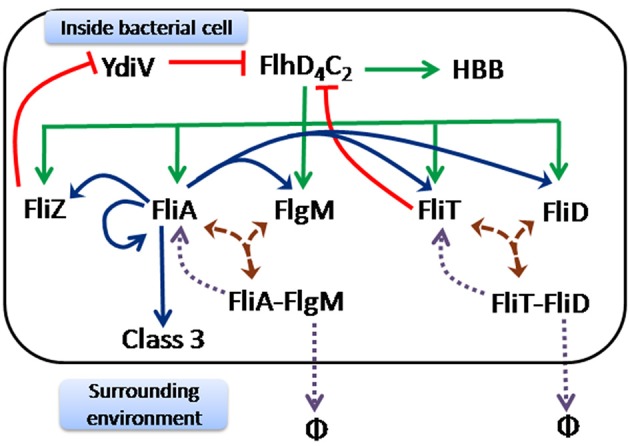
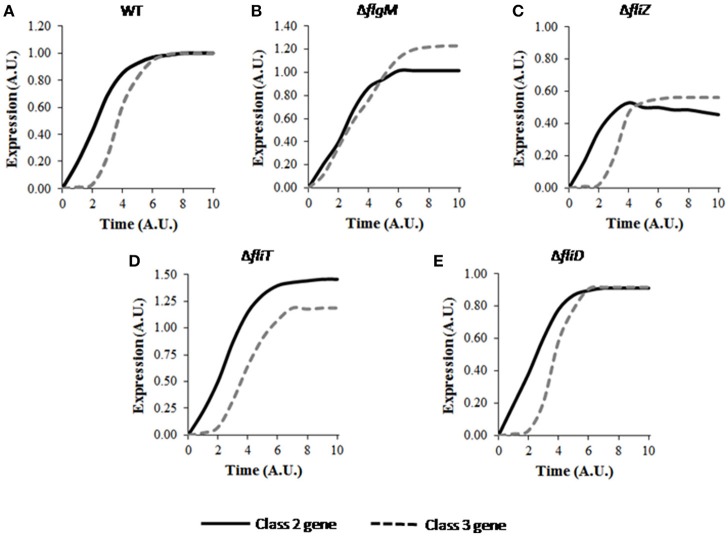
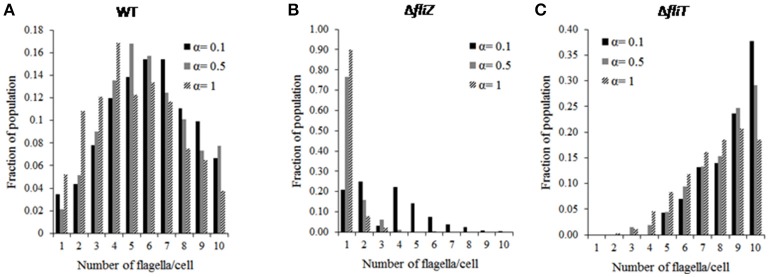
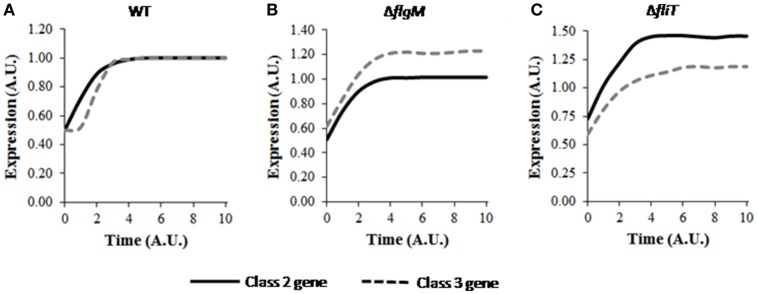
The food-borne pathogen Salmonella typhimurium is a common cause of infections and diseases in a wide range of hosts. One of the major virulence factors associated to the infection process is flagella, which helps the bacterium swim to its preferred site of infection inside the host, the M-cells (Microfold cells) lining the lumen of the small intestine. The expression of flagellar genes is controlled by an intricate regulatory network. In this work, we investigate two aspects of flagella regulation and assembly: (a) distribution of the number of flagella in an isogenic population of bacteria and (b) dynamics of gene expression post cell division. More precisely, in a population of bacteria, we note a normal distribution of number of flagella assembled per cell. How is this distribution controlled, and what are the key regulators in the network which help the cell achieve this? In the second question, we explore the role of protein secretion in dictating gene expression dynamics post cell-division (when the number of hook basal bodies on the cell surface is reduced by a factor of two). We develop a mathematical model and perform stochastic simulations to address these questions. Simulations of the model predict that two accessory regulators of flagella gene expression, FliZ and FliT, have significant roles in maintaining population level distribution of flagella. In addition, FliT and FlgM were predicted to control the level and temporal order of flagellar gene expression when the cell adapts to post cell division consequences. Further, the model predicts that, the FliZ and FliT dependent feedback loops function under certain thresholds, alterations in which can substantially affect kinetics of flagellar genes. Thus, based on our results we propose that, the proteins FlgM, FliZ, and FliT, thought to have accessory roles in regulation of flagella, likely play a critical role controlling gene expression during cell division, and frequency distribution of flagella.
Keywords: Salmonella typhimurium; flagella; gene expression dynamics; gene regulation; mathematical model.
Figures
Similar articles
-
Mathematical model of flagella gene expression dynamics in Salmonella enterica serovar typhimurium.Syst Synth Biol. 2015 Jun;9(1-2):19-31. doi: 10.1007/s11693-015-9160-3. Epub 2015 Feb 4. Syst Synth Biol. 2015. PMID: 25972986 Free PMC article.
-
The interaction dynamics of a negative feedback loop regulates flagellar number in Salmonella enterica serovar Typhimurium.Mol Microbiol. 2010 Dec;78(6):1416-30. doi: 10.1111/j.1365-2958.2010.07415.x. Epub 2010 Oct 15. Mol Microbiol. 2010. PMID: 21143315
-
FliZ Is a posttranslational activator of FlhD4C2-dependent flagellar gene expression.J Bacteriol. 2008 Jul;190(14):4979-88. doi: 10.1128/JB.01996-07. Epub 2008 May 9. J Bacteriol. 2008. PMID: 18469103 Free PMC article.
-
Regulation of flagellar assembly.Curr Opin Microbiol. 2002 Apr;5(2):160-5. doi: 10.1016/s1369-5274(02)00302-8. Curr Opin Microbiol. 2002. PMID: 11934612 Review.
-
Bacterial flagellation and cell division.Genes Cells. 1998 Oct;3(10):625-34. doi: 10.1046/j.1365-2443.1998.00219.x. Genes Cells. 1998. PMID: 9893020 Review.
Cited by
-
Controlling tumor progression and recurrence in mice through combined treatment with a PD-L1 inhibitor and a designer Salmonella strain that delivers GM-CSF.Acta Pharm Sin B. 2024 Dec;14(12):5479-5492. doi: 10.1016/j.apsb.2024.07.011. Epub 2024 Jul 10. Acta Pharm Sin B. 2024. PMID: 39807328 Free PMC article.
-
A mathematical model of flagellar gene regulation and construction in Salmonella enterica.PLoS Comput Biol. 2020 Oct 22;16(10):e1007689. doi: 10.1371/journal.pcbi.1007689. eCollection 2020 Oct. PLoS Comput Biol. 2020. PMID: 33090999 Free PMC article.
-
The Mystery of Piezophiles: Understudied Microorganisms from the Deep, Dark Subsurface.Microorganisms. 2023 Jun 22;11(7):1629. doi: 10.3390/microorganisms11071629. Microorganisms. 2023. PMID: 37512802 Free PMC article. Review.
-
Agaric acid reduces Salmonella biofilm formation by inhibiting flagellar motility.Biofilm. 2020 May 29;2:100022. doi: 10.1016/j.bioflm.2020.100022. eCollection 2020 Dec. Biofilm. 2020. PMID: 33447808 Free PMC article.
-
Motility increase of adherent invasive Escherichia coli (AIEC) induced by a sub-inhibitory concentration of recombinant endolysin LysPA90.Front Microbiol. 2022 Dec 22;13:1093670. doi: 10.3389/fmicb.2022.1093670. eCollection 2022. Front Microbiol. 2022. PMID: 36619993 Free PMC article.
References
-
- Aldridge P. D., Karlinsey J. E., Aldridge C., Birchall C., Thompson D., Yagasaki J., et al. . (2006). The flagellar-specific transcription factor, sigma28, is the Type III secretion chaperone for the flagellar-specific anti-sigma28 factor FlgM. Genes Dev. 20, 2315–2326. 10.1101/gad.380406 - DOI - PMC - PubMed
Publication types
MeSH terms
LinkOut - more resources
Full Text Sources
Other Literature Sources
Medical