. 2018 Mar 21;140(11):4004-4017.
doi: 10.1021/jacs.7b12874. Epub 2018 Mar 8.

Chemo- and Regioselective Lysine Modification on Native Proteins

Affiliations

Chemo- and Regioselective Lysine Modification on Native Proteins

Maria J Matos et al. J Am Chem Soc. .

Abstract

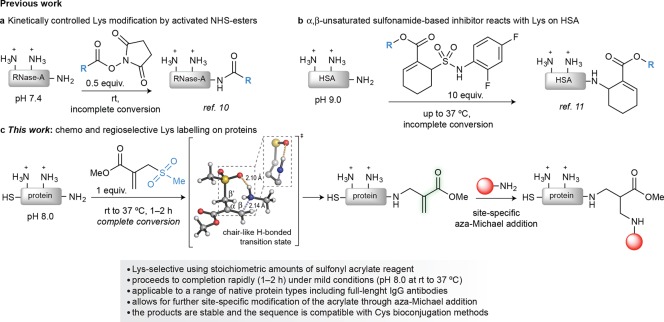
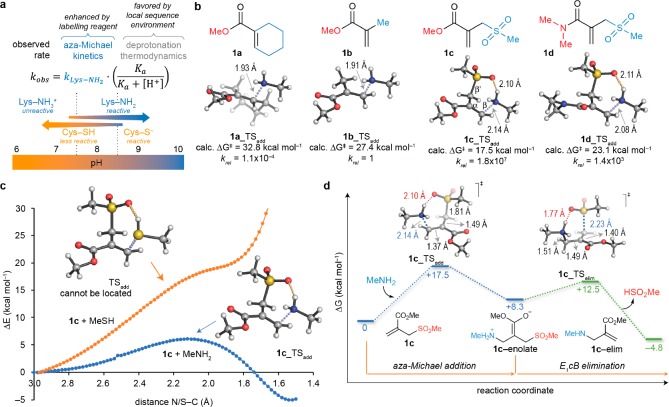
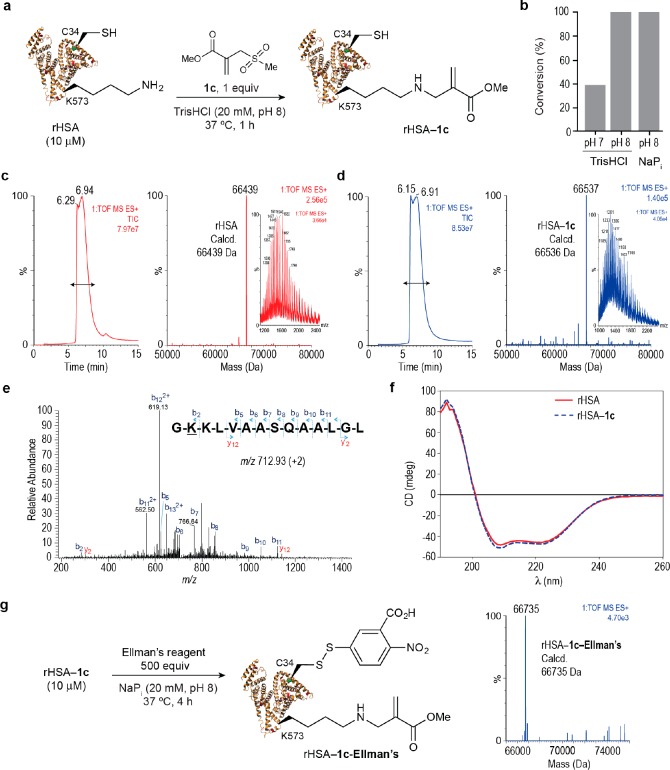
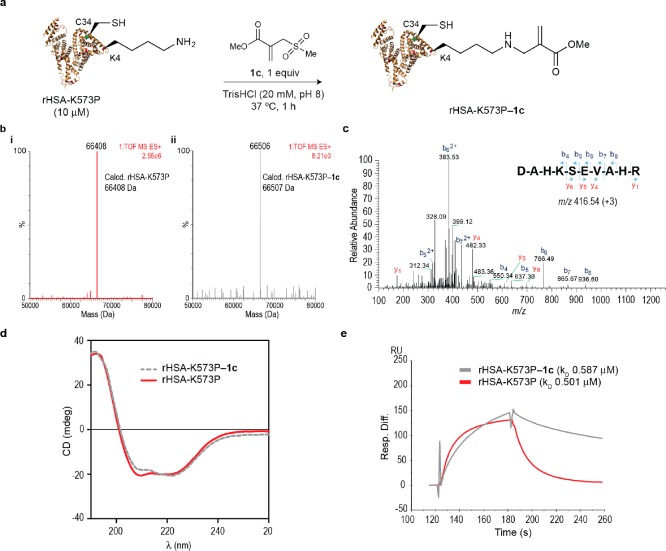
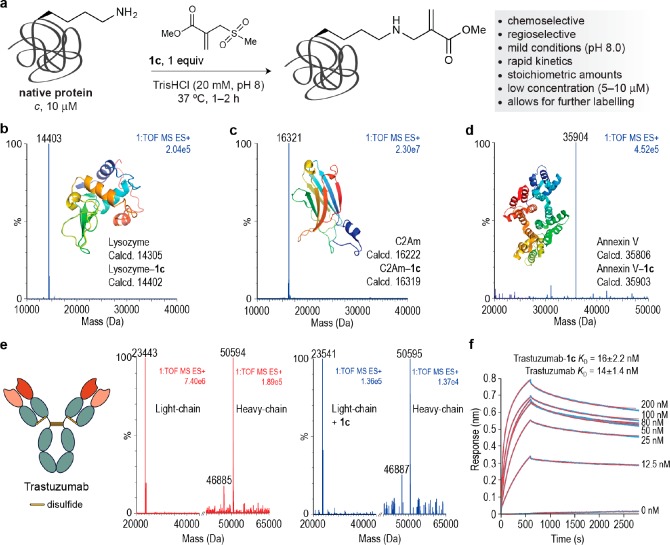
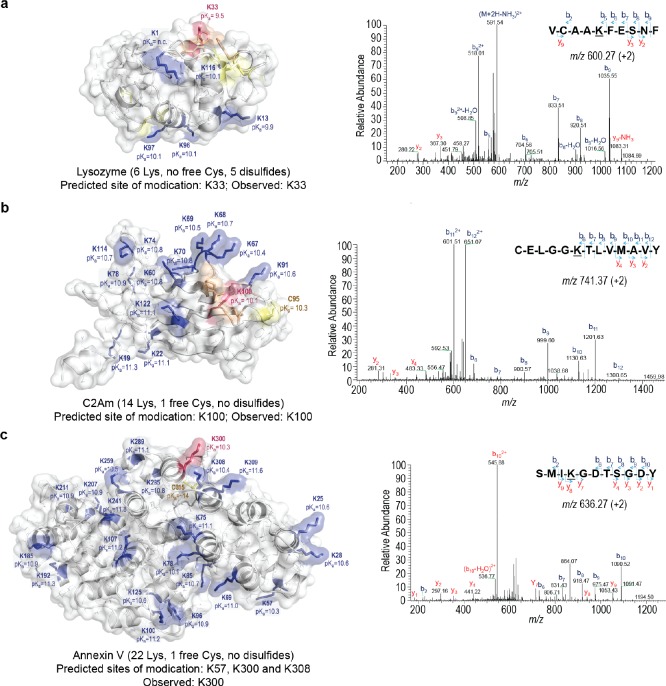
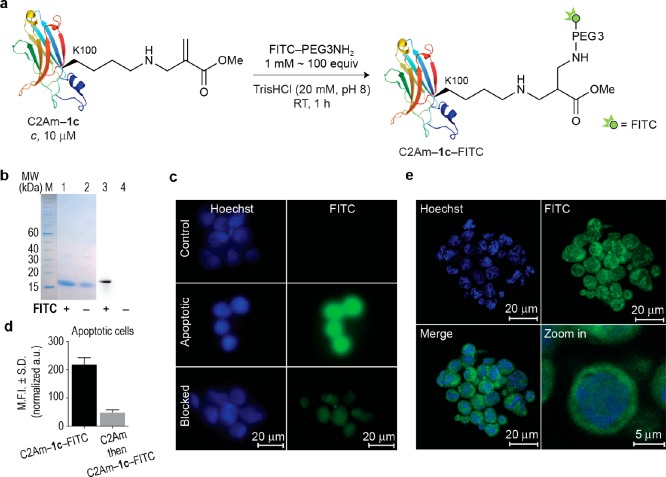
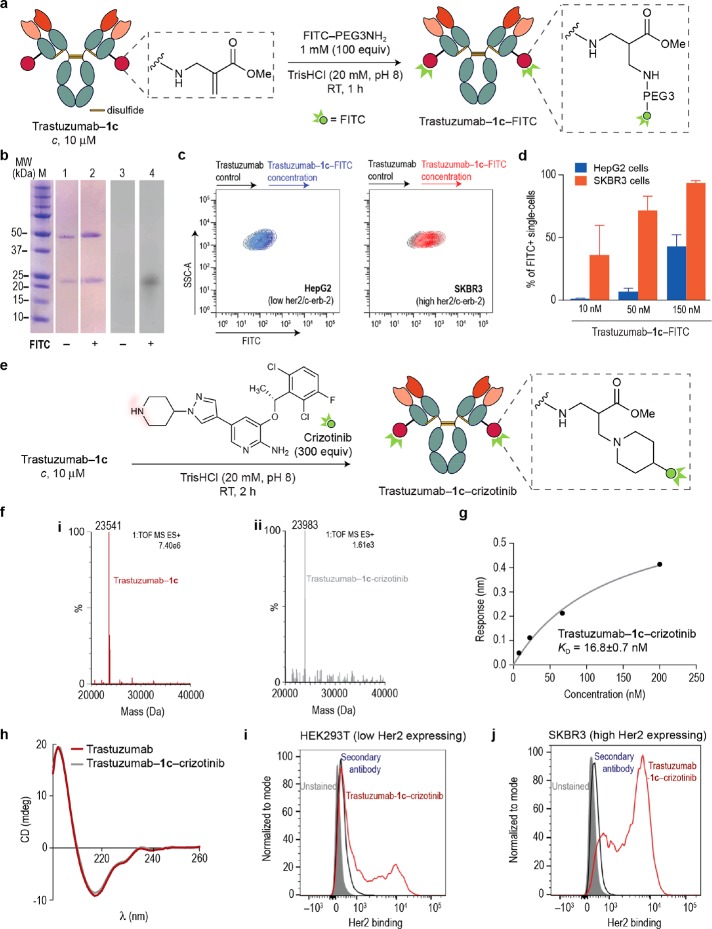
Site-selective chemical conjugation of synthetic molecules to proteins expands their functional and therapeutic capacity. Current protein modification methods, based on synthetic and biochemical technologies, can achieve site selectivity, but these techniques often require extensive sequence engineering or are restricted to the N- or C-terminus. Here we show the computer-assisted design of sulfonyl acrylate reagents for the modification of a single lysine residue on native protein sequences. This feature of the designed sulfonyl acrylates, together with the innate and subtle reactivity differences conferred by the unique local microenvironment surrounding each lysine, contribute to the observed regioselectivity of the reaction. Moreover, this site selectivity was predicted computationally, where the lysine with the lowest p Ka was the kinetically favored residue at slightly basic pH. Chemoselectivity was also observed as the reagent reacted preferentially at lysine, even in those cases when other nucleophilic residues such as cysteine were present. The reaction is fast and proceeds using a single molar equivalent of the sulfonyl acrylate reagent under biocompatible conditions (37 °C, pH 8.0). This technology was demonstrated by the quantitative and irreversible modification of five different proteins including the clinically used therapeutic antibody Trastuzumab without prior sequence engineering. Importantly, their native secondary structure and functionality is retained after the modification. This regioselective lysine modification method allows for further bioconjugation through aza-Michael addition to the acrylate electrophile that is generated by spontaneous elimination of methanesulfinic acid upon lysine labeling. We showed that a protein-antibody conjugate bearing a site-specifically installed fluorophore at lysine could be used for selective imaging of apoptotic cells and detection of Her2+ cells, respectively. This simple, robust method does not require genetic engineering and may be generally used for accessing diverse, well-defined protein conjugates for basic biology and therapeutic studies.


Conflict of interest statement

The authors declare no competing financial interest.

Figures

Figure 1
Figure 1
Overview of methods for lysine labeling. (a) Kinetically controlled labeling of lysine on proteins using an activated ester electrophile. (b) PEG-modified TAK-242, a Toll-like receptor 4 inhibitor reacts with a single lysine on human serum albumin. These isolated examples of site-selective lysine modification do not proceed to completion and have been applied to a limited number of proteins. In addition, these approaches were mostly used for the introduction of tags for a further labeling reaction (e.g., copper(I) catalyzed azide–alkyne cycloaddition). (c) This work: Hydrogen bond assisted chemo- and regioselective modification of lysine on native proteins. The addition reaction proceeds through a H-bonded chair-like addition transition state leading to the subsequent spontaneous elimination of methanesulfinic acid; this restores a type 2 alkene that undergoes site-specific modification through aza-Michael addition of suitable synthetic molecules bearing an amine nucleophile.
Figure 2
Figure 2
Computer-assisted design of acrylate electrophile reagents for lysine modification. (a) At near physiological pH (7.5–8.0), lysine residues compete with cysteine as Michael donors. At lower values (typically pH 5.5–6.0) lysine residues are mostly protonated and unreactive, while under more basic conditions (pH > 8.5) the more nucleophilic thiolate of cysteine residues usually dominate. Thus, using stoichiometric amounts of the donor at pH 7.5–8.0, the outcome of the kinetically controlled aza-Michael addition reaction will be determined by the relative reactivity of each lysine (kobs), which is in turn determined by their intrinsic nucleophilicity (kLys–NH2) and acidity (Ka). Highly reactive reagents can be designed to amplify the intrinsic nucleophilicity of lysine side chains for aza-Michael ligation, while their acidity is regulated by the local sequence microenvironment. As a result, enhanced reactivities can be obtained for certain individual lysine residues, leading to high kinetic site selectivity. (b) Acrylate electrophile derivatives 1ad used in this study and transition states (TS, activation energies ΔG in kcal mol–1) calculated with PCM(H2O)/M06-2X/6-31+g(d,p) for the aza-Michael addition of methylamine (abbreviated lysine model). Interatomic distances (in angstrom) for the forming C–N and hydrogen bonds are shown as blue and orange dashed lines, respectively. The β′-sulfone moiety in 1c stabilizes the aza-Michael transition state through precise hydrogen bonding to the reacting amine, providing a ten-million-fold acceleration with respect to methyl methacrylate 1b. (c) Such hydrogen bonding is much weaker with methanethiol (model for cysteine), and thus competitive sulfa-Michael addition transition structures or stable intermediates cannot be located on the relaxed potential energy surface (PES). The origin for this continuously uphill reaction profile with the cysteine model is the inability of the sulfone group present in 1c to stabilize the positive charge developed at the thiol group upon nucleophilic addition. Conversely, the positive charge developed at the amino group of the lysine model is efficiently dissipated by the sulfone in 1c, as revealed by the exothermic reaction profile; the zwitterionic enolate is more stable than the reactants. This constitutes the basis for lysine chemoselectivity in the presence of predominantly protonated cysteines. (d) Complete minimum-energy reaction pathway for the aza-Michael addition reaction of methylamine and sulfonyl acrylate 1c, followed by spontaneous elimination of methanesulfinic acid. The initial addition is the rate-limiting step. Hydrogen bonding between the nucleophilic amino group and the sulfone moiety promotes both the aza-Michael addition and the elimination of methanesulfinic acid.
Figure 3
Figure 3
HSA lysine regioselective bioconjugation with sulfonyl acrylate reagent 1c. (a) Scheme for the bioconjugation reaction between rHSA and sulfonyl acrylate 1c. General reaction conditions: rHSA was reacted with 1c (1 mol equiv) in TrisHCl (20 mM, pH 8.0) at 37 °C for 1 h. (b) Optimization of reaction conditions with respect to buffer and pH (see also Supporting Table 3). (c,d) Total ion chromatogram, combined ion series, and deconvoluted mass spectrum reconstructed from the ion series using the MaxEnt algorithm before (c) and after (d) the reaction. The region containing all protein is marked with a left right arrow. After the reaction, protein conjugates were purified using size-exclusion chromatography and the concentration of the starting protein and of the purified protein was measured by Bradford protein assay. Complete conversion to the desired rHSA–1c conjugate was observed in >95% yield. (e) MS/MS spectrum of the m/z 712.93 doubly charged ion of the lysine modified peptide GKKLVAASQAALGL from HSA. Modified residue underlined. (f) CD of rHSA and rHSA–1c. (g) Reaction of rHSA–1c with thiol specific Ellman’s reagent shows full conversion of cysteine 34 to the corresponding disulfide. Deconvoluted mass spectrum of rHSA–1c–Ellman’s.
Figure 4
Figure 4
Sequence-lysine conjugation effect of albumins on their binding affinity to human FcRn receptor. (a) Scheme for the bioconjugation reaction between mutant rHSA-K573P and sulfonyl acrylate 1c. General reaction conditions: rHSA-K573P was reacted with 1c (1 mol equiv) in TrisHCl (20 mM, pH 8.0) at 37 °C for 1 h. (b) Mass spectrometry characterization of lysine conjugation with 1c. ESI–MS spectra of rHSA-K573P (i) before (red) and (ii) after (gray) conjugation with 1c. (c) MS/MS spectrum of the m/z 416.54 triply charged ion of the lysine modified N-terminal peptide (1–10) DAHKSEVAHR. Modified residue underlined. (f) CD of rHSA-K573P and rHSA-K573P–1c. (d) CD analysis of the nonmodified rHSA-K573P and the conjugate rHSA-K573P–1c. (e) SPR comparison of the binding to human FcRn of rHSA-K573P and rHSA-K573P–1c.
Figure 5
Figure 5
Regioselective lysine modification is applicable to a wide-range of native protein scaffolds. (a) Optimized conditions to modify a single lysine on multiple native proteins. (b–d) ESI–MS spectra for three modified proteins showing a homogeneous product for each bioconjugation. Combined ion series and full ESI–MS spectra can be found in the Supporting Information. (e) ESI–MS spectra before (red) and after (blue) conjugation of 1c to the full-length IgG antibody Trastuzumab. The addition of 99 Da occurred exclusively in the light chain of the antibody. (f) Biolayer Interferometry (BLI) curves (in blue) and fitting curves (in red) obtained for Trastuzumab–1c. For the curves of nonmodified, commercial Trastuzumab, see Supporting Figure 60. –– indicates disulfide bonds in Trastuzumab.
Figure 6
Figure 6
Theoretical calculation of the most reactive lysine residue on three proteins and obtained MS/MS spectra confirming the modified site. The pKa values for lysine and cysteine residues in (a) lysozyme, (b) synaptotagmin C2Am domain, and (c) Annexin V were estimated through constant pH Molecular Dynamics simulations (CpHMD); deeply buried cysteine residues such as C315 in Annexin V could not be fully titrated in the pH 5–14 range; terminal residues cannot be evaluated through the CpHMD method (pKa value not calculated). These values are mapped onto surface representations for each protein (lysine and cysteine highlighted in blue and yellow, respectively). The lowest pKa lysine for each protein is highlighted in red; in agreement with these predictions, the lowest pKa lysine residues are the ones selectively modified as found through enzymatic digestion followed by LC–MS/MS analysis (modified residues underlined). Hydrophobic residues around the reactive lysines (shown in orange) contribute to lower their pKa.
Figure 7
Figure 7
Site-selective fluorescence labeling of the lysine–acrylate 1c derivative through aza-Michael ligation: application for the selective imaging and detection of apoptotic positive cells. (a) Scheme for the site-selective labeling of C2Am–1c with commercially available FITC–PEG3NH2. General reaction conditions: C2Am–1c was reacted with FITC–PEG3NH2 (100 mol equiv) in TrisHCl (20 mM, pH 8.0) at room temperature for 1 h. (b) Treatment of C2Am–1c with FITC–PEG3NH2 gave a single new fluorescent band as detected by SDS-PAGE that is consistent with site-selective incorporation of FITC. Lanes 1 and 2, Coomassie staining. Lanes 3 and 4, fluorescence. (c) Epifluorescence images of nonapoptotic (control) and apoptotic HEK293 cells after labeling with C2Am–1c–FITC. Blocking studies were performed by preincubating apoptotic cells with a 10× excess of nonfluorescent C2Am before incubation with C2Am–1c–FITC. (d) The mean fluorescent intensity (M.F.I.) of apoptotic cells incubated with C2Am–1c–FITC (black bar) or blocked with nonfluorescent C2Am before incubation with C2Am–1c–FITC (gray bar). (e) Confocal images of apoptotic cells treated with C2Am–1c–FITC. Zoom in and Z-stacking showing staining of the cellular membrane. Membranes of apoptotic cells are shown in green, while the nuclei in blue. S.D., standard deviation; a.u., arbitrary units; FITC, fluorescein isothiocyanate; PEG, polyethylene glycol.
Figure 8
Figure 8
Site-specific aza-Michael installation of FITC–PEG3NH2 and the anticancer drug crizotinib into Trastuzumab–1c preserves Her2 binding affinity and the capacity to selectively detect Her2 positive cells. (a) Scheme for the site-specific labeling of Trastuzumab–1c with commercially available FITC–PEG3NH2. General reaction conditions: Trastuzumab–1c was reacted with FITC–PEG3NH2 (100 mol equiv) in TrisHCl (20 mM, pH 8.0) at room temperature for 1 h. (b) Treatment of Trastuzumab–1c with FITC–PEG3NH2 afforded a new fluorescent band as detected by SDS-PAGE that is consistent with site-selective incorporation of FITC within the light chain of Trastuzumab. Lanes 1–2, Coomassie staining. Lanes 3–4, fluorescence. From the bottom to the top: a band around 20–25 kDa (light chain); a band around 50 kDa (heavy chain). (c, d) Analysis of specificity of Trastuzumab–1c–FITC toward Her2 by flow cytometry. (c) Superposition of contour plots of side-scatter detection versus FITC-equivalent fluorescence intensity, in HepG2 cells (blue, expressing low levels of Her2/c-erb-2), and in SKBR3 cells (red, expressing high levels of Her2/c-erb-2). Controls were treated with nonconjugated Trastuzumab while samples were treated with increasing concentrations of Trastuzumab–1c–FITC (10, 50, and 150 nM). (d) Percentage of FITC-positive single cells, after treatment with fluorescently labeled or nonlabeled Trastuzumab, in both HepG2 cells (blue) and SKBR3 cells (orange). (e) Scheme for the site-specific conjugation of crizotinib to Trastuzumab–1c. General reaction conditions: Trastuzumab–1c (10 μM) was reacted with crizotinib (10 mM, 1000 mol equiv) in TrisHCl (20 mM, pH 8.0) at room temperature for 2 h. (f) Mass spectrometry characterization of site-specific drug conjugation. ESI–MS spectra of the light chain (i) before (red) and (ii) after (gray) conjugation of the anticancer drug crizotinib to Trastuzumab–1c. Calculated mass for the light chain of Trastuzumab–1c–crizotinib, 23986 Da. (g) KD constant derived from BLI experiments for Trastuzumab–1c–crizotinib. For the BLI curves obtained with the Her2 receptor see Supporting Figure 61. (h) CD of Trastuzumab and Trastuzumab–1c–crizotinib. (i, j) HEK293T cells (expressing low levels of Her2/c-erb-2) and SKBR3 cells (expressing high levels of Her2/c-erb-2) were incubated with 10 μM of Trastuzumab–1c–crizotinib and analyzed by flow cytometry.

Similar articles

Cited by

References

    1. Stephanopoulos N.; Francis M. B. Nat. Chem. Biol. 2011, 7, 876–884. 10.1038/nchembio.720. - DOI - PubMed
    1. Spicer C. D.; Davis B. G. Nat. Commun. 2014, 5, 4740.10.1038/ncomms5740. - DOI - PubMed
    1. Lang K.; Chin J. W. Chem. Rev. 2014, 114, 4764–4806. 10.1021/cr400355w. - DOI - PubMed
    1. Boutureira O.; Bernardes G. J. L. Chem. Rev. 2015, 115, 2174–2195. 10.1021/cr500399p. - DOI - PubMed
    1. Xue L.; Karpenko I. A.; Hiblot J.; Johnsson K. Nat. Chem. Biol. 2015, 11, 917–923. 10.1038/nchembio.1959. - DOI - PubMed

Publication types