. 2018 Feb 23;14(2):e1006007.
doi: 10.1371/journal.pcbi.1006007. eCollection 2018 Feb.

A biophysical model of dynamic balancing of excitation and inhibition in fast oscillatory large-scale networks

Affiliations

A biophysical model of dynamic balancing of excitation and inhibition in fast oscillatory large-scale networks

Romesh G Abeysuriya et al. PLoS Comput Biol. .

Abstract

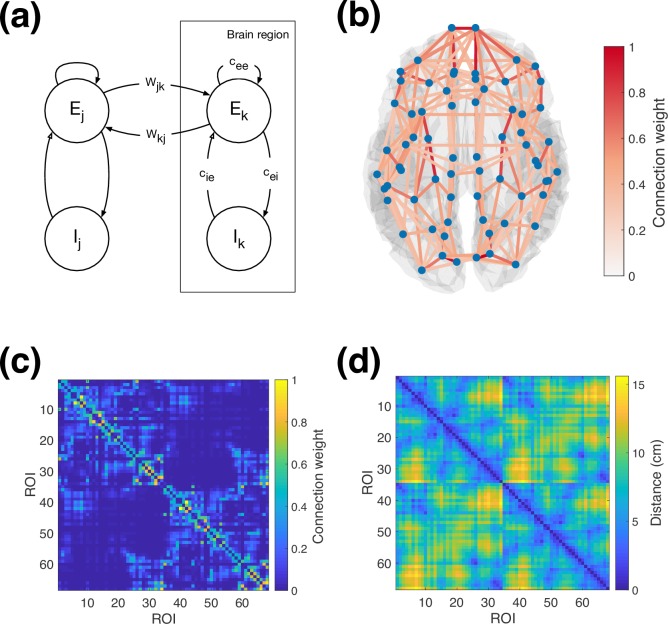
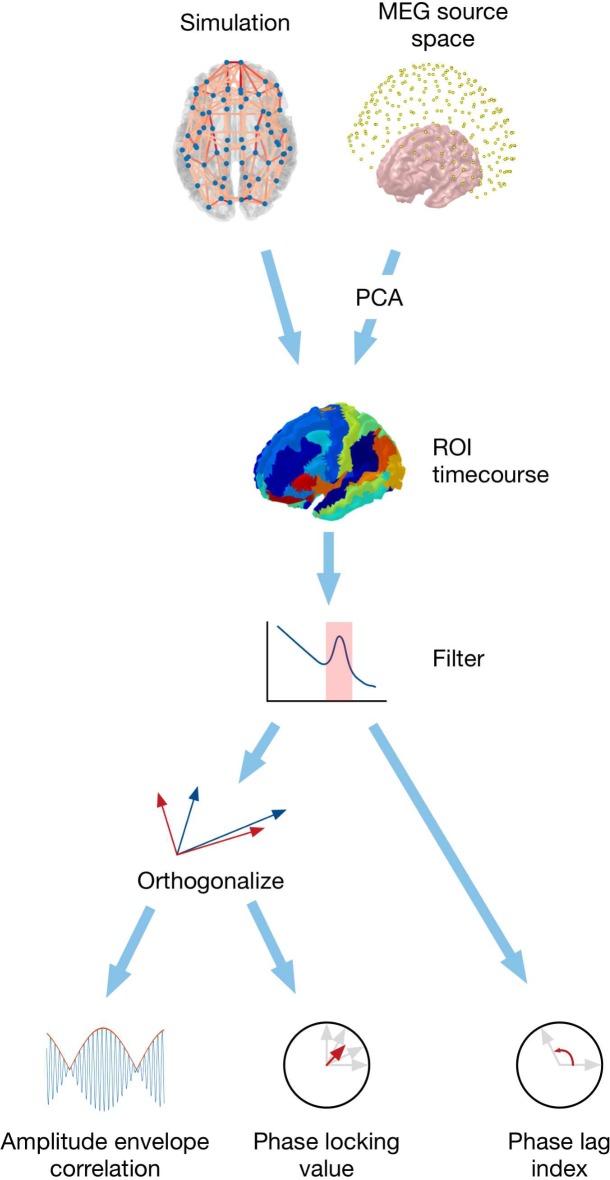
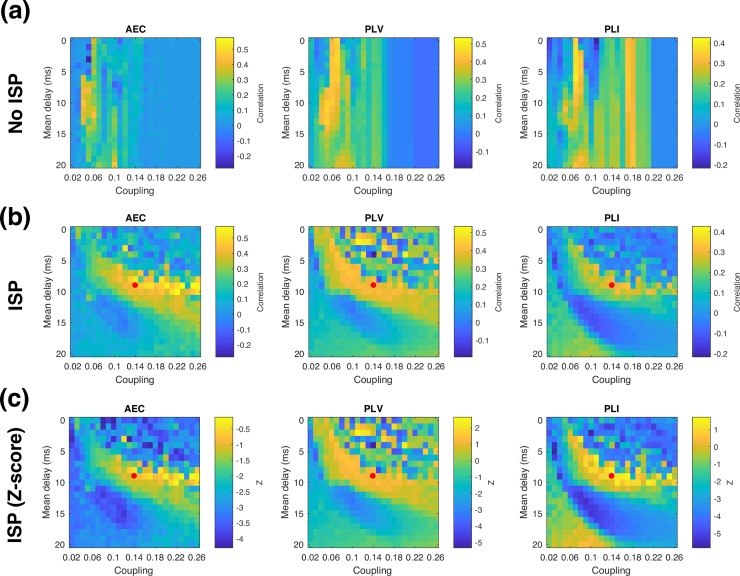
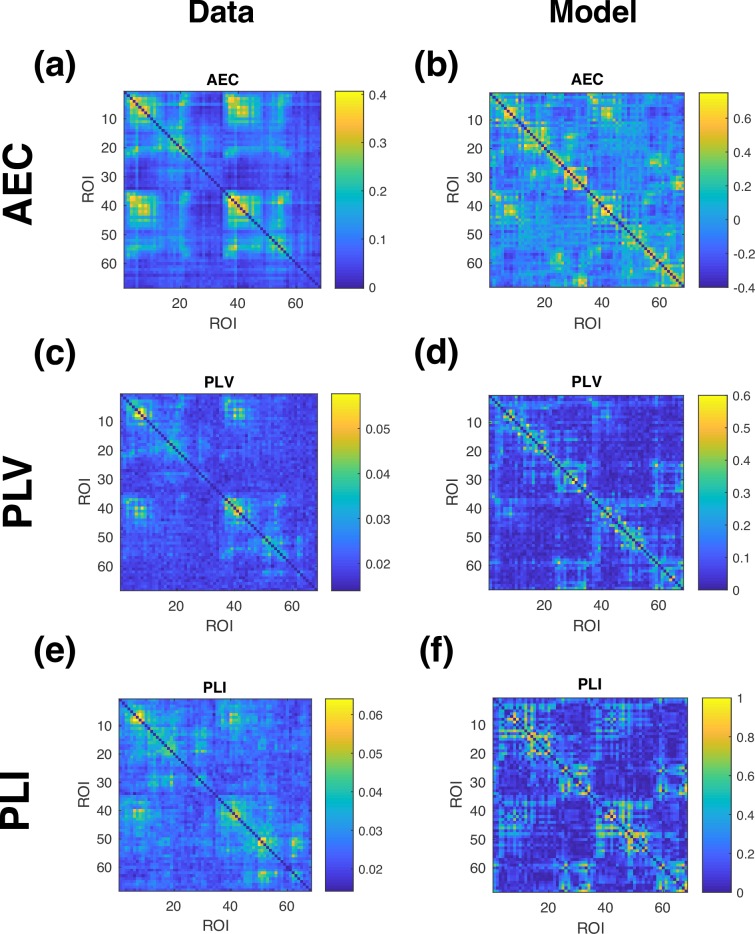
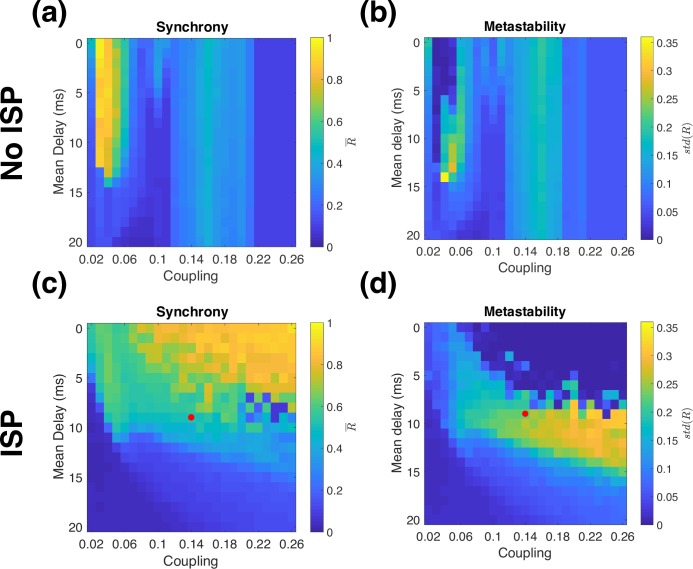
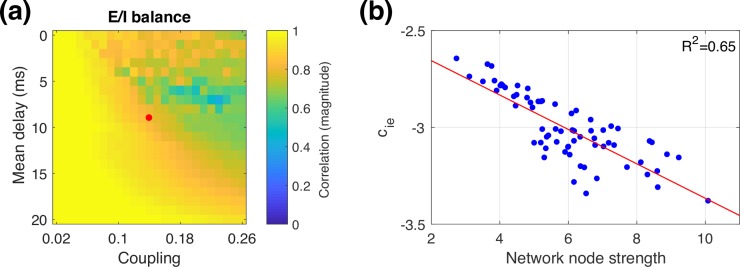
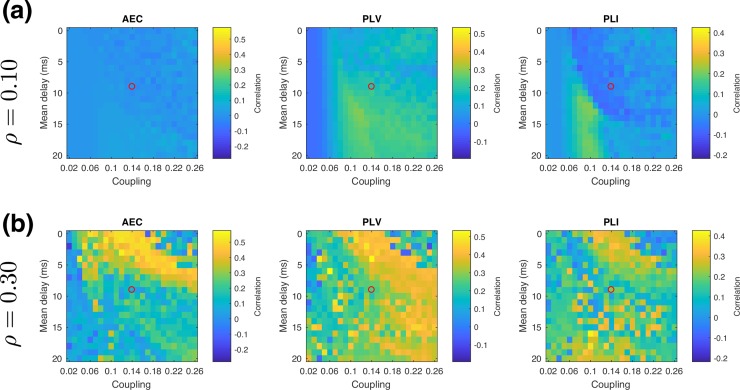
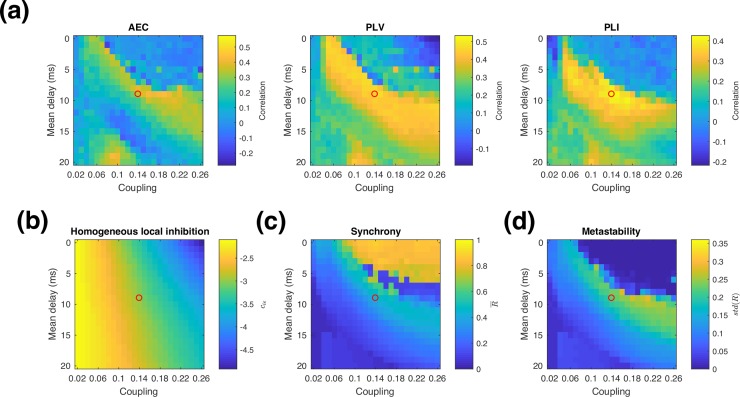
Over long timescales, neuronal dynamics can be robust to quite large perturbations, such as changes in white matter connectivity and grey matter structure through processes including learning, aging, development and certain disease processes. One possible explanation is that robust dynamics are facilitated by homeostatic mechanisms that can dynamically rebalance brain networks. In this study, we simulate a cortical brain network using the Wilson-Cowan neural mass model with conduction delays and noise, and use inhibitory synaptic plasticity (ISP) to dynamically achieve a spatially local balance between excitation and inhibition. Using MEG data from 55 subjects we find that ISP enables us to simultaneously achieve high correlation with multiple measures of functional connectivity, including amplitude envelope correlation and phase locking. Further, we find that ISP successfully achieves local E/I balance, and can consistently predict the functional connectivity computed from real MEG data, for a much wider range of model parameters than is possible with a model without ISP.


Conflict of interest statement

The authors have declared that no competing interests exist.

Figures

Fig 1
Fig 1. Overview of model structure.
(a) Schematic of Wilson-Cowan neural populations and connections between, both within and between brain regions. (b) Overview of parcel centres and connectivity between them from the Desikan-Killiany parcellation and tractography. The strongest 10% of connections are displayed. (c) Anatomical connectivity matrix used for simulations (d) Distance matrix used for simulations. The labels mapping ROI index to brain region are provided in S1 Text.
Fig 2
Fig 2. Overview of analysis pipeline for simulated neural activity and MEG data.
After computing activity timecourses for each region, both simulated and real signals are processed through the same pipeline.
Fig 3
Fig 3. Typical model neural activity.
(a) Raw excitatory activity timecourse (blue) and corresponding orthogonalised alpha band envelope (red) for the left pericalcarine parcel, which is well correlated with the right pericalcarine as shown in Fig 5B. The envelope timecourse in right pericalcarine (green) is strongly correlated with the envelope timecourse in left pericalcarine–these correlations correspond to the AEC reported in Figs 4 and 5. (b) Power spectrum of excitatory activity, averaged over all brain regions. The red bars show the position and size of the alpha band analysis window relative to the spectral peak.
Fig 4
Fig 4. Similarity in functional connectivity metrics.
Similarity between model and data in each functional connectivity metric is shown for different global coupling and velocity regimes (a) Without ISP, (b) With ISP. The red dot marks the representative parameters from the optimal regime shown in Figs 5 and 7. (c). Similarity measure with ISP expressed as a z-score based on individual variability.
Fig 5
Fig 5. Alpha band functional connectivity profiles in data and model.
Functional connectivity in (a,b) AEC, (c,d) PLV,and (e,f) PLI, shown in data, and in the model for the parameters marked by the red dot in Figs 4, 6 and 7.
Fig 6
Fig 6. Synchrony and metastability.
Alpha band synchrony (averaged over time) and metastability (standard deviation of synchrony), in the model (a,b) without ISP (c,d) with ISP. The red dot corresponds to the parameters shown in Figs 5 and 7.
Fig 7
Fig 7. Balance of excitation and inhibition.
(a) Magnitude of correlation between node strength and cie for a range of global couplings and delays. The red dot corresponds to the parameters shown in Fig 5. (b) cie values plotted against network node strength, for the parameters marked in panel (a) by the red dot, with a linear fit (red line).
Fig 8
Fig 8. Different ISP target activity levels.
Similarity between model and data is shown for each functional connectivity metrics for (a) low and (b) high ISP targets. The open circles correspond to the representative optimal delay and coupling values shown in Fig 4 and used in Figs 5 and 7.
Fig 9
Fig 9
Homogeneous model parameters. (a) Functional connectivity similarity between model and data with uniform cie set to the mean value of cie for the corresponding ISP simulation at the same global coupling and delay values (b) Mean value of cie obtained from ISP simulations (c) alpha band synchrony (averaged over time), and (d) metastability (standard deviation of synchrony). The open circles correspond to the representative optimal delay and coupling values shown in Fig 4 and used in Figs 5 and 7.

References

    1. Cabral J, Luckhoo H, Woolrich M, Joensson M, Mohseni H, Baker A, et al. Exploring mechanisms of spontaneous functional connectivity in MEG: How delayed network interactions lead to structured amplitude envelopes of band-pass filtered oscillations. Neuroimage. 2014;90: 423–435. doi: 10.1016/j.neuroimage.2013.11.047 - DOI - PubMed
    1. Cabral J, Hugues E, Sporns O, Deco G. Role of local network oscillations in resting-state functional connectivity. Neuroimage. 2011;57: 130–139. doi: 10.1016/j.neuroimage.2011.04.010 - DOI - PubMed
    1. Váša F, Shanahan M, Hellyer PJ, Scott G, Cabral J, Leech R. Effects of lesions on synchrony and metastability in cortical networks. Neuroimage. 2015;118: 456–467. doi: 10.1016/j.neuroimage.2015.05.042 - DOI - PubMed
    1. Kuramoto Y. Chemical Oscillations, Waves, and Turbulence. New York: Springer-Verlag; 1984.
    1. Kuramoto Y. Self-entrainment of a population of coupled non-linear oscillators In: Araki H, editor. International Symposium on Mathematical Problems in Theoretical Physics. Berlin, Heidelberg: Springer Berlin Heidelberg; 1975. Pp. 420–422. doi: 10.1007/bfb0013365 - DOI

Publication types

LinkOut - more resources