. 2018 Feb 23;13(2):e0192707.
doi: 10.1371/journal.pone.0192707. eCollection 2018.

Support surfaces for pressure ulcer prevention: A network meta-analysis

Affiliations

Support surfaces for pressure ulcer prevention: A network meta-analysis

Chunhu Shi et al. PLoS One. .

Abstract

Background: Pressure ulcers are a prevalent and global issue and support surfaces are widely used for preventing ulceration. However, the diversity of available support surfaces and the lack of direct comparisons in RCTs make decision-making difficult.

Objectives: To determine, using network meta-analysis, the relative effects of different support surfaces in reducing pressure ulcer incidence and comfort and to rank these support surfaces in order of their effectiveness.

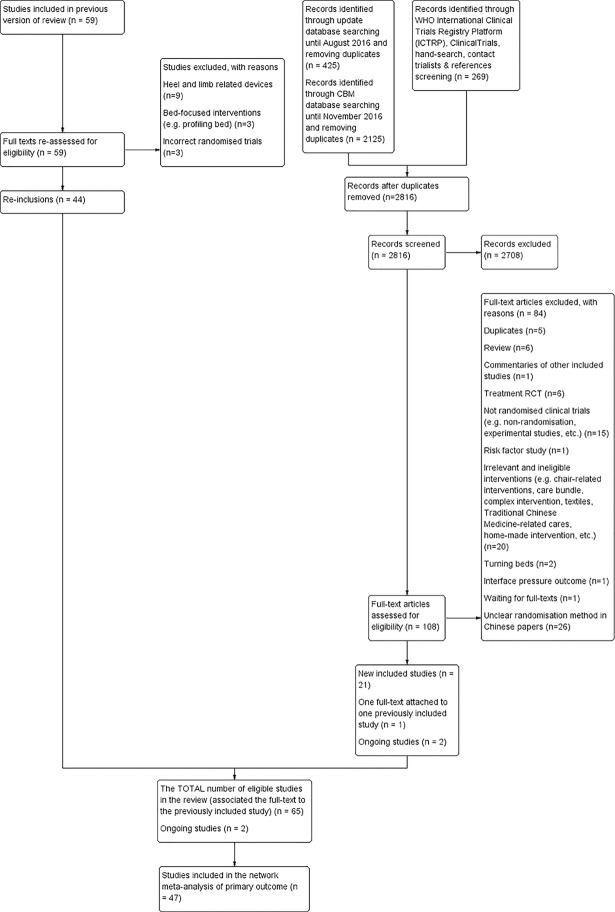
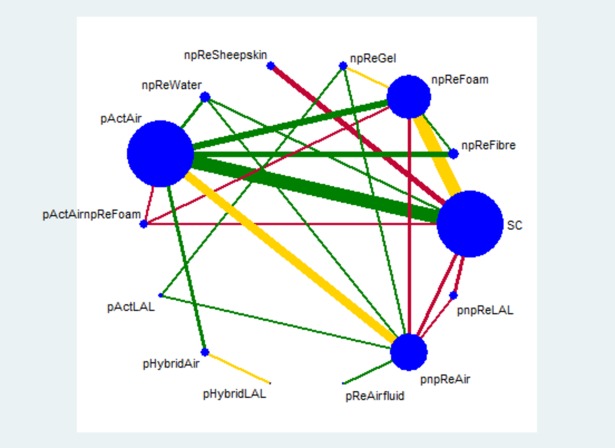
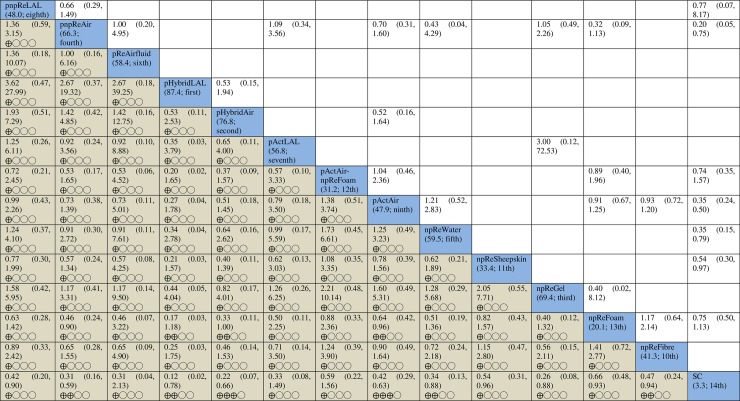
Methods: We conducted a systematic review, using a literature search up to November 2016, to identify randomised trials comparing support surfaces for pressure ulcer prevention. Two reviewers independently performed study selection, risk of bias assessment and data extraction. We grouped the support surfaces according to their characteristics and formed evidence networks using these groups. We used network meta-analysis to estimate the relative effects and effectiveness ranking of the groups for the outcomes of pressure ulcer incidence and participant comfort. GRADE was used to assess the certainty of evidence.

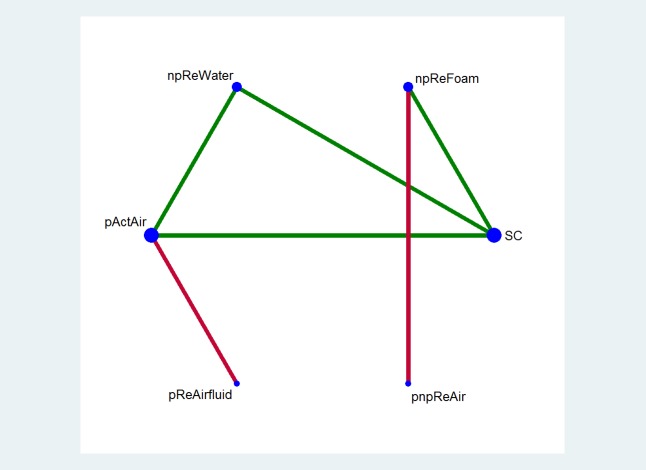
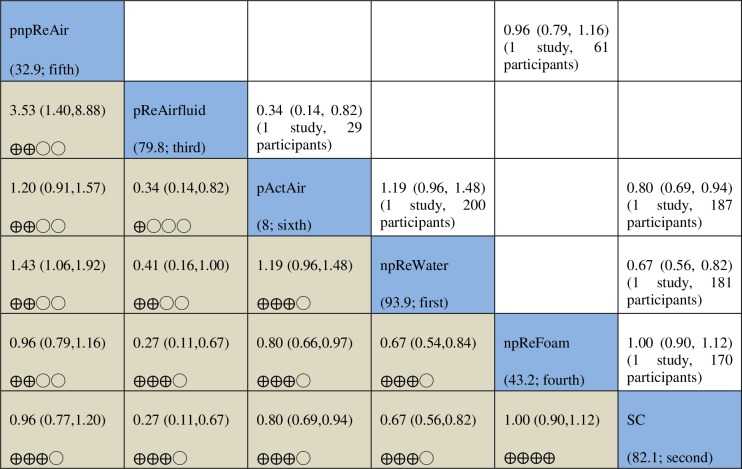
Main results: We included 65 studies in the review. The network for assessing pressure ulcer incidence comprised evidence of low or very low certainty for most network contrasts. There was moderate-certainty evidence that powered active air surfaces and powered hybrid air surfaces probably reduce pressure ulcer incidence compared with standard hospital surfaces (risk ratios (RR) 0.42, 95% confidence intervals (CI) 0.29 to 0.63; 0.22, 0.07 to 0.66, respectively). The network for comfort suggested that powered active air-surfaces are probably slightly less comfortable than standard hospital mattresses (RR 0.80, 95% CI 0.69 to 0.94; moderate-certainty evidence).

Conclusions: This is the first network meta-analysis of the effects of support surfaces for pressure ulcer prevention. Powered active air-surfaces probably reduce pressure ulcer incidence, but are probably less comfortable than standard hospital surfaces. Most prevention evidence was of low or very low certainty, and more research is required to reduce these uncertainties.


Conflict of interest statement

Competing Interests: The authors have declared that no competing interests exist.

Figures

Fig 1
Fig 1. Flow diagram of included studies.
Fig 2
Fig 2. Network plot for the incidence of pressure ulcers produced by STATA networkplot command.
Fourteen intervention groups are coded in the plot (i.e., nodes): SC = standard hospital surfaces, npReFibre = non-powered reactive fibre surfaces, npReFoam = non-powered reactive foam surfaces, npReGel = non-powered reactive gel surfaces, npReSheepskin = non-powered reactive sheepskin surfaces, npReWater = non-powered reactive water surfaces, pActAir = powered active air-cells surfaces, pActAirnpReFoam = powered active air-cells surfaces plus non-powered reactive foam surfaces, pActLAL = powered active low-air-loss air surfaces, pHybridAir = powered hybrid air-cells surfaces, pHybridLAL = powered hybrid low-air-loss air surfaces, pReAirfluid = powered reactive air-fluidised surfaces, pnpReAir = powered or non-powered reactive air-cells surfaces, and pnpReLAL = powered or non-powered reactive low-air-loss air surfaces. Each node size is proportional to the number of direct comparisons involving each intervention group. Taking any two of the six nodes forms 91 network contrasts. 24 lines between nodes represent direct comparisons driven by RCTs; and line thickness is proportional to the number of studies involved in each direct comparison. Direct evidence of two or more comparisons can generate indirect evidence for contrasts that did not involve a head-to-head RCT (e.g., indirect evidence for the comparison of npReFoam vs. npReWater generated from comparisons, for example, of npReFoam vs. SC and npReWater vs. SC). In this way, indirect evidence informs the remaining 67 of the 91 network contrasts. The risk of bias assessment was based on the most frequent level of bias recorded for studies included in that comparison and denoted using coloured lines (or links). A green link indicates no serious study limitations; yellow indicates serious limitations; and red indicates very serious limitations.
Fig 3
Fig 3. Results of pairwise meta-analyses via RevMan and network meta-analysis with consistency model via STATA for pressure ulcer incidence.
Results of pairwise meta-analyses with the numbers of included studies and participants are presented above the diagonal cells (see S7 File); network meta-analysis results and the corresponding certainty of evidence assessments are shown below the diagonal cells. The diagonal cells show the codes of intervention groups and their SUCRA values and rankings in brackets: SC = standard hospital surfaces, npReFibre = non-powered reactive fibre surfaces, npReFoam = non-powered reactive foam surfaces, npReGel = non-powered reactive gel surfaces, npReSheepskin = non-powered reactive sheepskin surfaces, npReWater = non-powered reactive water surfaces, pActAir = powered active air-cells surfaces, pActAirnpReFoam = powered active air-cells surfaces plus non-powered reactive foam surfaces, pActLAL = powered active low-air-loss air surfaces, pHybridAir = powered hybrid air-cells surfaces, pHybridLAL = powered hybrid low-air-loss air surfaces, pReAirfluid = powered reactive air-fluidised surfaces, pnpReAir = powered or non-powered reactive air-cells surfaces, and pnpReLAL = powered or non-powered reactive low-air-loss air surfaces. ⨁⨁⨁◯ = Moderate certainty of evidence; ⨁⨁◯◯ = Low certainty of evidence; and ⨁◯◯◯ = Very low certainty of evidence.
Fig 4
Fig 4. Network plot for the patient comfort on a support surface produced by STATA networkplot command.
Six intervention groups (i.e., six nodes) are coded in the plot: SC = standard hospital surfaces, npReFoam = non-powered reactive foam surfaces, npReWater = non-powered reactive water surfaces, pActAir = powered active air-cells surfaces, pReAirfluid = powered reactive air-fluidised surfaces, pnpReAir = powered or non-powered reactive air-cells surfaces. Taking any two of the six nodes forms 15 network contrasts. The size of each node is proportional to the number of direct comparisons involving each intervention group. The six lines between nodes in the plot represent the only direct comparisons and line thickness is proportional to the number of studies involved in each direct comparison. The direct evidence arising from two or more comparisons can generate indirect evidence for contrasts that have not been compared in head-to-head RCTs (e.g., indirect evidence for the comparison of npReFoam vs. npReWater generated from comparisons of npReFoam vs. SC and npReWater vs. SC). In this way, indirect evidence informs nine of the 15 network contrasts. The risk of bias assessment was based on the most frequent level of bias recorded for studies included in that comparison and denoted using coloured lines (or links). A green link indicates no serious study limitation, yellow indicates serious limitations; and red very serious limitations.
Fig 5
Fig 5. Results of pairwise meta-analyses and network meta-analysis with consistency model for the comfort of a support surface.
Results of pairwise meta-analyses with the numbers of included studies and participants are presented above the diagonal cells; network meta-analysis results and the corresponding certainty of evidence assessments are shown below the diagonal cells. The diagonal cells show the codes of intervention groups and their SUCRA values and rankings in brackets: SC = standard hospital surfaces, npReFoam = non-powered reactive foam surfaces, npReWater = non-powered reactive water surfaces, pActAir = powered active air-cells surfaces, pReAirfluid = powered reactive air-fluidised surfaces, pnpReAir = powered or non-powered reactive air-cells surfaces. ⨁⨁⨁⨁ = High certainty of evidence; ⨁⨁⨁◯ = moderate certainty of evidence; ⨁⨁◯◯ = low certainty of evidence; and ⨁◯◯◯ = very low certainty of evidence.

References

    1. National Pressure Ulcer Advisory Panel, European Pressure Ulcer Advisory Panel and Pan Pacific Pressure Injury Alliance (NPUAP/EPUAP/PPPIA). Prevention and Treatment of Pressure Ulcers: Quick Reference Guide. Haesler Emily (Ed.). Cambridge Media: Osborne Park, Western Australia; 2014.
    1. Cullum N, Buckley H, Dumville J, Hall J, Lamb K, Madden M, et al. Wounds research for patient benefit: a 5-year programme of research, Programme Grants for Applied Research. NIHR Journals Library, Southampton (UK); 2016. - PubMed
    1. Bennett G, Dealey C, Posnett J. The cost of pressure ulcers in the UK. Age Ageing 2004; 33: 230–235. doi: 10.1093/ageing/afh086 - DOI - PubMed
    1. National Pressure Ulcer Advisory Panel (NPUAP). Support Surface Standards (S3I) Terms and Definitions Related to Support Surfaces. Available at http://www.npuap.org/wp-content/uploads/2012/03/NPUAP_S3I_TD.pdf Access in 15 Dec. 15.
    1. Clark M. Technology update: understanding support surface. Wounds International 2011; 2(3):17–21.

Publication types