

Molecular adaptations to phosphorus deprivation and comparison with nitrogen deprivation responses in the diatom Phaeodactylum tricornutum
- PMID: 29474408
- PMCID: PMC5825098
- DOI: 10.1371/journal.pone.0193335
Molecular adaptations to phosphorus deprivation and comparison with nitrogen deprivation responses in the diatom Phaeodactylum tricornutum
Abstract
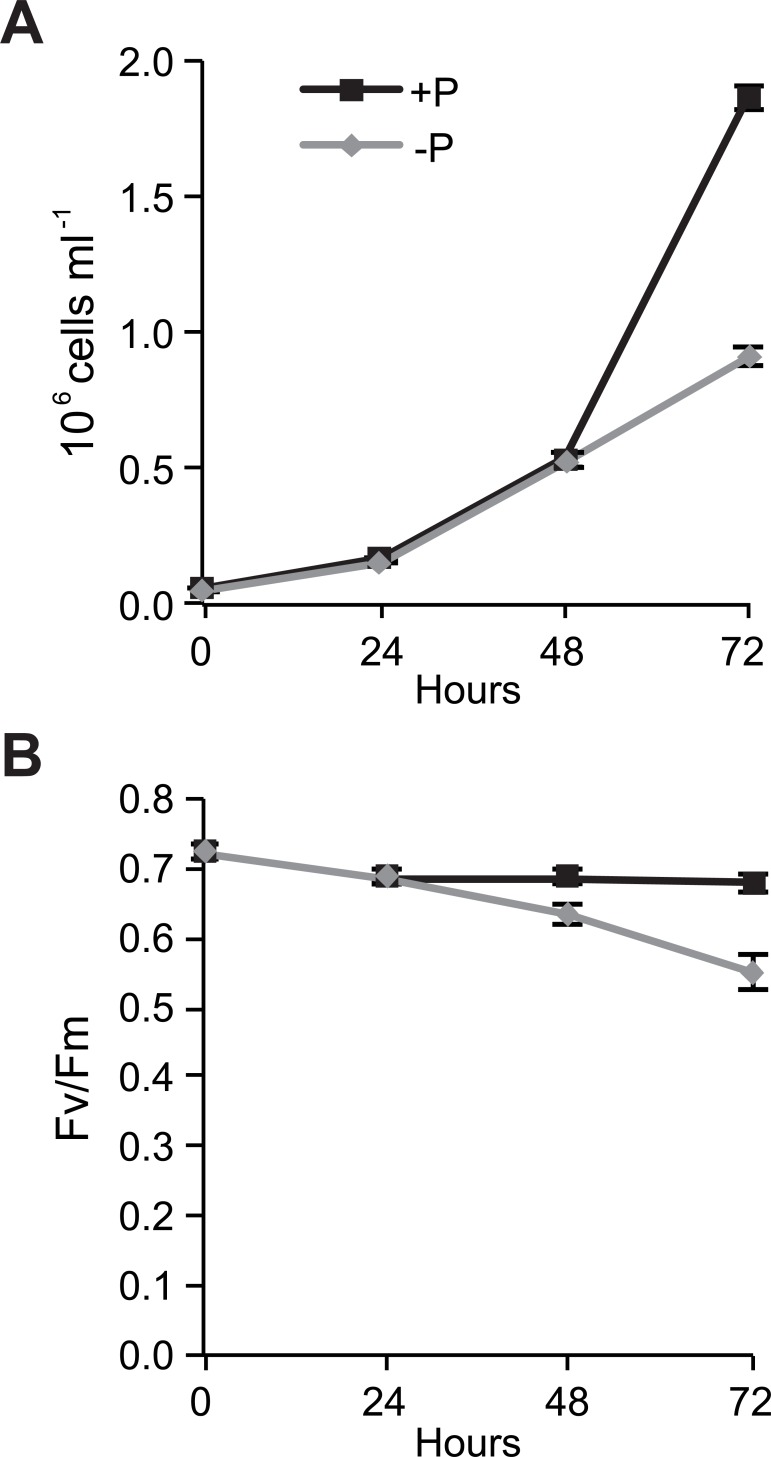
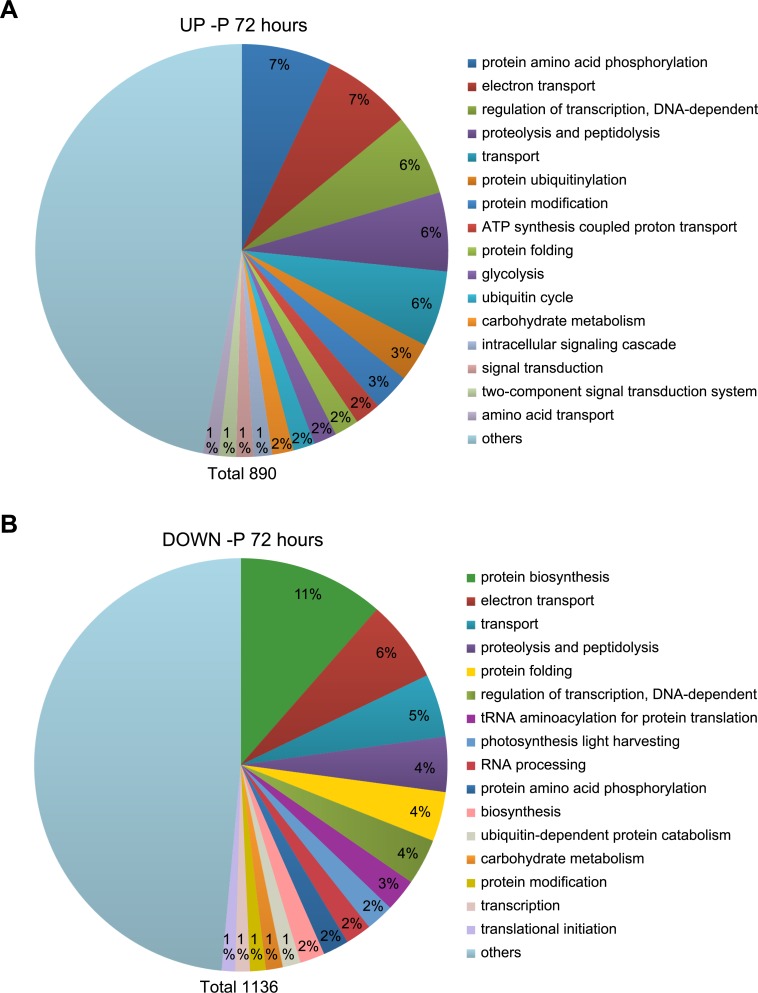
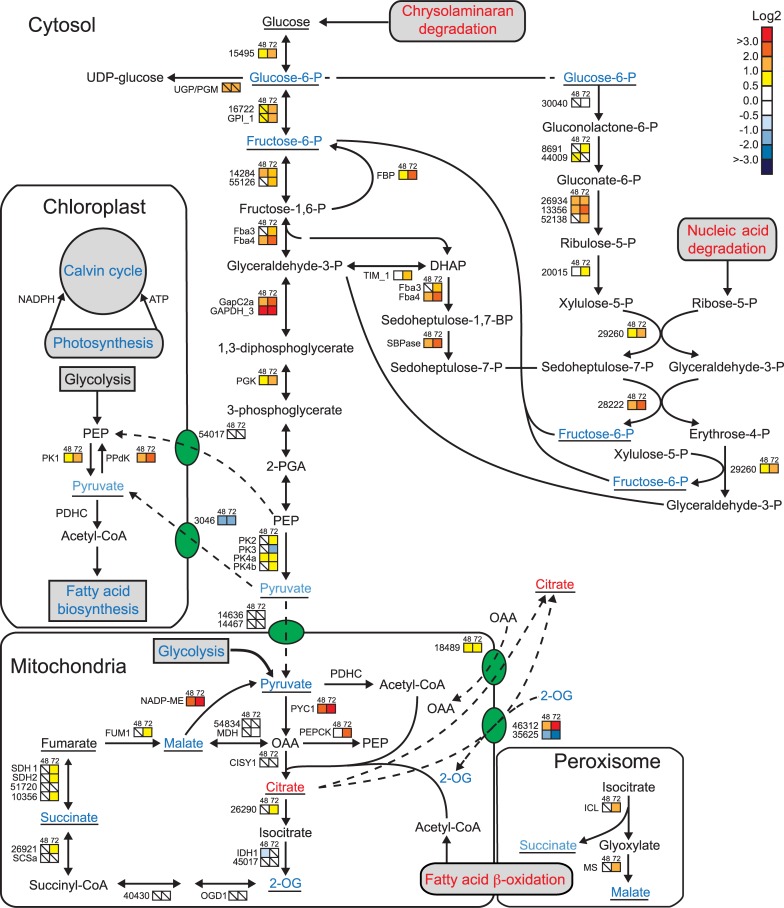
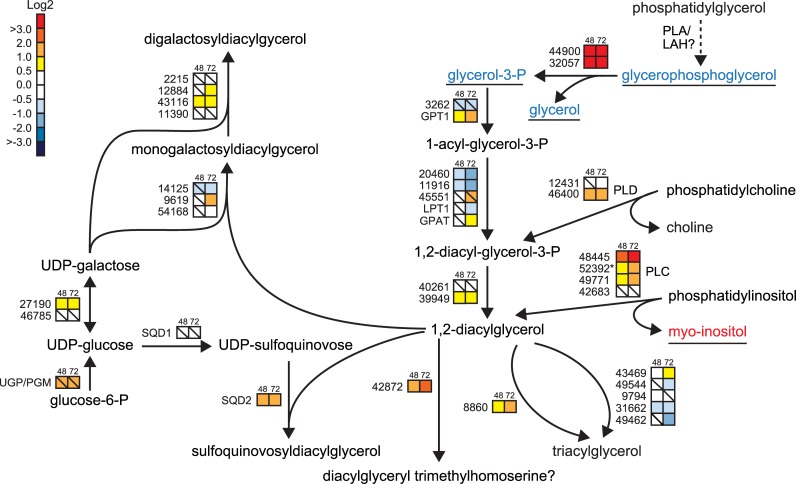
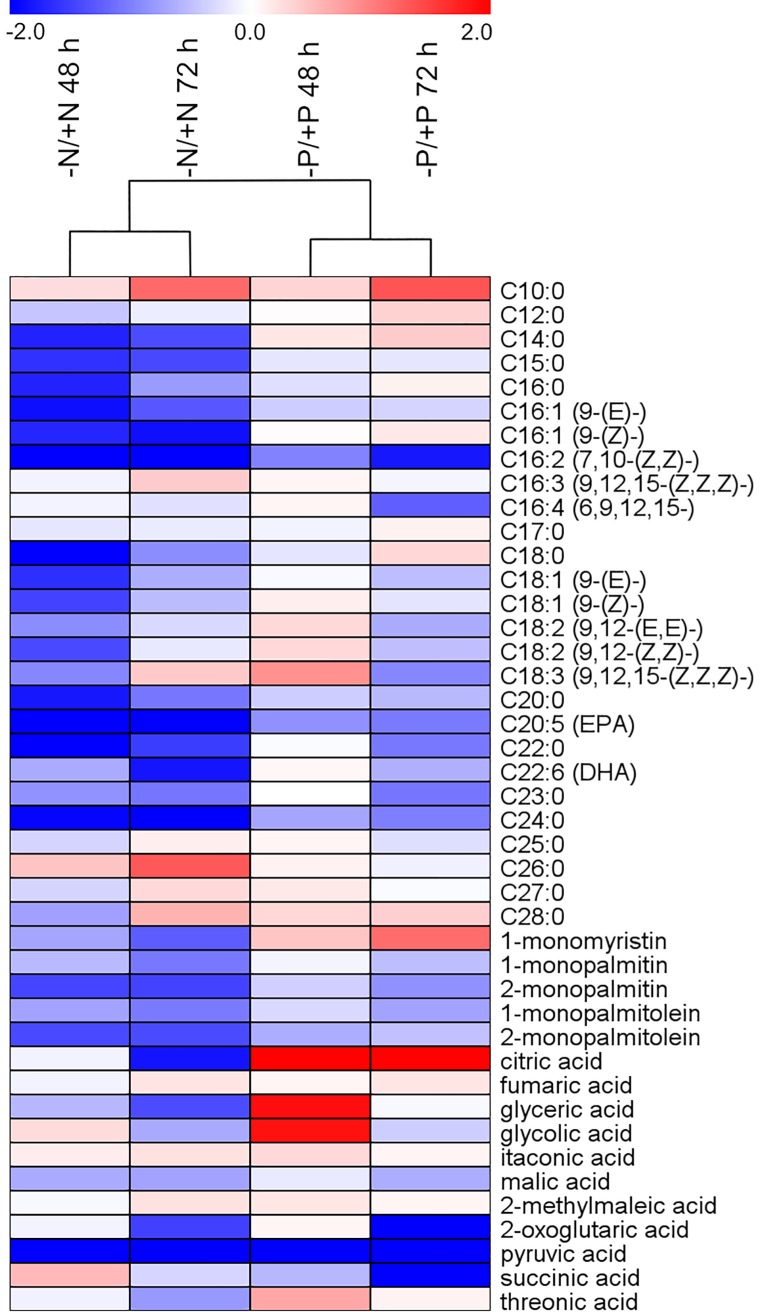
Phosphorus, an essential element for all living organisms, is a limiting nutrient in many regions of the ocean due to its fast recycling. Changes in phosphate (Pi) availability in aquatic systems affect diatom growth and productivity. We investigated the early adaptive mechanisms in the marine diatom Phaeodactylum tricornutum to P deprivation using a combination of transcriptomics, metabolomics, physiological and biochemical experiments. Our analysis revealed strong induction of gene expression for proteins involved in phosphate acquisition and scavenging, and down-regulation of processes such as photosynthesis, nitrogen assimilation and nucleic acid and ribosome biosynthesis. P deprivation resulted in alterations of carbon allocation through the induction of the pentose phosphate pathway and cytosolic gluconeogenesis, along with repression of the Calvin cycle. Reorganization of cellular lipids was indicated by coordinated induced expression of phospholipases, sulfolipid biosynthesis enzymes and a putative betaine lipid biosynthesis enzyme. A comparative analysis of nitrogen- and phosphorus-deprived P. tricornutum revealed both common and distinct regulation patterns in response to phosphate and nitrate stress. Regulation of central carbon metabolism and amino acid metabolism was similar, whereas unique responses were found in nitrogen assimilation and phosphorus scavenging in nitrogen-deprived and phosphorus-deprived cells, respectively.
Conflict of interest statement
Figures
Similar articles
-
Whole-cell response to nitrogen deprivation in the diatom Phaeodactylum tricornutum.J Exp Bot. 2015 Oct;66(20):6281-96. doi: 10.1093/jxb/erv340. Epub 2015 Jul 10. J Exp Bot. 2015. PMID: 26163699 Free PMC article.
-
Membrane glycerolipid remodeling triggered by nitrogen and phosphorus starvation in Phaeodactylum tricornutum.Plant Physiol. 2015 Jan;167(1):118-36. doi: 10.1104/pp.114.252395. Epub 2014 Dec 8. Plant Physiol. 2015. PMID: 25489020 Free PMC article.
-
Examination of metabolic responses to phosphorus limitation via proteomic analyses in the marine diatom Phaeodactylum tricornutum.Sci Rep. 2015 May 28;5:10373. doi: 10.1038/srep10373. Sci Rep. 2015. PMID: 26020491 Free PMC article.
-
The effects of phosphorus limitation on carbon metabolism in diatoms.Philos Trans R Soc Lond B Biol Sci. 2017 Sep 5;372(1728):20160406. doi: 10.1098/rstb.2016.0406. Philos Trans R Soc Lond B Biol Sci. 2017. PMID: 28717016 Free PMC article. Review.
-
Specific acclimations to phosphorus limitation in the marine diatom Phaeodactylum tricornutum.Biol Chem. 2020 Nov 26;401(12):1495-1501. doi: 10.1515/hsz-2020-0197. Biol Chem. 2020. PMID: 32845857 Review.
Cited by
-
Overexpression of a novel gene (Pt2015) endows the commercial diatom Phaeodactylum tricornutum high lipid content and grazing resistance.Biotechnol Biofuels Bioprod. 2022 Nov 26;15(1):131. doi: 10.1186/s13068-022-02221-y. Biotechnol Biofuels Bioprod. 2022. PMID: 36435813 Free PMC article.
-
Optimized Fast Filtration-Based Sampling and Extraction Enables Precise and Absolute Quantification of the Escherichia coli Central Carbon Metabolome.Metabolites. 2023 Jan 18;13(2):150. doi: 10.3390/metabo13020150. Metabolites. 2023. PMID: 36837769 Free PMC article.
-
Optimizing Phaeodactylum tricornutum cultivation: integrated strategies for enhancing biomass, lipid, and fucoxanthin production.Biotechnol Biofuels Bioprod. 2025 Jan 18;18(1):7. doi: 10.1186/s13068-024-02602-5. Biotechnol Biofuels Bioprod. 2025. PMID: 39827342 Free PMC article.
-
The microbial phosphorus cycle in aquatic ecosystems.Nat Rev Microbiol. 2025 Apr;23(4):239-255. doi: 10.1038/s41579-024-01119-w. Epub 2024 Nov 11. Nat Rev Microbiol. 2025. PMID: 39528792 Review.
-
Nitrogen status exerts dynamic control over phosphorus sensing and acquisition via PSR1 in colimited marine diatoms.Sci Adv. 2025 Aug 29;11(35):eadw8260. doi: 10.1126/sciadv.adw8260. Epub 2025 Aug 29. Sci Adv. 2025. PMID: 40880470 Free PMC article.
References
-
- Falkowski PG, Barber RT, Smetacek V. Biogeochemical controls and feedbacks on ocean primary production. Science. 1998;281:200–206. doi: 10.1126/science.281.5374.200 - DOI - PubMed
-
- Bowler C, Vardi A, Allen AE. Oceanographic and biogeochemical insights from diatom genomes. Ann Rev Mar Sci. 2010;2:333–365. doi: 10.1146/annurev-marine-120308-081051 - DOI - PubMed
-
- Litchman E, Klausmeier CA, Miller JR, Schofield OM, Falkowski PG. Multi-nutrient, multi-group model of present and future oceanic phytoplankton communities. Biogeosciences. 2006;3:585–606.
-
- Paytan A, McLaughlin K. The oceanic phosphorus cycle. Chem Rev. 2007;107:563–576. doi: 10.1021/cr0503613 - DOI - PubMed
-
- Dyhrman ST, Ammerman JW, Van Mooy BAS. Microbes and the marine phosphorus cycle. Oceanography. 2007;20:110–116.
Publication types
MeSH terms
Substances
LinkOut - more resources
Full Text Sources
Other Literature Sources
Molecular Biology Databases
Research Materials
Miscellaneous
