. 2018 Feb 23;13(2):e0193470.
doi: 10.1371/journal.pone.0193470. eCollection 2018.

Fat max as an index of aerobic exercise performance in mice during uphill running

Affiliations

Fat max as an index of aerobic exercise performance in mice during uphill running

Kengo Ishihara et al. PLoS One. .

Abstract

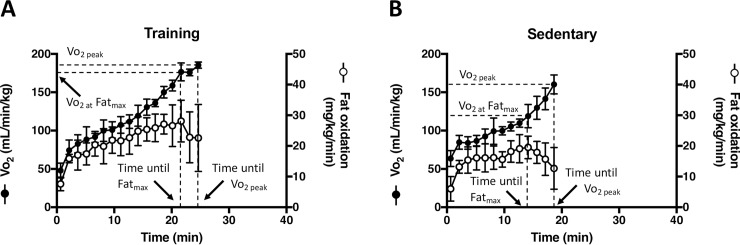
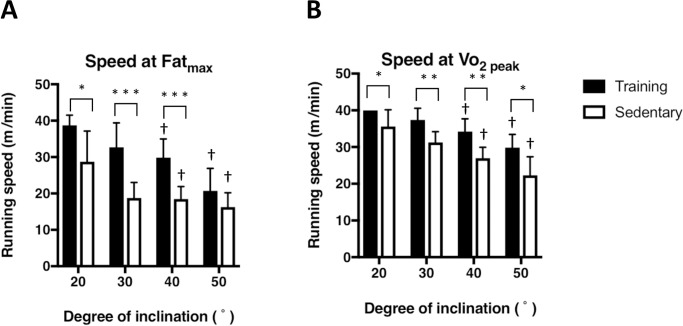
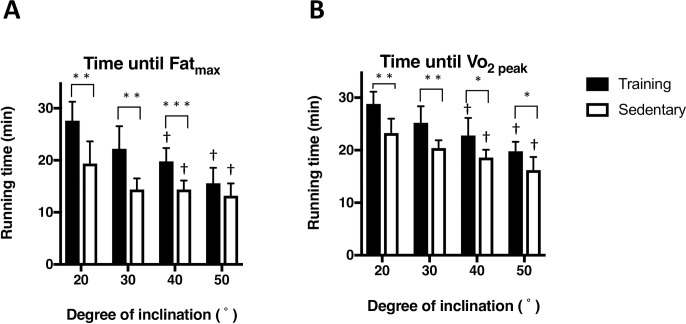
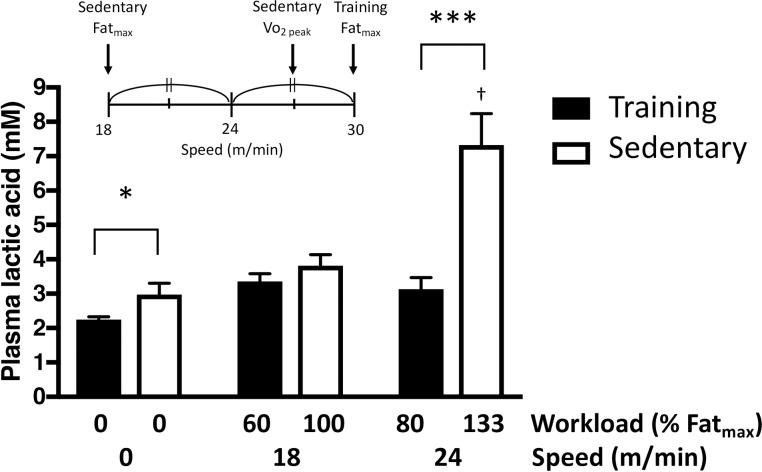
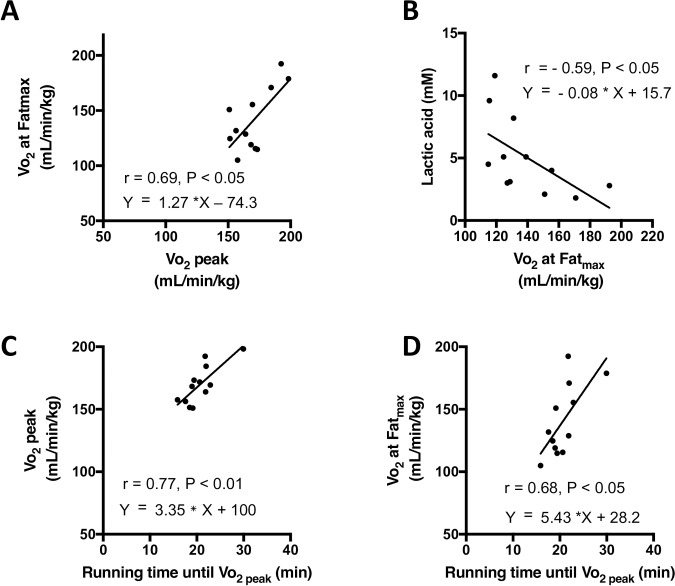
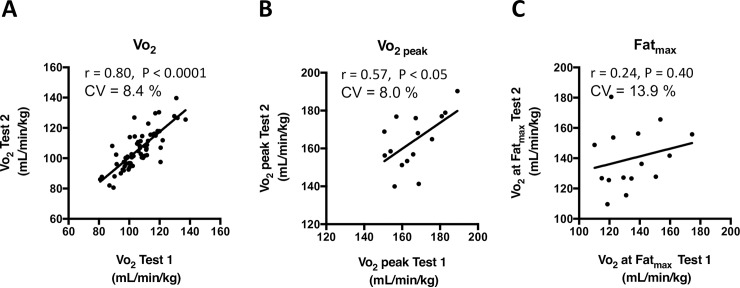
Endurance exercise performance has been used as a representative index in experimental animal models in the field of health sciences, exercise physiology, comparative physiology, food function or nutritional physiology. The objective of the present study was to evaluate the effectiveness of Fatmax (the exercise intensity that elicits maximal fat oxidation) as an additional index of endurance exercise performance that can be measured during running at submaximal exercise intensity in mice. We measured both Fatmax and Vo2 peak of trained ICR mice that voluntary exercised for 8 weeks and compared them with a sedentary group of mice at multiple inclinations of 20, 30, 40, and 50° on a treadmill. The Vo2 at Fatmax of the training group was significantly higher than that of the sedentary group at inclinations of 30 and 40° (P < 0.001). The running speed at Fatmax of the training group was significantly higher than that of the sedentary group at inclinations of 20, 30, and 40° (P < 0.05). Blood lactate levels sharply increased in the sedentary group (7.33 ± 2.58 mM) compared to the training group (3.13 ± 1.00 mM, P < 0.01) when running speeds exceeded the Fatmax of sedentary mice. Vo2 at Fatmax significantly correlated to Vo2 peak, running time to fatigue, and lactic acid level during running (P < 0.05) although the reproducibility of Vo2 peak was higher than that of Vo2 at Fatmax. In conclusion, Fatmax can be used as a functional assessment of the endurance exercise performance of mice during submaximal exercise intensity.


Conflict of interest statement

Competing Interests: The authors have declared that no competing interests exist.

Figures

Fig 1
Fig 1
Representative changes in Vo2 and fat oxidation while running and at inclinations of 40° of training (A) and sedentary (B) mice (n = 6). Vo2 peak is the maximum Vo2 observed while running. Fatmax is the exercise intensity that elicits maximum fat oxidation. Vo2 at Fatmax is the observed Vo2 at the exercise intensity of Fatmax. The treadmill velocity was as follows: 0–5 min, 5 m/min; 5–10 min, 10 m/min; and then increased by 1 m/min every 30 seconds. Each running experiment at different inclinations was conducted at intervals of one day or more. Values are means ± SD (n = 6).
Fig 2
Fig 2
Vo2 at increasing running speed while running at inclinations of 20 (A), 30 (B), 40 (C), and 50° (D) in training and sedentary mice (n = 6). The trained mice were housed in cages with a running saucer for 8 weeks. The running protocol was described in Fig 1. Individual data are shown (n = 6).
Fig 3
Fig 3
Comparison between Vo2 at the exercise intensity that elicits maximum fat oxidation (Fatmax, A), Vo2 (B), and Vo2 normalized to the body mass raised to the power of 0.75 (C). The running protocol was described in Fig 1. Values are mean ± SD (n = 6). *** P<0.001 between training and sedentary groups.
Fig 4
Fig 4
Comparison between running speed at the exercise intensity that elicits maximum fat oxidation (Fatmax, A) and running speed at Vo2 peak (B). The running protocol was described in Fig 1. Values are mean ± SD (n = 6). *P < 0.05 compared as 0° of inclination. * P< 0.05, ** P<0.01, and *** P<0.001 between training and sedentary groups. † P < 0.05 compared to the corresponding value at 20°.
Fig 5
Fig 5
Comparison between running time until the exercise intensity that elicits maximum fat oxidation (Fat max, A) and running time until Vo2 peak (B). The running protocol was described in Fig 1. Values are mean ± SD (n = 6). *P < 0.05, ** P<0.01, and *** P<0.001 between training and sedentary groups. † P < 0.05 compared to the corresponding value at 20°.
Fig 6
Fig 6. Blood lactate concentration during submaximal running.
The running protocol was described in Fig 1. Running speed of 18 m/min corresponded to the Fatmax of sedentary group and running speed of 24 m/min corresponded to the half speed of Fatmax of sedentary and training group. Values are mean ± SD (n = 6). †P < 0.05 compared to the corresponding resting value. *P< 0.05, and ***P<0.001 between training and sedentary groups.
Fig 7
Fig 7. Correlations among Vo2 at Fatmax, Vo2 peak, running time until fatigue, and plasma lactic acid concentration during running at an inclination of 40°.
The running protocol was described in Fig 1. Linear correlations were analyzed between Vo2 peak and Vo2 at Fatmax (A), between Vo2 at Fatmax and plasma lactic acid concentration (B), between Vo2 peak and running time until Vo2 peak (C), and between Vo2 at Fatmax and running time until fatigue (D). Plasma lactic acid concentration was measured during running at a speed of 24 m/min at the inclination of 40° as described in Fig 6. The running protocol was described in Fig 1. Individual data are shown (n = 12).
Fig 8
Fig 8. Reproducibility of Vo2 during submaximal running, Vo2 peak, and Vo2 at Fatmax during running at an inclination of 40°.
Each mouse ran two times at intervals of one day. The running protocol is described in Fig 1. Linear correlations were analyzed between two tests. CV, coefficient of variation. Individual data are shown (n = 15).

Similar articles

Cited by

References

    1. Astrand PO. Quantification of exercise capability and evaluation of physical capacity in man. Prog Cardiovasc Dis. 1976;19: 51–67. - PubMed
    1. Lechner AJ. The scaling of maximal oxygen consumption and pulmonary dimensions in small mammals. Respir Physiol. 1978;34:29–44. - PubMed
    1. Ayachi M, Niel R, Momken I, Billat VL, Mille-Hamard L. Validation of a ramp running protocol for determination of the true VO2max in mice. Front Physiol. 2016;7: 372 doi: 10.3389/fphys.2016.00372 - DOI - PMC - PubMed
    1. Kemi OJ, Loennechen JP, Wisloff U, Ellingsen O. Intensity-controlled treadmill running in mice: cardiac and skeletal muscle hypertrophy. J Appl Physiol (1985). 2002;93: 1301–1309. - PubMed
    1. Petrosino JM, Heiss VJ, Maurya SK, Kalyanasundaram A, Periasamy M, LaFountain RA, et al. Graded maximal exercise testing to assess mouse cardio-metabolic phenotypes. PLoS One. 2016;11: e0148010 doi: 10.1371/journal.pone.0148010 - DOI - PMC - PubMed

Publication types

LinkOut - more resources