. 2018 Feb 23;13(2):e0193490.
doi: 10.1371/journal.pone.0193490. eCollection 2018.

Contribution of S4 segments and S4-S5 linkers to the low-voltage activation properties of T-type CaV3.3 channels

Affiliations

Contribution of S4 segments and S4-S5 linkers to the low-voltage activation properties of T-type CaV3.3 channels

Ana Laura Sanchez-Sandoval et al. PLoS One. .

Abstract

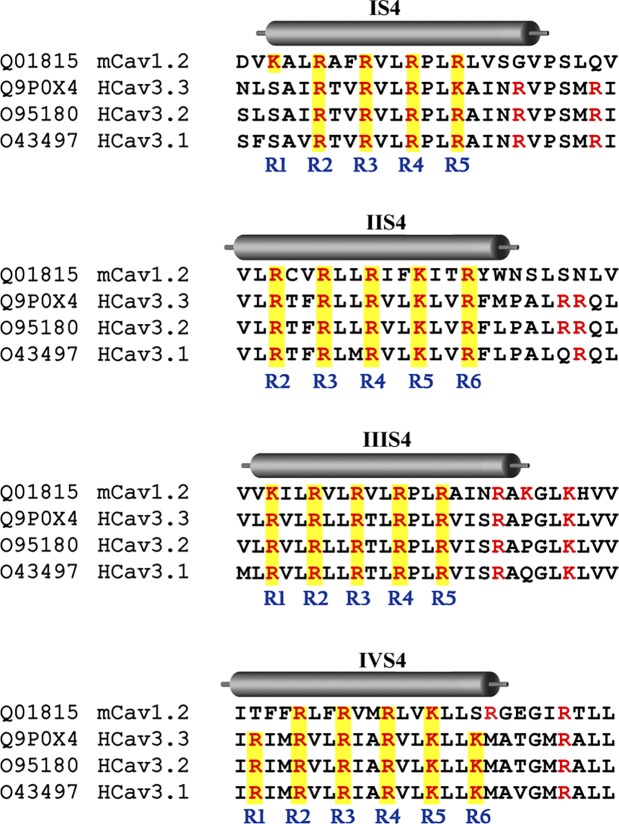
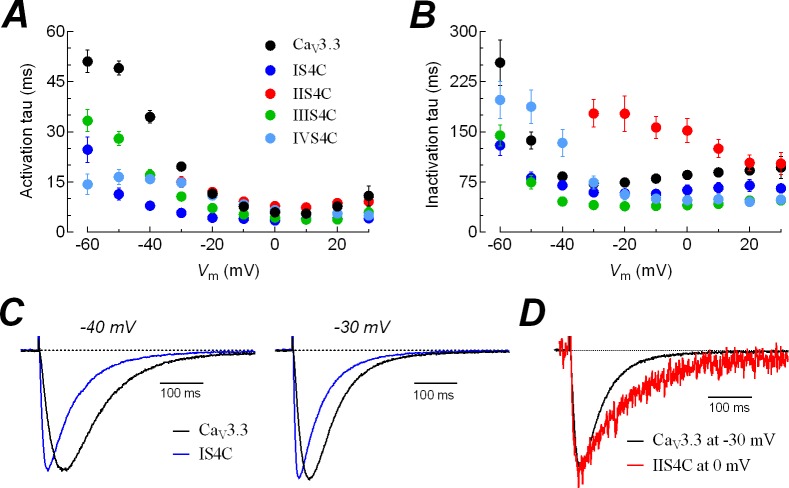
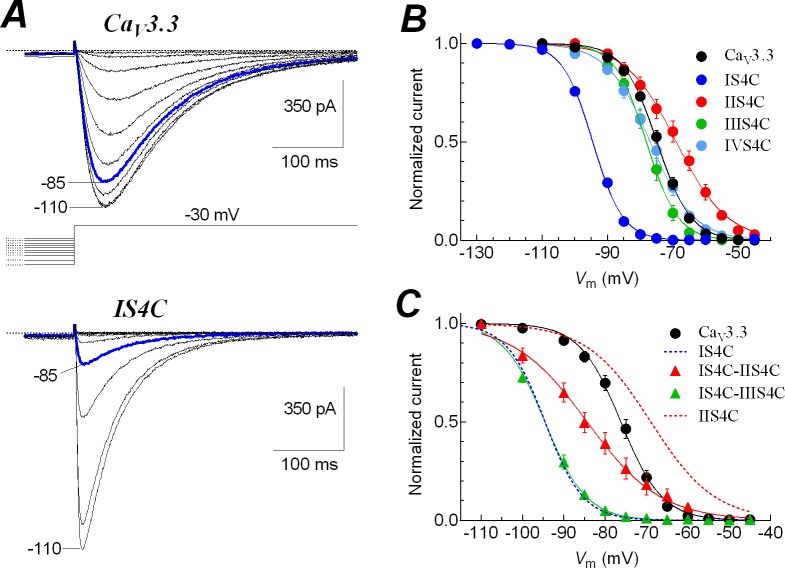
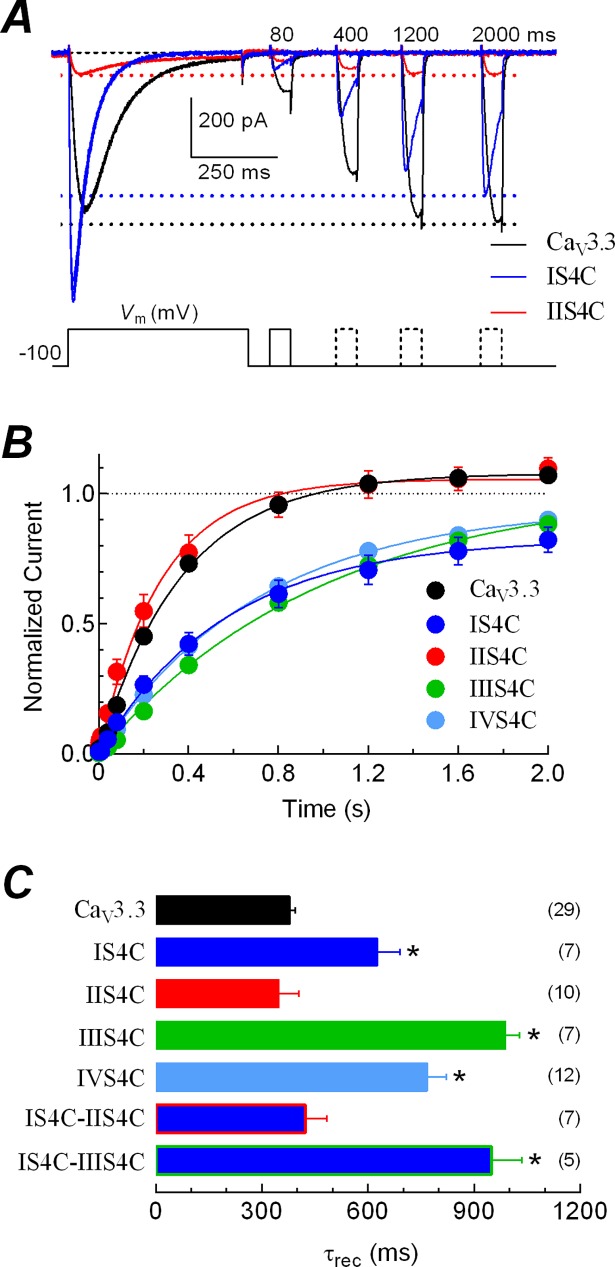
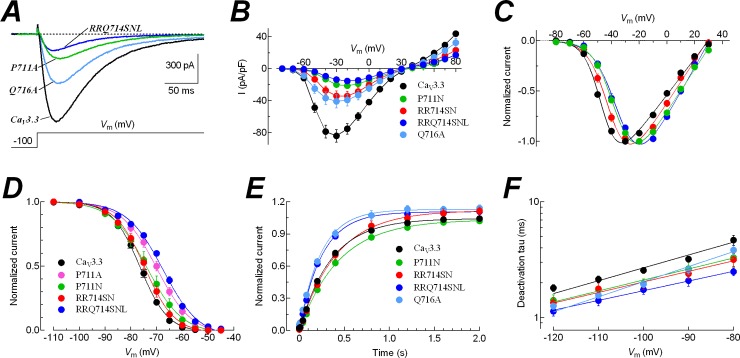
Voltage-gated calcium channels contain four highly conserved transmembrane helices known as S4 segments that exhibit a positively charged residue every third position, and play the role of voltage sensing. Nonetheless, the activation range between high-voltage (HVA) and low-voltage (LVA) activated calcium channels is around 30-40 mV apart, despite the high level of amino acid similarity within their S4 segments. To investigate the contribution of S4 voltage sensors for the low-voltage activation characteristics of CaV3.3 channels we constructed chimeras by swapping S4 segments between this LVA channel and the HVA CaV1.2 channel. The substitution of S4 segment of Domain II in CaV3.3 by that of CaV1.2 (chimera IIS4C) induced a ~35 mV shift in the voltage-dependence of activation towards positive potentials, showing an I-V curve that almost overlaps with that of CaV1.2 channel. This HVA behavior induced by IIS4C chimera was accompanied by a 2-fold decrease in the voltage-dependence of channel gating. The IVS4 segment had also a strong effect in the voltage sensing of activation, while substitution of segments IS4 and IIIS4 moved the activation curve of CaV3.3 to more negative potentials. Swapping of IIS4 voltage sensor influenced additional properties of this channel such as steady-state inactivation, current decay, and deactivation. Notably, Domain I voltage sensor played a major role in preventing CaV3.3 channels to inactivate from closed states at extreme hyperpolarized potentials. Finally, site-directed mutagenesis in the CaV3.3 channel revealed a partial contribution of the S4-S5 linker of Domain II to LVA behavior, with synergic effects observed in double and triple mutations. These findings indicate that IIS4 and, to a lesser degree IVS4, voltage sensors are crucial in determining the LVA properties of CaV3.3 channels, although the accomplishment of this function involves the participation of other structural elements like S4-S5 linkers.


Conflict of interest statement

Competing Interests: The authors have declared that no competing interests exist.

Figures

Fig 1
Fig 1. Sequence of the S4 segments of CaV1.2 and CaV3.3 α1 subunits.
Amino acid sequence alignment of the S4 segments that were swapped between CaV1.2 and CaV3.3 channels. Positively charged residues (K, lysines and R, arginines) are colored in red, and those shaded yellow (labelled R1-R6) are the equivalent residues that are involved in the gating of Shaker K+ channel [27]. The cylinders depicting S4 segments are restricted to the structural data reported recently by Wu et al. [42]. According to this new data, all four swapped segments in our chimeras included some residues corresponding to the S4-S5 linkers (right of cylinders indicating S4 segments). The S4 segments of mouse CaV1.2 (Uniprot ID: Q01815) are identical to the human CaV1.2 (Uniprot ID: Q13936), therefore in the alignments only the mouse sequence used here is shown. The S4 segments of CaV3.1 (Uniprot ID: O43497) and CaV3.2 (Uniprot ID: O95180) human channels are also shown for appreciation of differences within CaV3 subfamily members. Sequence alignments were performed with ClustalW using DNAsis MAX 3.0 (Hitachi Solutions, San Bruno, CA).
Fig 2
Fig 2. Contribution of S4 segments to the low-voltage activation of CaV3.3 channels.
A, representative calcium currents of CaV3.3, IS4C, IIS4C, IIIS4C, IVS4C, and CaV1.2 channels at the indicated voltages. Holding potential was -100 mV, except for recordings of IS4C, where it was -120 mV. Charge carrier was always 5 mM Ca2+. The voltage of maximal inward current for each channel is indicated by arrows. Note the very tiny inward currents generated by IIS4C chimera, compared with those of CaV3.3 channel. B, current-voltage (I-V) relationships. Peak current amplitudes were normalized to the Cm value of each cell, averaged, and plotted as a function of test potential. Note that current densities were very small for IIS4C, IVS4C, and CaV1.2 channels. C, normalized I-V curves. For clarity purposes only inward currents are plotted. Solid lines are the best fits to the data with a modified Boltzmann function (see Material and Methods). Same cells as shown in B. Data in graphs represent mean ± SEM. Parameter values, number of cells and statistical significance are shown in Table 1.
Fig 3
Fig 3. Time course of activation and inactivation of the current from CaV3.3 channels and the chimeras.
Time constants (tau) of activation (A) and inactivation (B) for CaV3.3 and the indicated chimeric channels. Currents like those illustrated in Fig 2A, were fitted with two exponentials, one for the activation and the other for the inactivation of the current; and the respective constants were plotted as a function of membrane potential. Due to the small amplitude and the 30 mV shift in the I-V curve of IIS4C chimera (Fig 2A and 2B), data of fitted currents is only shown for the range of -30 to +30 mV. Data points in graphs represent mean ± SEM; same cells as in Fig 2B. C, representative current traces showing the much faster activation kinetics for the IS4C chimeric channel than CaV3.3 channels at -40 and -30 mV. Peak currents of CaV3.3 were normalized to those of IS4C channel (x1.49 and x1.29, respectively). D, inactivation kinetics of IIS4C channel are slower than the CaV3.3-WT channel. Calcium currents recorded at -30 mV for CaV3.3 and at 0 mV for IIS4C channels. Chimeric IIS4C peak current was scaled up to that of CaV3.3 channel by a 21.7 factor.
Fig 4
Fig 4. Contribution of S4 segments to the steady-state inactivation of low-voltage activated CaV3.3 channels.
A, families of currents recorded at -30 mV from CaV3.3 (upper traces) or IS4C chimeric (bottom traces) channels. Current recordings were obtained after 15-s prepulses to potentials between -110 and -45 mV, as shown by the voltage protocol. For a better appreciation only the last 70 ms of the prepulses are shown. Blue traces show the difference in voltage channels availability after the prepulse to -85 mV in both channels. B, steady-state inactivation curves for WT and chimeric CaV3.3 channels. Currents at -30 mV like those shown in A (or at 0 mV for IIS4C) were normalized to the value at -110 (-130 for IS4C) mV, averaged and plotted as a function of the prepulse potential for each channel. Smooth lines are fits to Boltzmann functions. C, steady-state inactivation curves for CaV3.3 and its double-chimeras IS4C-IIS4C and IS4C-IIIS4C. Currents at -30 mV like those shown in A (or at 0 mV for IS4C-IIS4C) were normalized to the value at -110 mV, averaged and plotted as a function of the prepulse potential for each channel. Smooth lines are fits to Boltzmann functions. Data in graphs represent mean ± SEM. Parameter values, number of cells and statistical significance are shown in Table 2.
Fig 5
Fig 5. Consequences on the recovery from inactivation of CaV3 channels due to the substitution of S4 segments.
A, representative recordings of Ca2+ currents illustrating the recovery from inactivation of CaV3.3, IS4C and IIS4C channels. As shown by the two-pulse protocol at the bottom, calcium currents were inactivated by a 500 ms pulse to -30 mV (-10 for IS4C), then the membrane potential was stepped to -100 mV for periods ranging from 1 to 2000 ms before applying a 60 ms activating voltage step to -30 mV (-10 for IS4C). Shown are traces corresponding to 0.08, 0.4, 1.2 and 2 s between the turn off of the inactivating pulse and the turn on of the test pulse. Tail currents generated by the membrane repolarization to -100 mV were cut out to emphasize the amplitude of the currents. Dashed lines indicate the maximum current amplitude recovered after 2 s at -100 mV for each channel. B, time course of recovery from inactivation at -100 mV for the indicated CaV3.3 channels. Data are the peak current (mean ± SEM) during the 60-ms pulse, normalized to the peak current recorded during the 500-ms pulse. Smooth curves are fits to the data using a one phase exponential association equation. C, time constants of recovery from inactivation (τrec). Columns are means, and bars the standard error. Number of investigated cells are given in parenthesis. *Statistical significance with one-way analysis of variance followed by Dunnett’s multiple comparison test against CaV3.3. Note that the fraction of IS4C chimeric channels recovered after 2 s was incomplete and slower than CaV3.3 channels. On the contrary, IIS4C channels recovered faster and at the same level of wild-type channels.
Fig 6
Fig 6. Effect of S4 segments in the slow-deactivating behavior of CaV3.3 channels.
A, representative tail currents for CaV3.3, IIS4C, IIIS4C and CaV1.2 channels. Ten-ms depolarization pulses to +60 mV were used to activate channels, and deactivation was recorded during subsequent repolarization to -100 mV, as indicated. Tail current amplitudes were scaled to CaV3.3 tail amplitude. For clarity, the voltage protocol and current recordings show only 1.5 out of 10 ms of the depolarization to +60 mV, and 10 out of 30 ms of the repolarization. B, time constants of channel deactivation for the indicated channels as a function of the repolarizing potential. Time constants were estimated by fitting tail currents to a single exponential function. Data in graphs represent mean ± SEM. For clarity purposes, size of IIS4C and IIIS4C data points have been reduced to show the similarity with those of IVS4C and WT channels, respectively. For example, time constant values at -90 mV were: 3.33 ± 0.15 ms for CaV3.3 (n = 25); 1.86 ± 0.35 ms for IS4C (n = 7); 0.81 ± 0.03 ms for IIS4C (n = 16); 3.22 ± 0.32 ms for IIIS4C (n = 6); 0.80 ± 0.06 ms for IVS4C (n = 12); and 0.19 ± 0.03 ms for CaV1.2-WT (n = 7). Smooth lines are single exponential fits to the averaged tau values. Inset: Time constants of channel deactivation for the double chimeras and CaV3.3 channels. The IS4 segment is not relevant for the slow closing of CaV3.3 channel, as double chimeras with IIS4C or IIIS4C follows the individual behavior of these two: fast closing with first and slow closing with the second one. The number of studied cells was 7 for each channel.
Fig 7
Fig 7. The complementary chimera IIS4I shifts the gating of CaV1.2 channels towards low-voltage behavior.
A, normalized I-V curves for CaV3.3, IIS4I, and CaV1.2 channels. For clarity purposes only inward currents are plotted. Solid lines are the best fits to the data with a modified Boltzmann function (see Material and Methods). Data in graphs represent mean ± SEM. Parameter values, number of cells and statistical significance are shown in Table 1. B, representative currents recorded at 0 mV from CaV1.2 (black traces) or IIS4I chimeric (red traces) channels. Current recordings were obtained after 15-s prepulses to potentials between -100 and -50 mV, as shown by the voltage protocol. For clarity purposes only the last 50 ms of the prepulses are shown. Note that chimeric channels availability decreases proportionally as the Vm become more positive, similar to the behavior of CaV3.3-WT channels (see Fig 4). C, steady-state inactivation curves for CaV3.3, IIS4I, and CaV1.2 channels. Currents at 0 mV like those shown in B (or at -30 mV for CaV3.3) were normalized to the value at -100 (-110 for CaV3.3) mV, averaged and plotted as a function of the prepulse potential for each channel. Smooth lines are fits to Boltzmann functions. It should be noted that fitting of CaV1.2 data was performed by constraining the Boltzmann function to go from 1 to 0 (as for all the other channels listed in Table 2), although the experimental data reach only a value of 0.72 at -50 mV. In other words, the obtained V1/2 value is in fact an extrapolation of the fitted data. Data in graphs represent mean ± SEM. Parameter values, number of cells and statistical significance are shown in Table 2. D, time constants of channel deactivation for CaV3.3, IIS4I, and CaV1.2 channels. Time constants were estimated by fitting tail currents to a single exponential function and plotted as a function of the repolarizing potential. Time constants at -90 mV were: 3.33 ± 0.15 ms for CaV3.3-WT (n = 25); 0.27 ± 0.04 ms for IIS4I (n = 8); and 0.19 ± 0.03 ms for CaV1.2-WT (n = 7). Data in graphs represent mean ± SEM. Smooth lines are single exponential fits to the averaged tau values.
Fig 8
Fig 8. Mutagenesis in Domain II reveals a participation of the S4-S5 linker in the LVA behavior of CaV3.3 channels.
A, examples of calcium currents generated by the indicated channels. Holding potential was -100 mV, and current recordings were obtained at -30 mV for CaV3.3-WT and Q716A, and at -20 mV for P711A and RRQ714SNL. B, I-V relationships. Current density was calculated for each cell, averaged, and plotted as a function of test potential. C, normalized I-V curves for inward currents. Data were fitted with a modified Boltzmann function (continuous line). Same cells as shown in B. D, steady-state inactivation curves for WT and the indicated CaV3.3 mutants. Smooth lines are fits to Boltzmann functions. E, time course of recovery from inactivation at -100 mV for the indicated CaV3.3 channels. Data was analyzed and plotted as indicated in Fig 5. F, deactivation time constants for channel closing as a function of the repolarizing potential. Data in graphs represent mean ± SEM. Parameter and tau values, number of cells and statistical significance are shown in Table 3.

Similar articles

Cited by

References

    1. Berridge MJ, Bootman MD, Roderick HL (2003) Calcium signalling: dynamics, homeostasis and remodelling. Nat Rev Mol Cell Biol 4: 517–529. doi: 10.1038/nrm1155 - DOI - PubMed
    1. Perez-Reyes E (2003) Molecular physiology of low-voltage-activated T-type calcium channels. Physiological Reviews 83: 117–161. doi: 10.1152/physrev.00018.2002 - DOI - PubMed
    1. Turner RW, Zamponi GW (2014) T-type channels buddy up. Pflugers Archiv-European Journal of Physiology 466: 661–675. doi: 10.1007/s00424-013-1434-6 - DOI - PMC - PubMed
    1. Lambert RC, Bessaih T, Crunelli V, Leresche N (2014) The many faces of T-type calcium channels. Pflugers Archiv-European Journal of Physiology 466: 415–423. doi: 10.1007/s00424-013-1353-6 - DOI - PubMed
    1. Weiss N, Zamponi GW (2013) Control of low-threshold exocytosis by T-type calcium channels. Biochimica Et Biophysica Acta-Biomembranes 1828: 1579–1586. - PubMed

Publication types

Substances

LinkOut - more resources