

A 10-year case study on the changing determinants of university student satisfaction in the UK
- PMID: 29474452
- PMCID: PMC5825039
- DOI: 10.1371/journal.pone.0192976
A 10-year case study on the changing determinants of university student satisfaction in the UK
Abstract
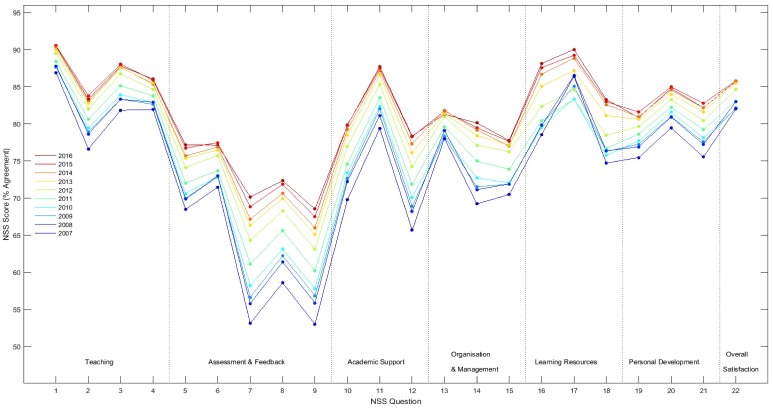
Higher Education (HE), once the prerogative of a tiny elite, is now accessible to larger numbers of people around the world than ever before yet despite the fact that an understanding of student satisfaction has never been more important for today's universities, the concept remains poorly understood. Here we use published data from the UK's National Student Survey (NSS), representing data from 2.3 million full-time students collected from 2007 to 2016, as a case study of the benefits and limitations of measuring student satisfaction that might have applicability for other countries, particularly those that, like the UK, have experienced significant growth in student numbers. The analyses showed that the factor structure of the NSS remained generally stable and that the ability of the NSS to discriminate between different subjects at different universities actually improved over the ten-year sample period. The best predictors of overall satisfaction were 'Teaching Quality' and 'Organisation & Management', with 'Assessment & Feedback' having relatively weak predictive ability, despite the sector's tangible efforts to improve on this metric. The tripling of student fees in 2012 for English students (but not the rest of the UK) was used as a 'natural experiment' to investigate the sensitivity of student satisfaction ratings to the real economic costs of HE. The tuition fee increase had no identifiable negative effect, with student satisfaction steadily improving throughout the decade. Although the NSS was never designed to measure perceived value-for-money, its insensitivity to major changes in the economic costs of HE to the individual suggest that the conventional concept of student satisfaction is incomplete. As such we propose that the concept of student satisfaction: (i) needs to be widened to take into account the broader economic benefits to the individual student by including measures of perceived value-for-money and (ii) should measure students' level of satisfaction in the years post-graduation, by which time they may have a greater appreciation of the value of their degree in the workplace.
Conflict of interest statement
Figures


References
-
- Dee TS. Are there civic returns to education? J Public Econ. 2004;88(9–10):1697–720. https://doi.org/10.1016/j.jpubeco.2003.11.002. - DOI
-
- Holmes C, Mayhew K. The economics of higher education. Oxford Rev Econ Pol. 2016;32(4):475–96. https://doi.org/10.1093/oxrep/grw031. - DOI
-
- King J, Ritchie C. The benefits of higher education participation for individuals and society: key findings and reports—‘the quadrants’: Department for Business, Innovation & Skills; 2013. https://www.gov.uk/government/uploads/system/uploads/attachment_data/fil....
-
- Rospigliosi A, Greener S, Sheehan M, Bourner T. Human Capital or signalling—unpacking the Graduate Premium. International Journal of Social Economics. 2014;41(5):420–32. https://doi.org/10.1108/IJSE-03-2013-0056. - DOI
-
- Sim N. Astronomics in Action: The Graduate Earnings Premium and the Dragon Effect in Singapore. Econ Inq. 2015;53(2):922–39. https://doi.org/10.1111/ecin.12154. - DOI
MeSH terms
LinkOut - more resources
Full Text Sources
Other Literature Sources
Medical
Research Materials
