. 2018 Feb 23;13(2):e0193312.
doi: 10.1371/journal.pone.0193312. eCollection 2018.

RAGE-dependent potentiation of TRPV1 currents in sensory neurons exposed to high glucose

Affiliations

RAGE-dependent potentiation of TRPV1 currents in sensory neurons exposed to high glucose

Doris Lam et al. PLoS One. .

Abstract

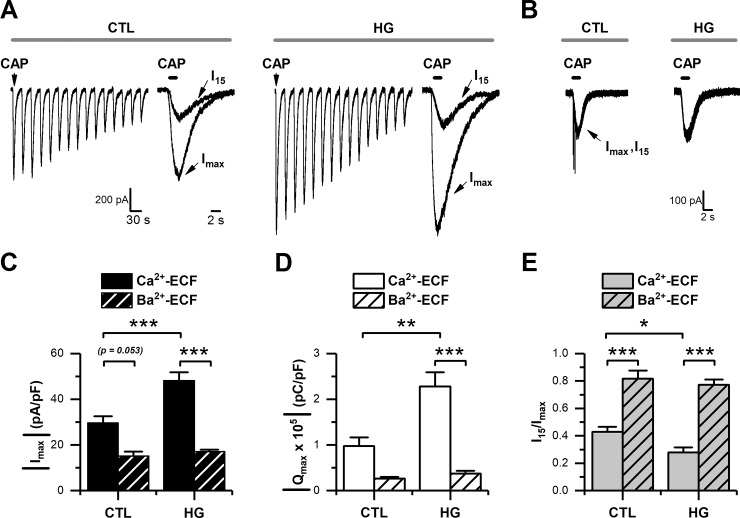
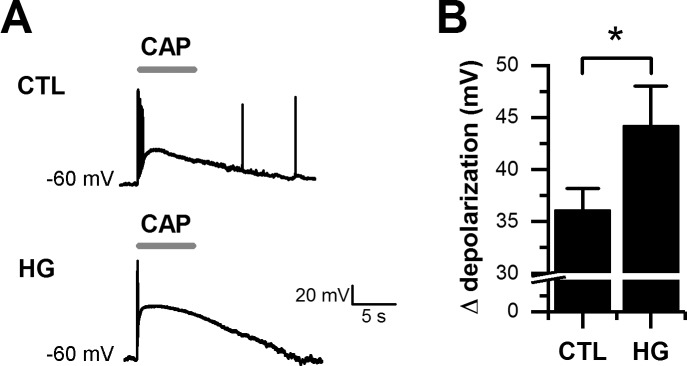
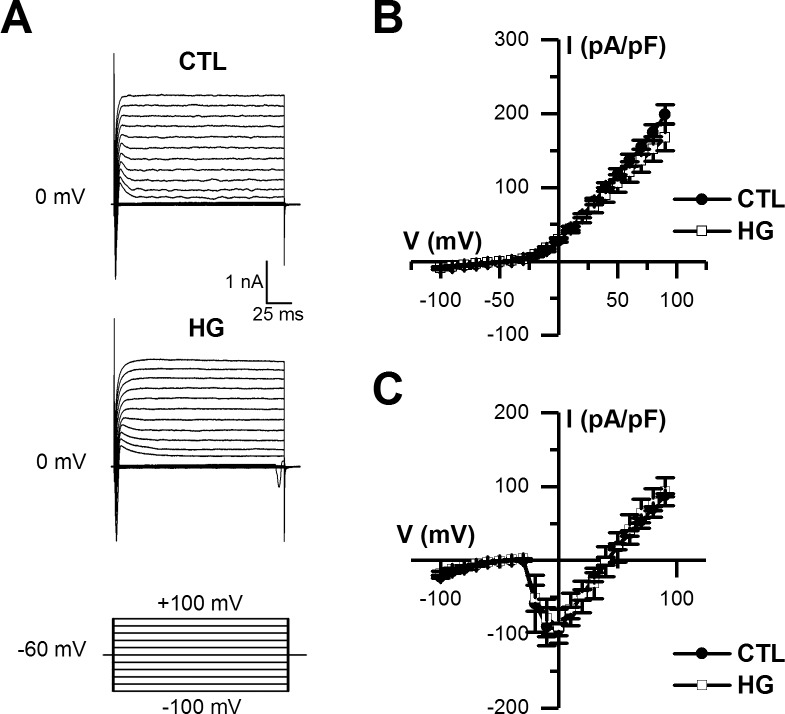
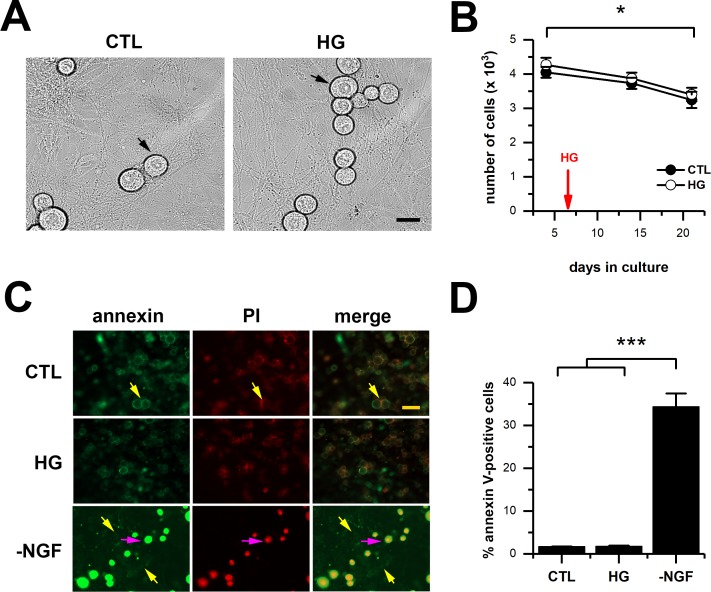
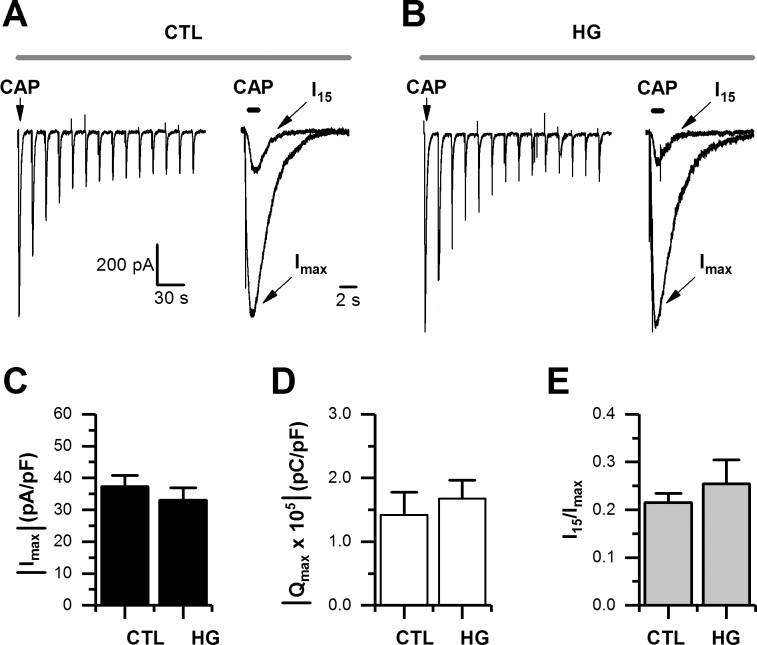
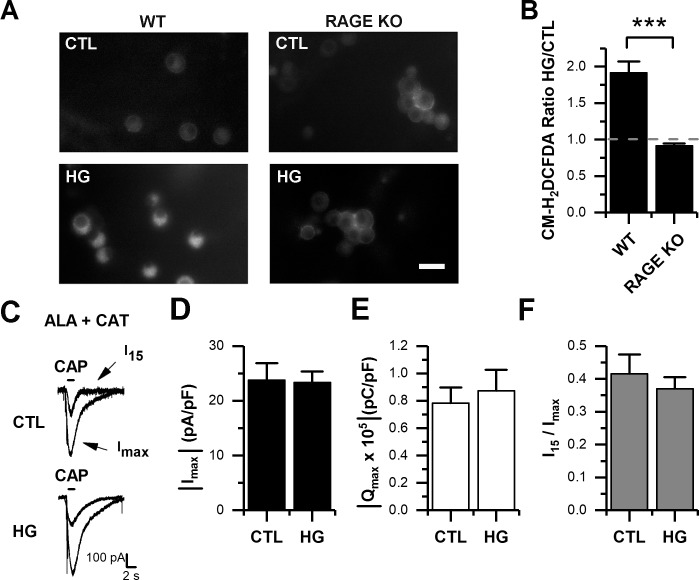
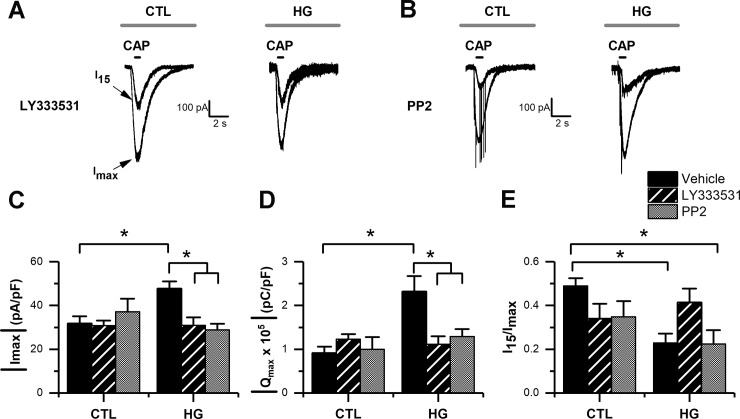
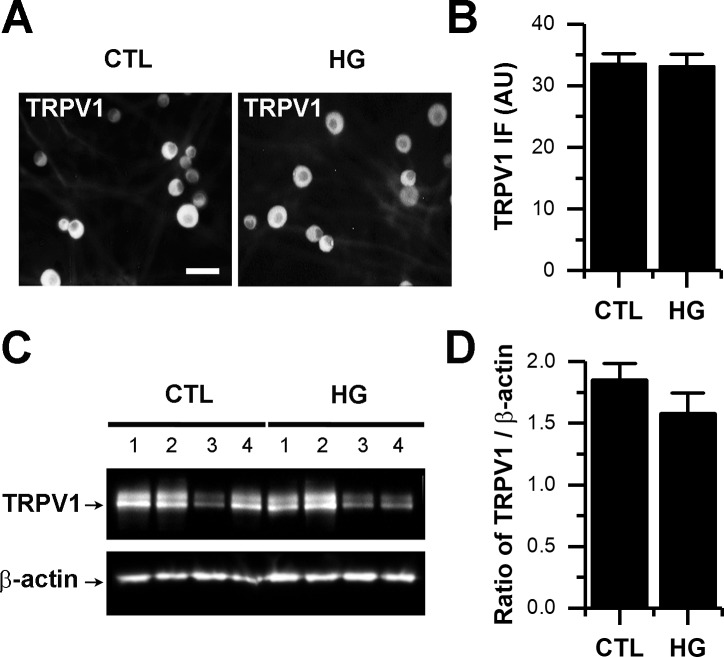
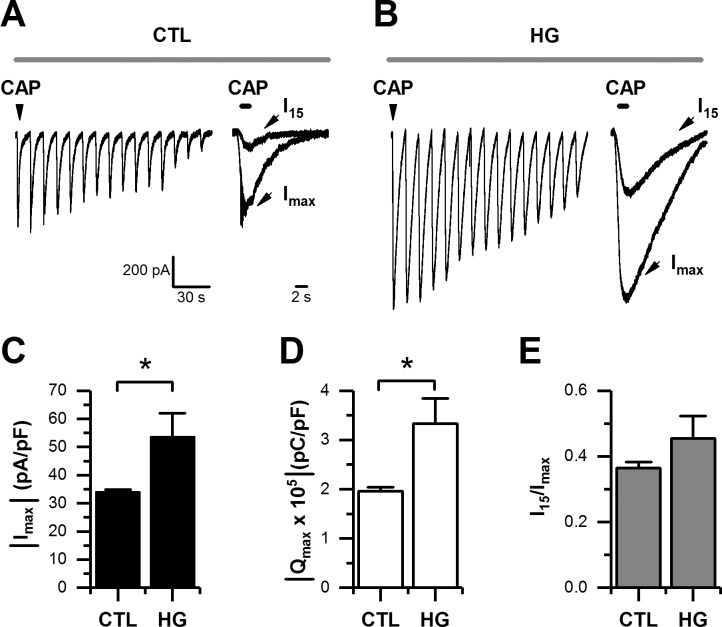
Diabetes mellitus is associated with sensory abnormalities, including exacerbated responses to painful (hyperalgesia) or non-painful (allodynia) stimuli. These abnormalities are symptoms of diabetic peripheral neuropathy (DPN), which is the most common complication that affects approximately 50% of diabetic patients. Yet, the underlying mechanisms linking hyperglycemia and symptoms of DPN remain poorly understood. The transient receptor potential vanilloid 1 (TRPV1) channel plays a central role in such sensory abnormalities and shows elevated expression levels in animal models of diabetes. Here, we investigated the function of TRPV1 channels in sensory neurons cultured from the dorsal root ganglion (DRG) of neonatal mice, under control (5mM) and high glucose (25mM) conditions. After maintaining DRG neurons in high glucose for 1 week, we observed a significant increase in capsaicin (CAP)-evoked currents and CAP-evoked depolarizations, independent of TRPV1 channel expression. These functional changes were largely dependent on the expression of the receptor for Advanced Glycation End-products (RAGE), calcium influx, cytoplasmic ROS accumulation, PKC, and Src kinase activity. Like cultured neurons from neonates, mature neurons from adult mice also displayed a similar potentiation of CAP-evoked currents in the high glucose condition. Taken together, our data demonstrate that under the diabetic condition, DRG neurons are directly affected by elevated levels of glucose, independent of vascular or glial signals, and dependent on RAGE expression. These early cellular and molecular changes to sensory neurons in vitro are potential mechanisms that might contribute to sensory abnormalities that can occur in the very early stages of diabetes.


Conflict of interest statement

Competing Interests: The authors have declared that no competing interests exist.

Figures

Fig 1
Fig 1. High glucose potentiated CAP-evoked currents in cultured DRG neurons.
A-B, representative traces of CAP-evoked currents recorded in whole-cell voltage-clamp mode (holding potential set at -60 mV). Agonist was applied for 1 s and repeated every 30 s, in control (CTL), and high glucose (HG) in Ca2+-ECF (A), and in the same glucose conditions but in Ba2+-ECF (B), respectively. C-E, bar graphs summarizing maximal current (Imax) density (C), maximal current charge (Qmax; D), and maximal current rundown calculated as the ratio of Imax relative to the 15th application (I15) in a series (E), for CTL (n = 24) and HG (n = 24) in Ca2+-ECF; and for CTL (n = 8) and HG (n = 11) in Ba2+-ECF, respectively. All data are represented as mean ± SEM. The absolute current density and charge were used in C and D for simplicity. Statistical analysis by two-way ANOVA followed by Sidak's post-hoc test. *, p < 0.05; **, p < 0.01; ***, p < 0.001.
Fig 2
Fig 2. High glucose enhanced CAP-evoked depolarizations in cultured DRG neurons.
A, representative traces showing membrane depolarization induced in a single neuron from control (CTL, top trace) or high glucose (HG, bottom trace) condition by 5 s applications of CAP during whole-cell current clamp recordings. B, the bar graph summarizes the change in membrane potential evoked by the application of CAP. All data are represented as mean ± SEM, n = 8 for each condition. Statistical analysis by unpaired t-test; *, p < 0.05.
Fig 3
Fig 3. Voltage-gated currents were unaffected by high glucose conditions.
A, show representative traces of macroscopic voltage-gated outward and inward currents recorded in voltage-clamp mode (holding potential set at -60 mV) by the application of a voltage step protocol (inset), in cultured DRG neurons maintained in either control (CTL, top traces) or high glucose (HG, bottom traces). B-C, the I-V plot summarize the mean outward current density (B) and mean inward peak current density (C) obtained at different step voltages, in both experimental conditions. All data are represented as mean ± SEM, n = 5 for each condition.
Fig 4
Fig 4. DRG neuronal counts for cultures from WT mice, maintained in either control (CTL) or high glucose (HG).
A, representative phase-contrast images of neurons at 21 days after culturing, maintained in CTL or HG (for 14 days), show healthy neurons with clear nuclei (arrows) and smooth membrane (40x magnification). B, bar graph summarizes the number of neurons per culture dish in CTL (n = 7) and HG (n = 7) at 4, 14 and 21 days after culturing. All cultures were generated in control levels of glucose and half of them where switched to high glucose levels at 7 days after culturing (red arrow). C, representative images for annexinV-FITC and propidium iodide (PI) fluorescence, in either CTL, HG, or in -NGF as positive control (20x magnification). Yellow arrows show representative examples of non-apoptotic cells, and purple arrows show an example of an apoptotic/necrotic cell. D, bar graph summarizes the percentage of annexinV-positive cells (n = 4, per condition), 1.6% for CTL, 1.7% for HG, and 34.3% for -NGF. All data are represented as mean ± SEM, means were compared by repeated measures one-way ANOVA followed by Tukey post-hoc test (B); and by one-way (non-parametric) ANOVA followed by Dunn’s post-hoc test (D). *, p < 0.05. Scale bars represent 30 μm (A) and 50 μm (C).
Fig 5
Fig 5. High glucose failed to potentiate CAP-evoked currents in cultured DRG neurons from RAGE KO mice.
A-B, representative traces of CAP-evoked currents recorded during whole-cell voltage-clamp recording (holding potential set at -60 mV) from DRG neurons maintained in either control (CTL) or high glucose (HG) conditions. C-E, bar graphs summarize maximal current (Imax) density (C), maximal current charge (Qmax; D), and current rundown calculated as the ratio I15/ Imax (E). All data are represented as mean ± SEM, n = 14 for each condition. The absolute current density and charge were used in C and D for simplicity. Statistical analysis by unpaired t-test (C-D), and Mann-Whitney test (E); no significant differences between treatments were found.
Fig 6
Fig 6. High glucose induces intracellular ROS accumulation.
A, representative images of ROS detection by CM-H2DCFDA fluorescence, in cultured DRG neurons from WT and RAGE KO mice, maintained in control (CTL) and high glucose (HG) conditions for 1 week. B, the bar graph summarizes mean ± SEM pixel intensity for HG/CTL ratio for neurons from WT (n = 110) and RAGE KO (n = 156) mice, respectively. C, representative traces showing CAP-evoked currents recorded in the presence of ALA+CAT in CTL and HG conditions. D-F, bar graphs summarize maximal current (Imax) density (D), maximal current charge (Qmax; E), and current rundown calculated as the ratio I15/ Imax (F). All data are represented as mean ± SEM, ALA + CAT (CTL, n = 10; HG, n = 12). Scale bar in A represent 30 μm. Statistical analysis by one sample t-test hypothetical mean = 1 (B), unpaired t-test (D-E), and Mann-Whitney test (F). ***, p < 0.001.
Fig 7
Fig 7. Potentiation of CAP-evoked currents was dependent on PKC and Src kinase activity.
A, representative current traces of CAP-evoked currents obtained from cultured DRG neurons during whole-cell voltage-clamp recording (holding potential set at -60 mV), in control (CTL) and high glucose (HG) conditions in the presence of LY333531 and PP2. B-D, bar graphs summarize maximal current (Imax) density (B), maximal current charge (Qmax; C), and current rundown calculated as the ratio I15/Imax (D). Bars show treatment conditions examined: vehicle (DMSO 1μl/ml, CTL and HG n = 10), LY333531 (CTL, n = 11; HG, n = 9), and PP2 (CTL, n = 5; HG, n = 5). All data are represented as mean ± SEM. The absolute current density and charge were used in B and C for simplicity. Statistical analysis by two-way ANOVA followed by Sidak's post-hoc test. *, p < 0.05.
Fig 8
Fig 8. High glucose did not increase expression of TRPV1 channels.
A, representative images immunocytochemistry for the detection of TRPV1 protein in cultured DRG maintained in either control (CTL) or high glucose (HG) conditions. B, bar graph summarizes mean pixel intensity for CTL (n = 71; HG, n = 51). C, western blots showing TRPV1 and β-actin expression in 4 independent samples (per treatment) of cultured DRG neurons exposed to either CTL or HG for 10 days. B, bar graph summarizes the ratio of TRPV1/β-actin per treatment. All data are represented as mean ± SEM. Scale bar in A represents 30 μm. Statistical analysis by MannWhitney test; no significant differences were found between treatments (B-D). AU, arbitrary units.
Fig 9
Fig 9. High glucose also potentiated CAP-evoked currents in cultured DRG neurons from adult mice.
A-B, representative traces of CAP-evoked currents from cultured adult DRG neurons during whole-cell voltage-clamp recording (holding potential set at -60 mV), in control (CTL) and high glucose (HG) conditions. C-E, bar graphs summarize maximal current (Imax) density (C), maximal current charge (Qmax; D), and maximal current rundown calculated as the ratio I15/Imax (E), for CTL (n = 9) and HG (n = 8) conditions, respectively. All data are represented as mean ± SEM. The absolute current density and charge were used in C and D for simplicity. Statistical analysis by unpaired t-test (C-D), and Mann-Whitney test (E). *, p < 0.05.

Similar articles

Cited by

References

    1. Spruce MC, Potter J, Coppini D V. The pathogenesis and management of painful diabetic neuropathy: a review. Diabet Med. 2003;20: 88–98. - PubMed
    1. Obrosova IG. Diabetes and the peripheral nerve. Biochim Biophys Acta—Mol Basis Dis. Elsevier B.V.; 2009;1792: 931–940. doi: 10.1016/j.bbadis.2008.11.005 - DOI - PubMed
    1. Kamei J, Zushida K, Morita K, Sasaki M, Tanaka S. Role of vanilloid VR1 receptor in thermal allodynia and hyperalgesia in diabetic mice. Eur J Pharmacol. 2001;422: 83–6. - PubMed
    1. Khan GM, Chen S-R, Pan H-L. Role of primary afferent nerves in allodynia caused by diabetic neuropathy in rats. Neuroscience. 2002;114: 291–9. - PubMed
    1. Rashid MH, Inoue M, Bakoshi S, Ueda H. Increased Expression of Vanilloid Receptor 1 on Myelinated Primary Afferent Neurons Contributes to the Antihyperalgesic Effect of Capsaicin Cream in Diabetic Neuropathic Pain in Mice. J Pharmacol Exp Ther. 2003;306. - PubMed

Publication types

MeSH terms