. 2018 Jul 15;34(14):2384-2391.
doi: 10.1093/bioinformatics/bty097.

PennDiff: detecting differential alternative splicing and transcription by RNA sequencing

Affiliations

PennDiff: detecting differential alternative splicing and transcription by RNA sequencing

Yu Hu et al. Bioinformatics. .

Abstract

Motivation: Alternative splicing and alternative transcription are a major mechanism for generating transcriptome diversity. Differential alternative splicing and transcription (DAST), which describe different usage of transcript isoforms across different conditions, can complement differential expression in characterizing gene regulation. However, the analysis of DAST is challenging because only a small fraction of RNA-seq reads is informative for isoforms. Several methods have been developed to detect exon-based and gene-based DAST, but they suffer from power loss for genes with many isoforms.

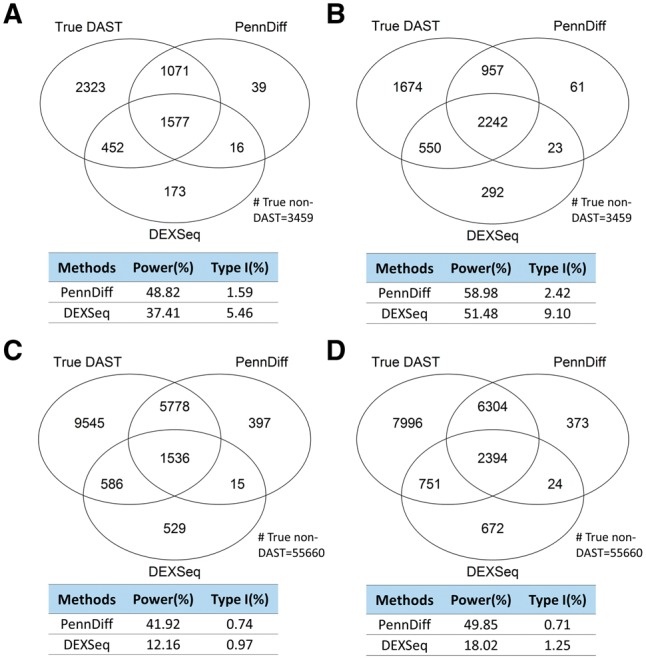
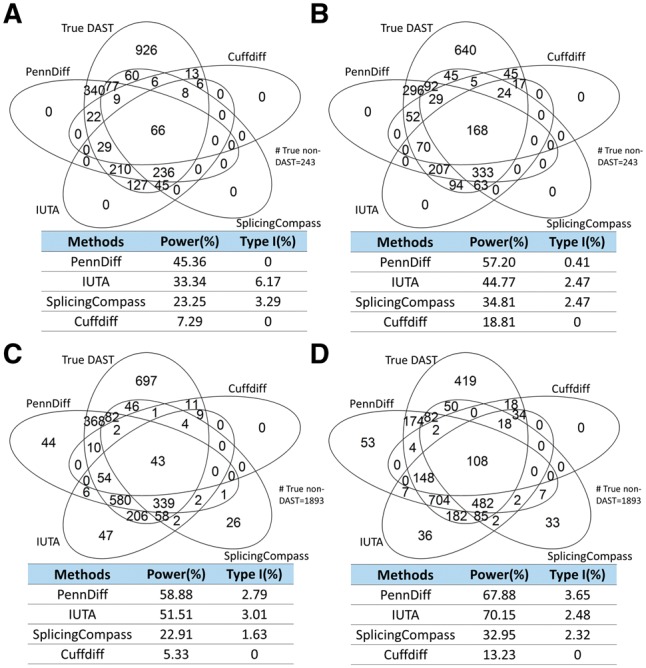
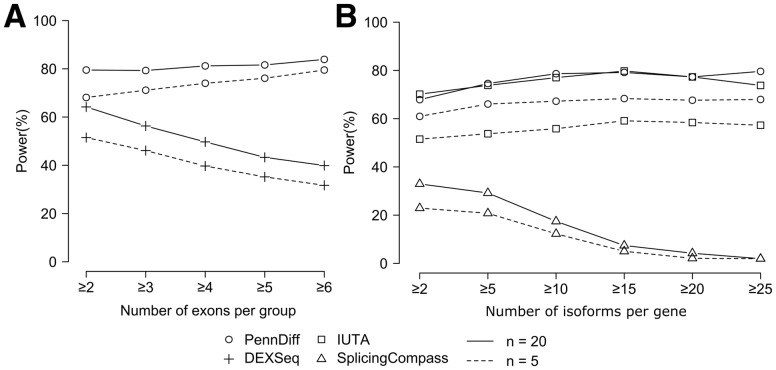
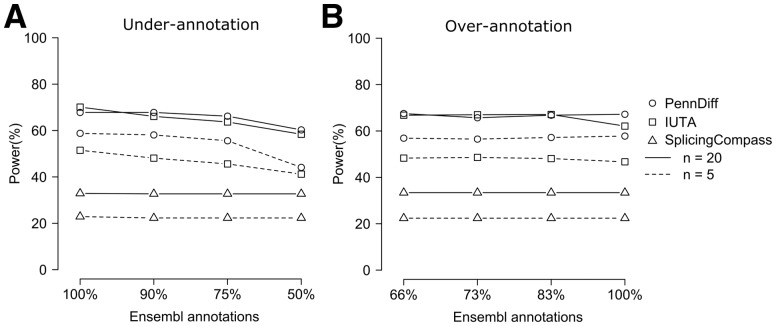
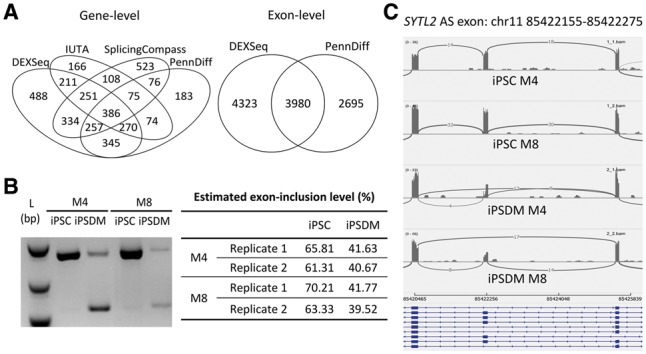
Results: We present PennDiff, a novel statistical method that makes use of information on gene structures and pre-estimated isoform relative abundances, to detect DAST from RNA-seq data. PennDiff has several advantages. First, grouping exons avoids multiple testing for 'exons' originated from the same isoform(s). Second, it utilizes all available reads in exon-inclusion level estimation, which is different from methods that only use junction reads. Third, collapsing isoforms sharing the same alternative exons reduces the impact of isoform expression estimation uncertainty. PennDiff is able to detect DAST at both exon and gene levels, thus offering more flexibility than existing methods. Simulations and analysis of a real RNA-seq dataset indicate that PennDiff has well-controlled type I error rate, and is more powerful than existing methods including DEXSeq, rMATS, Cuffdiff, IUTA and SplicingCompass. As the popularity of RNA-seq continues to grow, we expect PennDiff to be useful for diverse transcriptomics studies.

Availability and implementation: PennDiff source code and user guide is freely available for download at https://github.com/tigerhu15/PennDiff.

Supplementary information: Supplementary data are available at Bioinformatics online.


Figures

Fig. 1.
Fig. 1.
Partitioning biological exons into non-overlapping virtual exons in a gene with three isoforms. This gene has 14 virtual exons, of which 9 are alternative spliced or transcribed. These alternative exons can be divided into three exon groups
Fig. 2.
Fig. 2.
Smooth scatter plot of logit transformed estimated exon-inclusion levels versus logit transformed true values. Correlation was calculated on the logit transformed values. (A) Exon-inclusion levels estimated by PennDiff based on RefSeq annotation (8061 alternative splicing or transcription events). (B) Exon-inclusion levels estimated by PennDiff based on Ensembl annotation (49 607 alternative splicing or transcription events)
Fig. 3.
Fig. 3.
Type I error and power of exon-based methods with different sample sizes and gene annotations. Calculations were based on all DAST and non-DAST exons in the input data. Significance was evaluated at the 5% significance level. An exon with true exon-inclusion level difference >0.1 was defined as a true DAST exon. (A) 5 versus 5 based on RefSeq annotation. (B) 20 versus 20 based on RefSeq annotation. (C) 5 versus 5 based on Ensembl annotation. (D) 20 versus 20 based on Ensembl annotation
Fig. 4.
Fig. 4.
Type I error and power of gene-based methods with different sample sizes and gene annotations. Calculations were based on all DAST and non-DAST genes in the input data. Significance was evaluated at the 5% significance level. A gene with true Hellinger distance >0.1 was defined as a true DAST gene. (A) 5 versus 5 based on RefSeq annotation. (B) 20 versus 20 based on RefSeq annotation. (C) 5 versus 5 based on Ensembl annotation. (D) 20 versus 20 based on Ensembl annotation
Fig. 5.
Fig. 5.
The impact of gene complexity on power of different methods. (A) Power comparison between PennDiff and DEXSeq when results were stratified by the number of exons per group (≥2: 2765 exon groups, ≥3: 1103 exon groups, ≥4: 668 exon groups, ≥5: 460 exon groups, ≥6: 370 exon groups). Significance was evaluated at the 5% level. (B) Power comparison between PennDiff, IUTA and SplicingCompass when results were stratified by the number of isoforms per gene (≥2: 6321 genes, ≥5: 4232 genes, ≥10: 2102 genes, ≥15: 941 genes, ≥20: 426 genes, ≥25: 189 genes). Significance was evaluated at the 5% level
Fig. 6.
Fig. 6.
The impact of mis-annotation of isoforms on power of different methods. (A) Evaluation of the impact of under-annotation of isoforms. Shown are the power estimates of PennDiff, IUTA and SplicingCompass based on 100% (true), 90% (10% less), 75% (25% less) and 50% (50% less) of the Ensembl annotated isoforms. (B) Evaluation of the impact of over-annotation of isoforms. Shown are the power estimates of PennDiff, IUTA and SplicingCompass based on 66% (true), 73% (10% more), 83% (25% more) and 100% (50% more) of the Ensembl annotated isoforms
Fig. 7.
Fig. 7.
(A) DAST genes detected by different methods for human induced pluripotent stem cells (iPSCs) versus iPSC-derived macrophages (iPSDMs). (B) RT-PCR validation of alternatively spliced exon chr11: 5422155–85422275 in SYTL2 in samples of two human donors we performed the RNA-seq studies. The exon-inclusion levels shown in the table were estimated based on the gel image. (C) IGV sashimi plot of gene SYTL2. M4 and M8 are two study subjects

Similar articles

Cited by

References

    1. Anders S., Huber W. (2010) Differential expression analysis for sequence count data. Genome Biol., 11, R106.. - PMC - PubMed
    1. Aschoff M. et al. (2013) SplicingCompass: differential splicing detection using RNA-seq data. Bioinformatics, 29, 1141–1148. - PubMed
    1. Griebel T. et al. (2012) Modelling and simulating generic RNA-Seq experiments with the flux simulator. Nucleic Acids Res., 40, 10073–10083. - PMC - PubMed
    1. Han J. et al. (2011) Pre-mRNA splicing: where and when in the nucleus. Trends Cell Biol., 21, 336–343. - PMC - PubMed
    1. He J. et al. (2012) A Gaussian copula approach for the analysis of secondary phenotypes in case-control genetic association studies. Biostatistics, 13, 497–508. - PMC - PubMed

Publication types