

The response of mesophyll conductance to short-term variation in CO2 in the C4 plants Setaria viridis and Zea mays
- PMID: 29474683
- PMCID: PMC6018935
- DOI: 10.1093/jxb/erx464
The response of mesophyll conductance to short-term variation in CO2 in the C4 plants Setaria viridis and Zea mays
Abstract
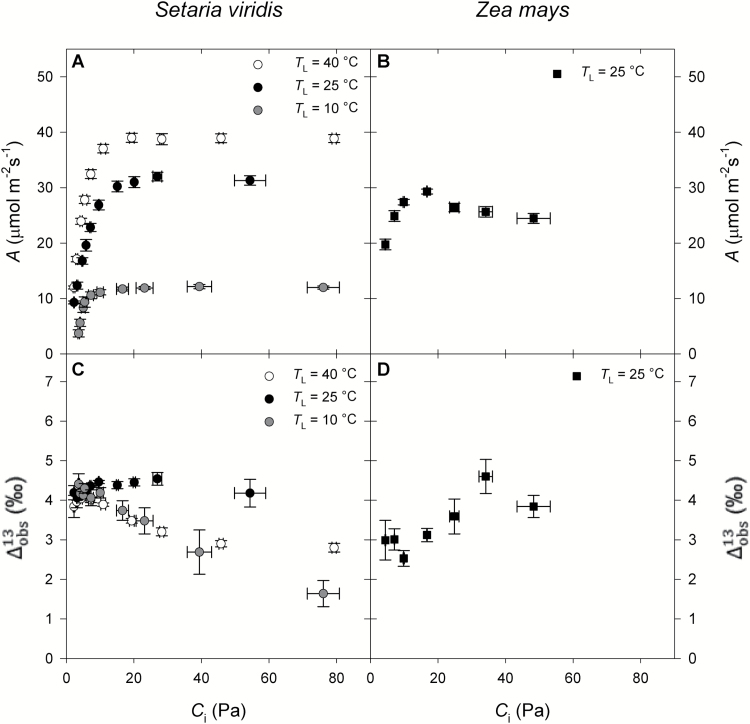
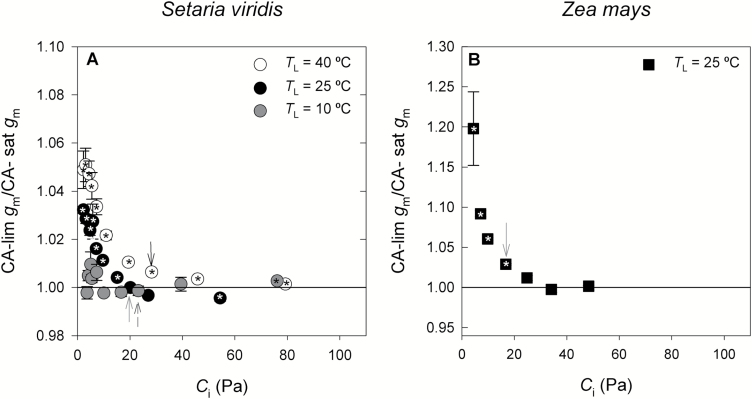
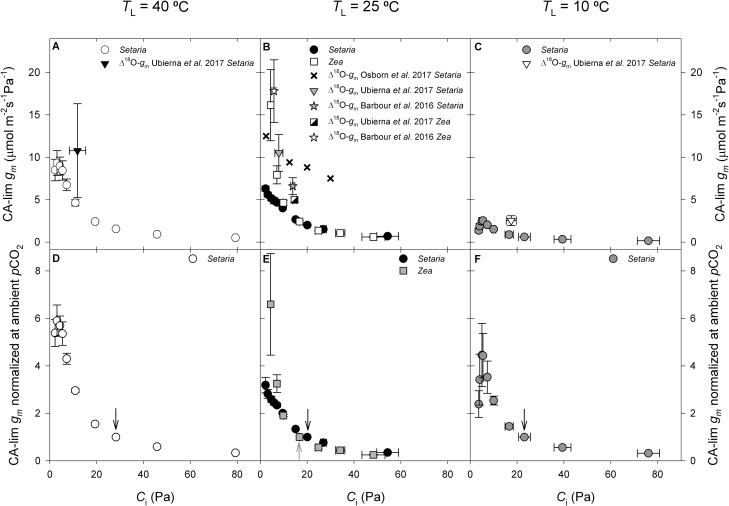
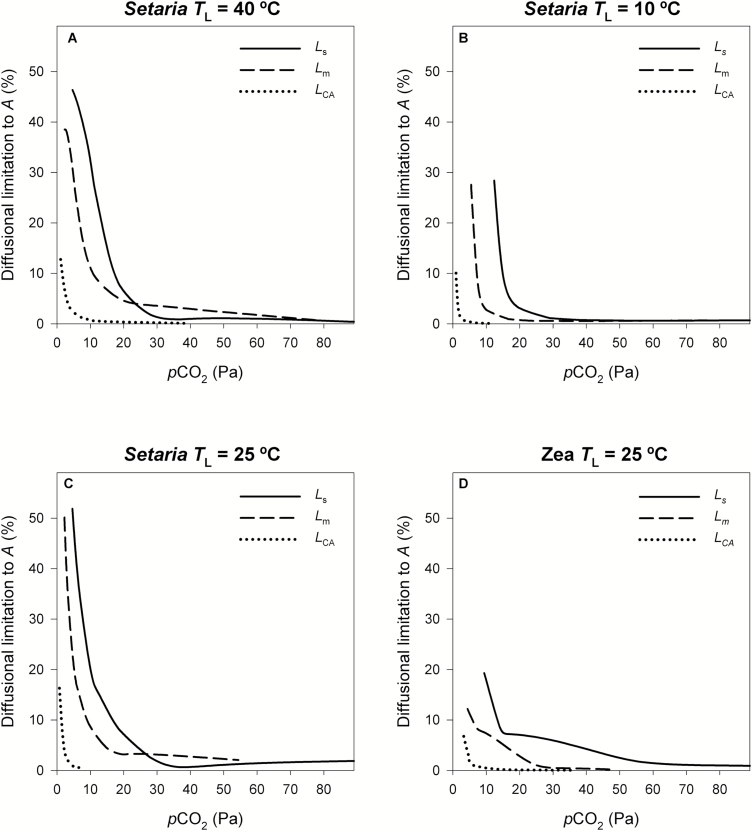
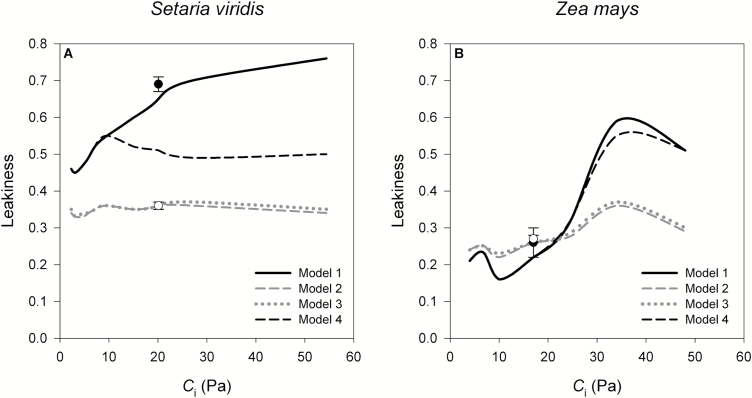
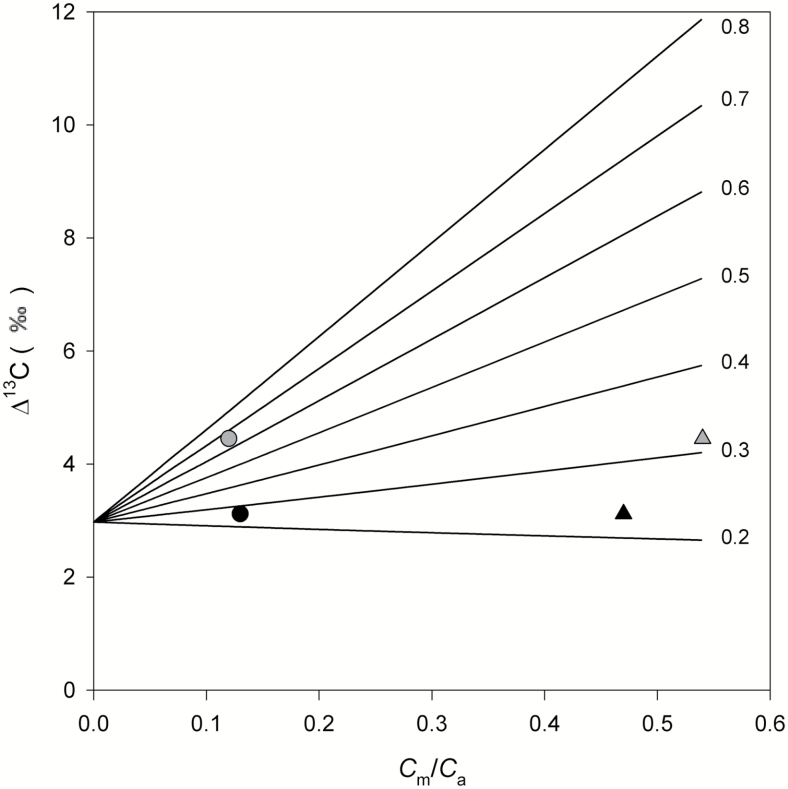
Mesophyll conductance (gm) limits rates of C3 photosynthesis but little is known about its role in C4 photosynthesis. If gm were to limit C4 photosynthesis, it would likely be at low CO2 concentrations (pCO2). However, data on C4-gm across ranges of pCO2 are scarce. We describe the response of C4-gm to short-term variation in pCO2, at three temperatures in Setaria viridis, and at 25 °C in Zea mays. Additionally, we quantified the effect of finite gm calculations of leakiness (ϕ) and the potential limitations to photosynthesis imposed by stomata, mesophyll, and carbonic anhydrase (CA) across pCO2. In both species, gm increased with decreasing pCO2. Including a finite gm resulted in either no change or increased ϕ compared with values calculated with infinite gm depending on whether the observed 13C discrimination was high (Setaria) or low (Zea). Post-transitional regulation of the maximal PEP carboxylation rate and PEP regeneration limitation could influence estimates of gm and ϕ. At pCO2 below ambient, the photosynthetic rate was limited by CO2 availability. In this case, the limitation imposed by the mesophyll was similar or slightly lower than stomata limitation. At very low pCO2, CA further constrained photosynthesis. High gm could increase CO2 assimilation at low pCO2 and improve photosynthetic efficiency under situations when CO2 is limited, such as drought.
Figures
Similar articles
-
Effects of reduced carbonic anhydrase activity on CO2 assimilation rates in Setaria viridis: a transgenic analysis.J Exp Bot. 2017 Jan;68(2):299-310. doi: 10.1093/jxb/erw357. Epub 2016 Oct 4. J Exp Bot. 2017. PMID: 27702996 Free PMC article.
-
Expression of a CO2-permeable aquaporin enhances mesophyll conductance in the C4 species Setaria viridis.Elife. 2021 Nov 29;10:e70095. doi: 10.7554/eLife.70095. Elife. 2021. PMID: 34842138 Free PMC article.
-
Mesophyll conductance in Zea mays responds transiently to CO2 availability: implications for transpiration efficiency in C4 crops.New Phytol. 2018 Mar;217(4):1463-1474. doi: 10.1111/nph.14942. Epub 2017 Dec 8. New Phytol. 2018. PMID: 29220090
-
Bundle-sheath leakiness in C4 photosynthesis: a careful balancing act between CO2 concentration and assimilation.J Exp Bot. 2014 Jul;65(13):3443-57. doi: 10.1093/jxb/eru157. Epub 2014 Apr 22. J Exp Bot. 2014. PMID: 24755278 Review.
-
Recent developments in mesophyll conductance in C3, C4, and crassulacean acid metabolism plants.Plant J. 2020 Feb;101(4):816-830. doi: 10.1111/tpj.14664. Epub 2020 Feb 5. Plant J. 2020. PMID: 31960507 Review.
Cited by
-
Mesophyll conductance response to short-term changes in pCO2 is related to leaf anatomy and biochemistry in diverse C4 grasses.New Phytol. 2022 Nov;236(4):1281-1295. doi: 10.1111/nph.18427. Epub 2022 Sep 1. New Phytol. 2022. PMID: 35959528 Free PMC article.
-
Multi-omics intervention in Setaria to dissect climate-resilient traits: Progress and prospects.Front Plant Sci. 2022 Aug 31;13:892736. doi: 10.3389/fpls.2022.892736. eCollection 2022. Front Plant Sci. 2022. PMID: 36119586 Free PMC article. Review.
-
The carbon isotopic signature of C4 crops and its applicability in breeding for climate resilience.Theor Appl Genet. 2021 Jun;134(6):1663-1675. doi: 10.1007/s00122-020-03761-3. Epub 2021 Feb 11. Theor Appl Genet. 2021. PMID: 33575820 Free PMC article. Review.
-
Leaf scale quantification of the effect of photosynthetic gas exchange on Δ47 of CO2.Sci Rep. 2021 Jul 7;11(1):14023. doi: 10.1038/s41598-021-93092-0. Sci Rep. 2021. PMID: 34234170 Free PMC article.
-
Fast dehydration reduces bundle sheath conductance in C4 maize and sorghum.New Phytol. 2024 Dec;244(6):2197-2209. doi: 10.1111/nph.20167. Epub 2024 Oct 25. New Phytol. 2024. PMID: 39460370 Free PMC article.
References
-
- Arnau J, Bono R, Vallejo G. 2009. Analyzing small samples of repeated measures data with the mixed-model adjusted F test. Communications in Statistics - Simulation and Computation 38, 1083–1103.
-
- Barbour MM, Evans JR, Simonin KA, von Caemmerer S. 2016. Online CO2 and H2O oxygen isotope fractionation allows estimation of mesophyll conductance in C4 plants, and reveals that mesophyll conductance decreases as leaves age in both C4 and C3 plants. New Phytologist 210, 875–889. - PubMed
-
- Bellasio C, Griffiths H. 2014. Acclimation to low light by C4 maize: implications for bundle sheath leakiness. Plant, Cell & Environment 37, 1046–1058. - PubMed
Publication types
MeSH terms
Substances
LinkOut - more resources
Full Text Sources
Other Literature Sources
Miscellaneous
