. 2018 Feb 22;172(5):952-965.e18.
doi: 10.1016/j.cell.2018.02.019.

Inborn Errors of RNA Lariat Metabolism in Humans with Brainstem Viral Infection

Affiliations

Inborn Errors of RNA Lariat Metabolism in Humans with Brainstem Viral Infection

Shen-Ying Zhang et al. Cell. .

Abstract

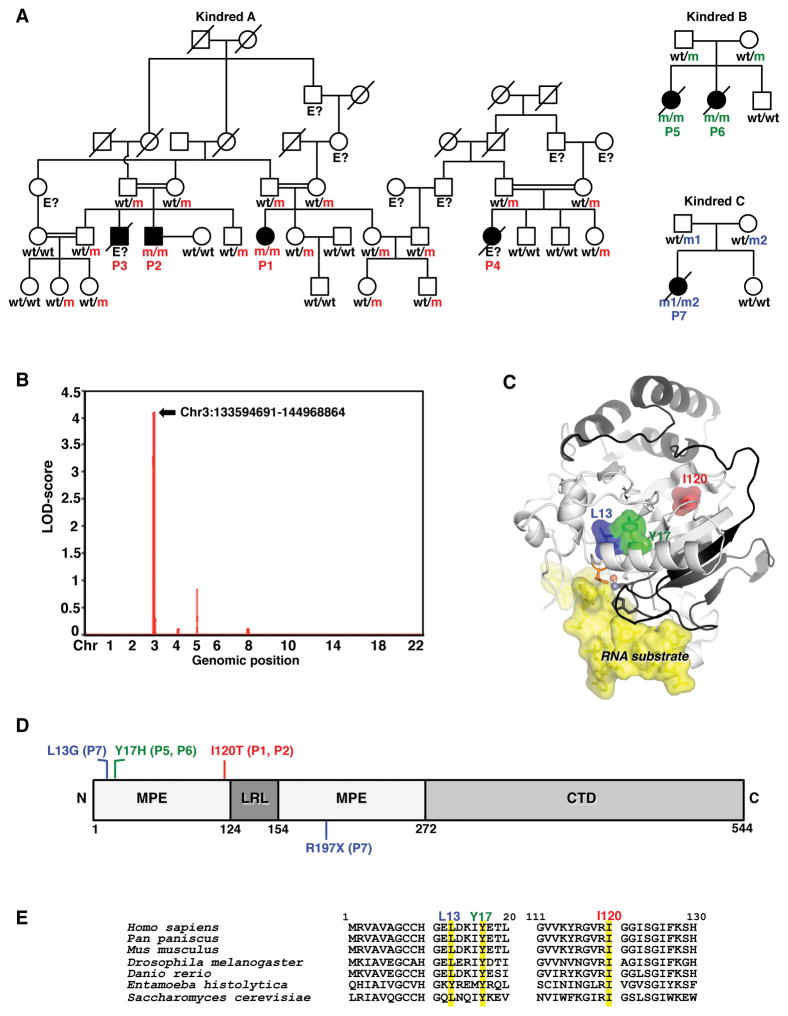
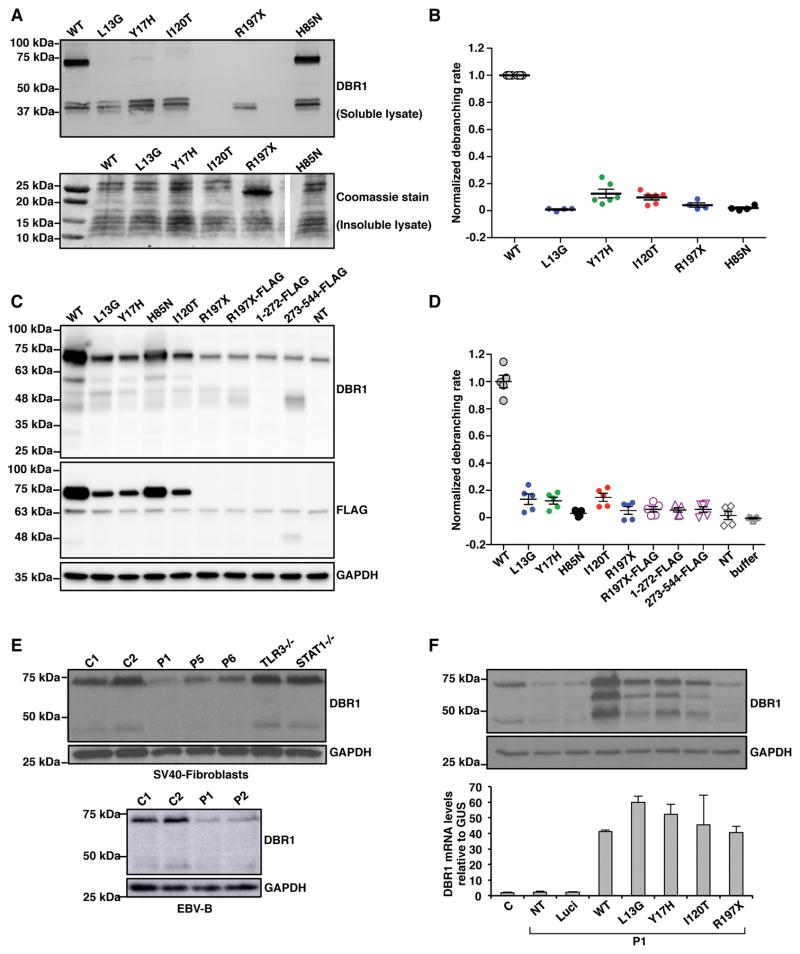
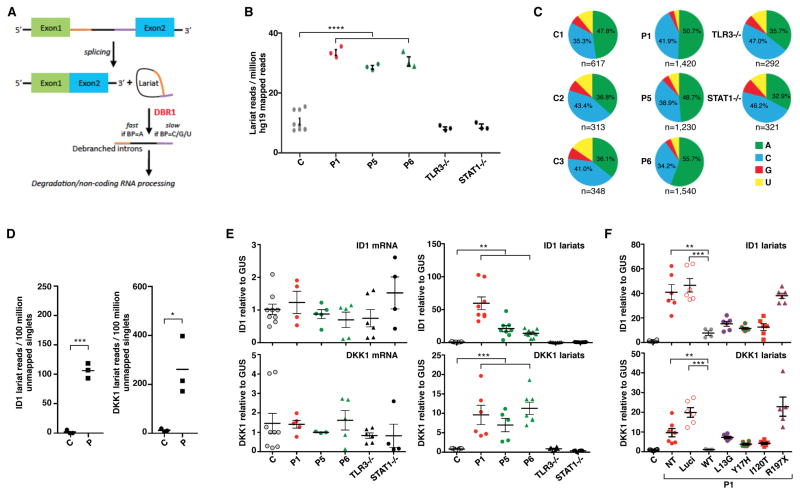
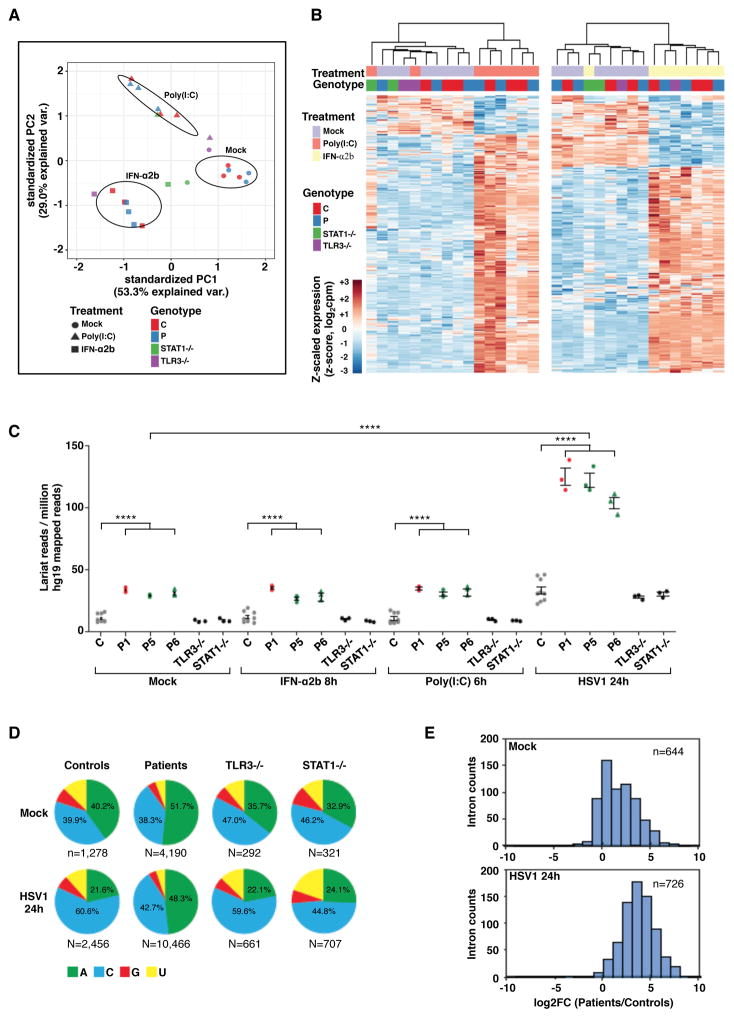
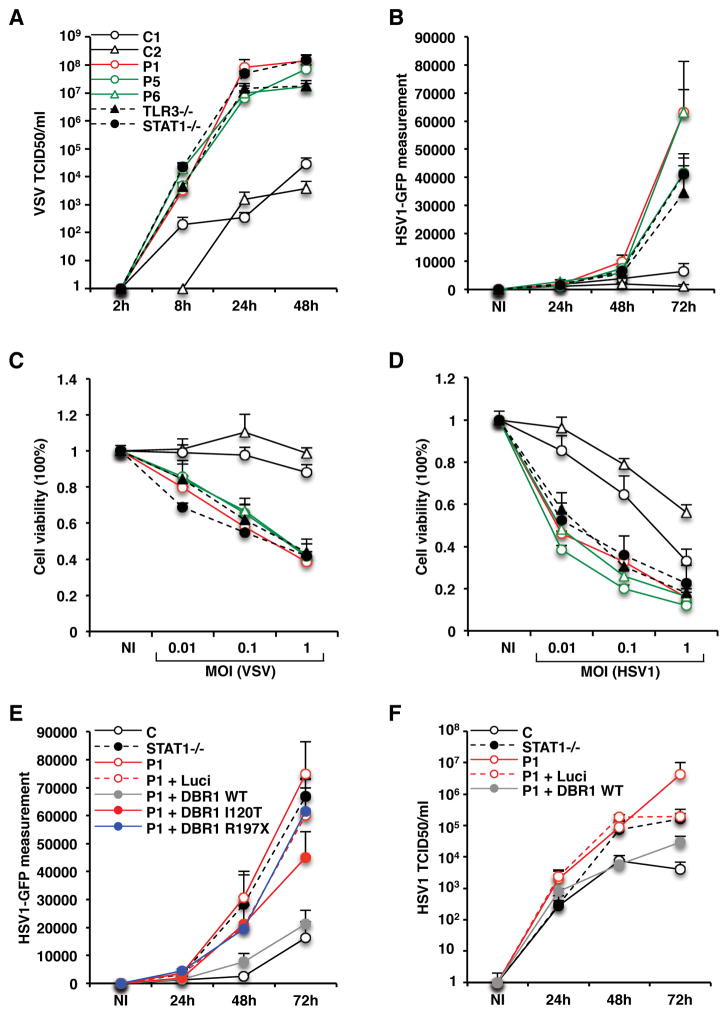
Viruses that are typically benign sometimes invade the brainstem in otherwise healthy children. We report bi-allelic DBR1 mutations in unrelated patients from different ethnicities, each of whom had brainstem infection due to herpes simplex virus 1 (HSV1), influenza virus, or norovirus. DBR1 encodes the only known RNA lariat debranching enzyme. We show that DBR1 expression is ubiquitous, but strongest in the spinal cord and brainstem. We also show that all DBR1 mutant alleles are severely hypomorphic, in terms of expression and function. The fibroblasts of DBR1-mutated patients contain higher RNA lariat levels than control cells, this difference becoming even more marked during HSV1 infection. Finally, we show that the patients' fibroblasts are highly susceptible to HSV1. RNA lariat accumulation and viral susceptibility are rescued by wild-type DBR1. Autosomal recessive, partial DBR1 deficiency underlies viral infection of the brainstem in humans through the disruption of tissue-specific and cell-intrinsic immunity to viruses.

Keywords: DBR1; RNA lariat debranching; brainstem; viral encephalitis.


Conflict of interest statement

Declaration of Interests

The authors declare no competing interests.

Figures

Figure 1
Figure 1. Bi-allelic DBR1 mutations in patients with brainstem viral encephalitis from three kindreds
A) Family pedigrees with allele segregation. The patients, in black, are homozygous for the I120T (‘m’ in red) or the Y17H (‘m’ in green) mutation, or compound heterozygous for the R197X and L13G mutations (‘m1’ and ‘m2’, respectively, in blue). The other family members were either heterozygous for one mutant allele or wild-type (wt). B) Whole-genome linkage analysis for kindreds A and B. C) Predicted 3-dimensional structure of human DBR1 protein. The residues affected by the three missense mutations found in viral encephalitis patients are highlighted in red (I120), green (Y17H) or blue (L13). This human DBR1 homology model was built from PDB 5K78. A 16-mer RNA substrate is shown as a yellow area. Residues 1–197 are shown in gray, and residues 198–363 are shown in black. H10, shown in orange, is a key active site residue that binds the Zn cofactor and stacks with the branch point adenosine of intron lariats. The Fe and Zn cofactors are shown in orange and gray, respectively. D) Schematic representation of the structure of the human DBR1 protein, and location of the mutations. MPE: metallophosphoesterase core domain. LRL: lariat recognition loop. (LRL). CTD: C-terminal domain. E) Human DBR1 gene sequence, for the regions containing the three patient-specific missense mutations and the corresponding regions for the other six species studied. The nucleotides affected by the mutations are shaded in yellow. See also Figure S1–2, Data S1, and Table S1–3.
Figure 2
Figure 2. Impaired production and function of the patient-specific DBR1 mutant proteins
A) Wild-type (WT) and mutant DBR1 protein levels in E. coli. Levels of WT, L13G, Y17H, I120T or R197X DBR1 in the soluble fraction of lysates were assessed by western blotting (upper panel), with an anti-DBR1 polyclonal antibody (pAb). The lower panel shows a Coomassie-stained gel of the insoluble fraction of the lysate. B) Debranching activity of the WT and mutant DBR1 proteins in the soluble fraction of E. coli lysates. The results of 4–6 independent biological replicates are plotted. C) HEK293T cells were transfected with plasmids containing C-terminal FLAG-tagged WT, L13G, Y17H, I120T or R197X cDNA, R197X cDNA with FLAG-coding sequences inserted in-between amino acid positions 196 and 197 (R197X-FLAG), or plasmids encoding C-terminal FLAG-tagged a.a. 1-272 or aa. 273-544 DBR1. The cell lysates were analyzed for western blotting with an anti-DBR1 pAb and an anti-FLAG monoclonal antibody. D) Debranching activity of HEK293T cell lysates with and without transfection with various DBR1 constructs. E) DBR1 protein levels, as assessed by western blotting, in SV40-fibroblasts (upper panel) from healthy controls (C) and patients with biallelic DBR1 mutations (I120T/I120T for P1, Y17H/Y17H for P5 and P6). DBR1 protein levels in EBV-B cells (lower panel) from healthy controls, P1 and P2 with homozygous I120T DBR1 mutations. F) DBR1 protein and mRNA levels, as assessed by western blotting (upper panel) and RT-qPCR (lower panel), respectively, in SV40-fibroblasts from a healthy control, from P1 with and without stable transfection with a pTRIP-RFP vector without DBR1 cDNA, or with WT or mutant DBR1 cDNA. NT: non-transfected, Luci: luciferase plasmid. In C), E) and F), the internal expression control was GAPDH. Each experiment shown in E–F is representative of at least three independent experiments. See also Figure S3.
Figure 3
Figure 3. AR partial DBR1 deficiency leads to intronic RNA lariat accumulation in patient fibroblasts
A) Schematic representation of DBR1 activity in intronic lariat RNA debranching. B) Lariat branchpoint-traversing read counts, obtained from total RNA-Seq data with the lariat read-count method and normalized against hg19 mapped read pairs, for three healthy controls, P1, P5, P6, and TLR3−/− and STAT1−/− patients. Each dot represents one technical replicate for one sequenced sample. C) An analysis of DBR1 specificity for branchpoint nucleotide composition. Pie charts depicting the ratio of ‘A’, ‘C’, ‘G’, and ‘U’ branchpoints in recovered branchpoint-traversing reads. Chi-square test was performed to compare the proportion of ‘A’ branchpoints to non-‘A’ branchpoints in aggregated control versus patient samples (p<0.0001). D) ID1 and DKK1 RNA lariat read counts, obtained from total RNA-Seq data by the LaSSO method and normalized against unmapped singlets, for three healthy controls, and three patients. E) mRNA (left panels) and intronic lariat levels (right panels) for ID1 (upper panels) and DKK1 (lower panels), measured by RT-qPCR, in SV40-fibroblasts from healthy controls, P1, P5, P6, and TLR3−/− and STAT1−/− patients. F) Intronic lariat levels for ID1 (upper panel) and DKK1 (lower panel), measured by RT-qPCR, in SV40-fibroblasts from healthy controls, fibroblasts from P1 with and without stable transfection with the pTRIP-RFP vector without the insertion of DBR1 cDNA, or expressing WT or mutant DBR1. NT: non-transfected, Luci: luciferase plasmid. In E and F, each dot represents one technical replicate, from three independent experiments. In B–F), * p<0.05, ** p<0.01, *** p<0.001, **** p<0.0001. See also Figure S3.
Figure 4
Figure 4. Intact TLR3- and IFN-responsive pathways, and very high RNA lariat levels in DBR1-deficient fibroblasts following HSV1 infection
A) Principal component analysis (PCA) of RNA-Seq-quantified gene expression in primary fibroblasts from three healthy controls, three DBR1-mutated patients (P1, P5 and P6), one TLR3−/− and one STAT1−/− patient. Cells were mock-treated, stimulated with 25 μg/ml poly(I:C) for 6 hours, or stimulated with 100 IU/ml IFN-α2b for 8 hours. B) Heatmaps of RNA-Seq-quantified gene expression (z-score scaled log2 read counts per million, cpm) in primary fibroblasts from healthy controls, DBR1-mutated patients, TLR3−/− and STAT1−/− patients, with stimulations as described in A). Each heatmap includes genes differentially expressed (FDR 0.01, > 2-fold difference) in response to the indicated stimulus relative to mock-treated samples in the healthy control or DBR1-mutated groups. Hierarchical clustering (complete method) on Euclidean distance values. C) Lariat branchpoint-traversing read counts, obtained with the lariat read-count method and normalized against hg19 mapped read pairs, for primary fibroblasts with or without stimulation with poly(I:C) or IFN-α2b as described in A), or 24 hours of infection with HSV1, for three healthy controls (C), three DBR1-mutated patients, and TLR3−/− and STAT1−/− patients. We performed t-tests to compare intronic RNA lariat levels in samples from patients or healthy controls after infection with HSV1 with the corresponding uninfected samples (p<0.0001 in each case). **** p<0.0001. D) An analysis of DBR1 specificity in ‘A’, ‘C’, ‘G’, and ‘U’ branchpoint nucleotide composition, for primary fibroblasts with or without 24 hours of infection with HSV1, for controls (C) and patients. Chi-square test was used to compare the proportion of ‘A’ to non-‘A’ branchpoints in aggregated control versus patient samples after infection with HSV1 (p<0.0001). E) Distribution of intronic read density enrichment for three healthy controls versus three DBR1-mutated patients, in the absence of infection (top) and after HSV1 infection (bottom). See also Figure S4–5.
Figure 5
Figure 5. Enhanced viral susceptibility in DBR1-deficient fibroblasts
A,B) Levels of VSV and HSV1 replication, at various time points, following infection with VSV at a MOI of 1, or a MOI of 0.01 for HSV1-GFP, as measured in the TCID50 assay and GFP intensity assay, respectively, in SV40-fibroblasts from healthy controls (C1, C2), P1, P5 and P6, and TLR3−/− and STAT1−/− patients. NI: not infected. C,D) Viability of SV40-fibroblasts following 24 hours of infection with VSV or 72 hours of infection with HSV1, at various MOI, in cells from healthy controls, P1, P5 and P6, and TLR3−/− or STAT1−/− patients. T-tests were performed to compare the virus levels or cell viability in samples from patients with that from healthy controls for the latest point during the time course (A,B) or the highest MOI tested (C,D) (p<0.05 in D, p<0.01 in each other case). E) HSV1-GFP replication levels, as assessed on the basis of GFP intensity, in SV40-fibroblasts from healthy controls, from P1 with and without stable transfection with the pTRIP-RFP vector without the insertion of DBR1 cDNA, or expressing WT or mutant DBR1, following 24, 48 and 72 hours of infection with HSV1-GFP at a MOI of 0.01. F) HSV1 replication levels, as assessed in the TCID50 assay, in SV40-fibroblasts from healthy controls, from P1 with and without stable transfection with the pTRIP-RFP vector without the insertion of DBR1 cDNA, or expressing WT DBR1, following 24, 48 and 72 hours of infection with HSV1 at a MOI of 0.01. Mean values from at least three independent experiments are shown in each panel of A–F. See also Figure S6.

References

    1. Abecasis GR, Cherny SS, Cookson WO, Cardon LR. Merlin--rapid analysis of dense genetic maps using sparse gene flow trees. Nat Genet. 2002;30:97–101. - PubMed
    1. Adzhubei I, Schmidt S, Peshkin L, Ramensky VE, Gerasimova A, Bork P, Kondrashov AS, Sunyaev SR. A method and server for predicting damaging missense mutations. Nat Methods. 2010;7:248–249. - PMC - PubMed
    1. Anders S, Pyl PT, Huber W. HTSeq--a Python framework to work with high-throughput sequencing data. Bioinformatics. 2015;31:166–169. - PMC - PubMed
    1. Andersen LL, Mork N, Reinert LS, Kofod-Olsen E, Narita R, Jorgensen SE, Skipper KA, Honing K, Gad HH, Ostergaard L, et al. Functional IRF3 deficiency in a patient with herpes simplex encephalitis. J Exp Med. 2015;212:1371–1379. - PMC - PubMed
    1. Armakola M, Higgins MJ, Figley MD, Barmada SJ, Scarborough EA, Diaz Z, Fang X, Shorter J, Krogan NJ, Finkbeiner S, et al. Inhibition of RNA lariat debranching enzyme suppresses TDP-43 toxicity in ALS disease models. Nat Genet. 2012;44:1302–1309. - PMC - PubMed

Publication types

MeSH terms