Review
. 2018 Feb 23;16(1):23.
doi: 10.1186/s12915-018-0494-7.

Measuring behavior across scales

Affiliations
Review

Measuring behavior across scales

Gordon J Berman. BMC Biol. .

Abstract

The need for high-throughput, precise, and meaningful methods for measuring behavior has been amplified by our recent successes in measuring and manipulating neural circuitry. The largest challenges associated with moving in this direction, however, are not technical but are instead conceptual: what numbers should one put on the movements an animal is performing (or not performing)? In this review, I will describe how theoretical and data analytical ideas are interfacing with recently-developed computational and experimental methodologies to answer these questions across a variety of contexts, length scales, and time scales. I will attempt to highlight commonalities between approaches and areas where further advances are necessary to place behavior on the same quantitative footing as other scientific fields.


Conflict of interest statement

Competing interests

The author declares no competing interests.

Publisher’s Note

Springer Nature remains neutral with regard to jurisdictional claims in published maps and institutional affiliations.

Figures

Fig. 1.
Fig. 1.
Approaches for identifying stereotyped movements. a Representation of all of the movements an animal could theoretically make. For instance, each line could be the dynamics of two joint angles, say, the bending of a knee and an ankle, or another set of postural variables over time. Although an animal could potentially move with any of these postural trajectories, many of the motions here would be only rarely performed. b How we observe most animals to move. Specifically, they use a relatively small portion of their potential behavioral repertoire (stereotyped behaviors, colored lines) along with a few instances of less-commonly-observed ones (non-stereotyped behaviors, black lines). c One way to isolate stereotyped behaviors is to break-up the observed trajectories into clusters (denoted by dashed lines). d An alternate means of identifying stereotyped behaviors is to transform the dynamics in such a way that, for instance, each time one of the trajectories in b is performed, a dot is placed using a low-dimensional embedding to a different space. Similar trajectories are mapped near each other (dots), and stereotyped behaviors could be identified as peaks in the density contours (lines) of this map
Fig. 2.
Fig. 2.
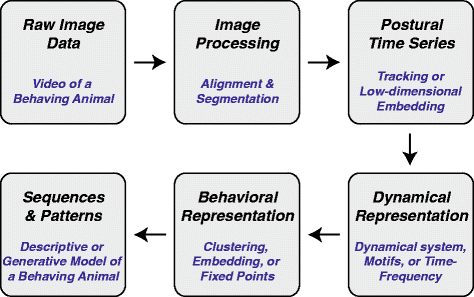
Archetypical data analysis pipeline for identifying stereotyped behaviors automatically from data
Fig. 3.
Fig. 3.
Examples of postural representations. a A schematic for how posture is typically represented by assigning body frame coordinates, here for a fruit fly. This assignment is usually created from manual tracking or machine vision techniques. b Using variations in the tracked centerline of the nematode C. elegans (left) to find a set of postural modes (right). Here, principal components analysis is used to find a set of postural modes, or “eigenworms,” where the original centerline can be largely reconstructed through a linear combination of these centerline variations (adapted from [54]). c In cases where tracking is not feasible due to occlusions, high-dimensionality, and/or large data sets, an alternative approach has been to use image compression to find postural modes, such as those seen in the fly images here (adapted from [53]). Here, red and blue represent positive and negative eigenvector magnitudes, respectively, that are the result of concentrating as much of the data’s variance in as few directions as possible. The original image can be reconstructed via a linear combination of all the modes plus an overall mean, and time series can be generated by observing sequential images’ projections onto these postural modes
Fig. 4.
Fig. 4.
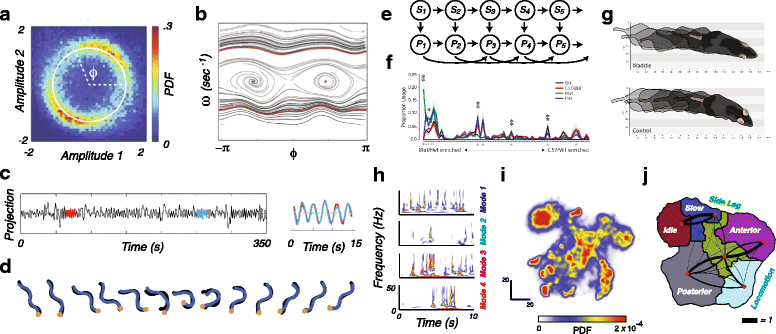
Examples of dynamical and behavioral representations. a For C. elegans, a histogram of projections onto the first two postural modes, or “eigenworms” (the left two curves in Fig. 3b) shows a low-dimensional structure that can be parameterized by a single phase variable, ϕ. b Fitting the dynamics of this variable to a deterministic dynamical system yields this phase map, with forward and backward locomotion naturally emerging as traveling wave trajectories at the top and bottom, respectively, and two fixed points in the middle corresponding to two different pause states (a and b are adapted from [54]). c An alternative approach to represent C. elegans behavior is via motif-finding. Here, time-series of projections onto the eigenworms are scoured for repeated patterns (e.g. the blue and red curves here). These patterns are then catalogued and used as the basis for a behavioral representation (adapted from [55]). d Instead of using dynamical motifs directly, the worm’s behavior can be captured as a sequence of postures, as seen in this example from [77]. e The approach taken by [56] was to fit an autoregressive hidden markov model (AR-HMM) to postural data of mouse movements, generated in a similar, but not identical, manner to that seen in Fig. 3c. Here, each Pt is a vector of the animal’s postural mode values at time t, and St is an underlying state that affects the dynamics of postural outputs. Here, arrows imply direct dependence (i.e. Pt is a stochastic function of St, Pt−1, and Pt−2, and so on). It is assumed that the time scale for changes in P is much faster than that for changes in S. This latter time scale, a parameter in the model, sets the distribution for the length of time that an animal stays within a particular behavioral state. f Average behavioral usage frequencies using an AR-HMM for four different mouse genotypes: Wild type, C57/BL6, as well as homozygous (Mut) and heterozygous (Het) mutations in the retinoid-related orphan receptor 1 β (Ror1 β) gene. g Distinct walking gaits found in the Mut (top) and C57/BL6 (bottom) mice (e-g adapted from [56]. Neuron 88(6), Alexander B. Wiltschko, Matthew J. Johnson, Giuliano Iurilli, Ralph E. Peterson, Jesse M. Katon, Stan L. Pashkovski, Victoria E. Abraira, Ryan P. Adams, Sandeep Robert Datta, Mapping Sub-Second Structure in Mouse Behavior, 1121-1135., Copyright 2015, reprinted with permission from Elsevier.) h An example of a time-frequency analysis representation from freely-moving fruitflies, where each set of axes represents a mode, and the colormap values indicate the continuous wavelet transform amplitudes for at each point in time. This approach allows for multiple time scales to enter the dynamical representation. i Probability density resulting from embedding points into 2-d such that two instances when a fruit fly is moving similar parts of its body at similar speeds are mapped nearby. Note the peaks and valleys. Here, the peaks represent stereotyped behaviors. j Break-down of the behavioral representation in i, with names for the behaviors within each of these regions manually labelled. Black lines are proportional to the transition probability between moving from one coarse region to another, with right-handedness implying the direction of transmission. (h-j adapted from [53, 76])

References

    1. Anderson DJ, Perona P. Toward a Science of Computational Ethology. Neuron. 2014;84(1):18–31. - PubMed
    1. Krakauer JW, Ghazanfar AA, Gomez-Marin A, Maciver MA, Poeppel D. Neuroscience Needs Behavior: Correcting a Reductionist Bias. Neuron. 2017;93(3):480–90. - PubMed
    1. Wang XJ, Krystal JH. Computational psychiatry. Neuron. 2014;84(3):638–54. - PMC - PubMed
    1. Lebedev MA, Nicolelis MAL. Brain-Machine Interfaces: From Basic Science to Neuroprostheses and Neurorehabilitation. Physiol Rev. 2017;97(2):767–837. - PubMed
    1. Anderson PW. More Is Different. Science. 1972;177(4047):393–6. - PubMed

Publication types