. 2018 Feb 23;6(1):e11.
doi: 10.2196/medinform.8960.

Characterizing and Managing Missing Structured Data in Electronic Health Records: Data Analysis

Affiliations

Characterizing and Managing Missing Structured Data in Electronic Health Records: Data Analysis

Brett K Beaulieu-Jones et al. JMIR Med Inform. .

Abstract

Background: Missing data is a challenge for all studies; however, this is especially true for electronic health record (EHR)-based analyses. Failure to appropriately consider missing data can lead to biased results. While there has been extensive theoretical work on imputation, and many sophisticated methods are now available, it remains quite challenging for researchers to implement these methods appropriately. Here, we provide detailed procedures for when and how to conduct imputation of EHR laboratory results.

Objective: The objective of this study was to demonstrate how the mechanism of missingness can be assessed, evaluate the performance of a variety of imputation methods, and describe some of the most frequent problems that can be encountered.

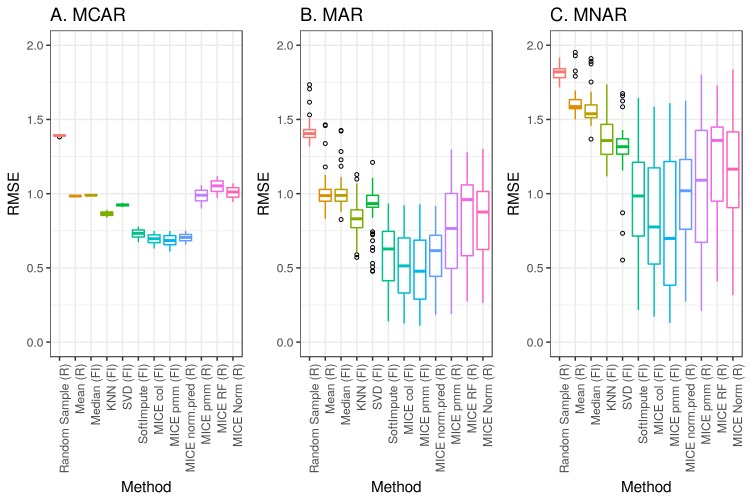
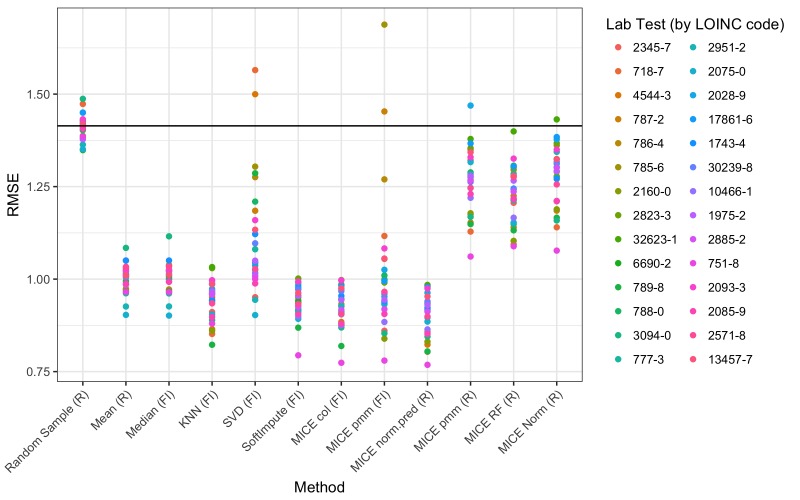
Methods: We analyzed clinical laboratory measures from 602,366 patients in the EHR of Geisinger Health System in Pennsylvania, USA. Using these data, we constructed a representative set of complete cases and assessed the performance of 12 different imputation methods for missing data that was simulated based on 4 mechanisms of missingness (missing completely at random, missing not at random, missing at random, and real data modelling).

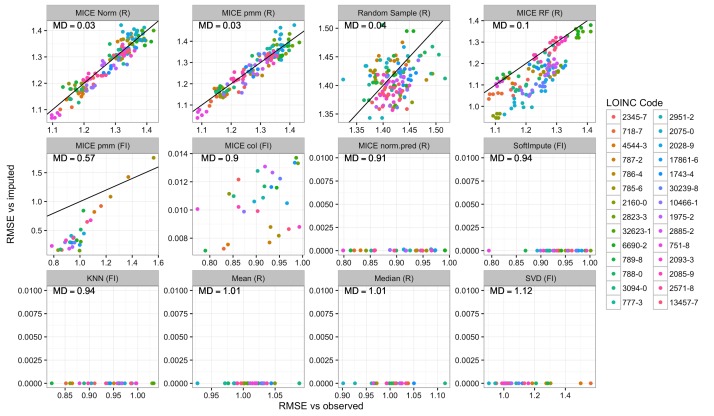
Results: Our results showed that several methods, including variations of Multivariate Imputation by Chained Equations (MICE) and softImpute, consistently imputed missing values with low error; however, only a subset of the MICE methods was suitable for multiple imputation.

Conclusions: The analyses we describe provide an outline of considerations for dealing with missing EHR data, steps that researchers can perform to characterize missingness within their own data, and an evaluation of methods that can be applied to impute clinical data. While the performance of methods may vary between datasets, the process we describe can be generalized to the majority of structured data types that exist in EHRs, and all of our methods and code are publicly available.

Keywords: clinical laboratory test results; electronic health records; imputation; missing data.


Conflict of interest statement

Conflicts of Interest: None declared.

Figures

Figure 1
Figure 1
Two general paradigms are commonly used to describe missing data. Missing data are considered ignorable if the probability of observing a variable has no relation to the value of the observed variable and are considered nonignorable otherwise. The second paradigm divides missingness into 3 categories: missing completely at random (MCAR: the probability of observing a variable is not dependent on its value or other observed values), missing at random (MAR: the probability of observing a variable is not dependent on its own value after conditioning on other observed variables), and missing not at random (MNAR: the probability of observing a variable is dependent on its value, even after conditioning on other observed variables). The x-axis indicates the extent to which a given value being observed depends on other values of other observed variables. The y-axis indicates the extent to which a given value being observed depends on its own value.
Figure 2
Figure 2
Summary of missing data across 143 clinical laboratory measures. (A) After ranking the clinical laboratory measures by the number of total results, the percentage of patients missing a result for each test was plotted (red points). At each rank, the percentage of complete cases for all tests of equal or lower rank were also plotted (blue points). Only variables with a rank ≤75 are shown. The vertical bar indicates the 28 tests that were selected for further analysis. (B) The full distribution of patient median ages is shown in blue, and the fraction of individuals in each age group that had a complete set of observations for tests 1-28 are shown in red. (C) Within the 28 laboratory tests that were selected for imputation analyses, the mean number of missing tests is depicted as a function of age. (D) Within the 28 laboratory tests that were selected for imputation, the mean number of missing tests is depicted as a function of body mass index (BMI). (E) Accuracy of a random forest predicting the presence or absence of all 143 laboratory tests. AUROC: area under the receiver operating characteristic curve. (F) Accuracy of a random forest predicting the presence or absence of the top 28 laboratory tests, by Logical Observation Identifiers Names and Codes (LOINC).
Figure 3
Figure 3
Area under the receiver operating characteristic curve (AUROC) of a random forest predicting whether data will be present or missing. (A) Missing completely at random simulation. (B) Missing at random simulation. (C) Missing not at random simulation.
Figure 4
Figure 4
Imputation accuracy measured by root mean square error (RMSE) across simulations 1-3. (A) Missing completely at random (MCAR). (B) Missing at random (MAR). (C) Missing not at random (MNAR). FI: fancyimpute; KNN: k-nearest neighbors; MICE: Multivariate Imputation by Chained Equations; pmm: predictive mean matching; RF: random forest; SVD: singular value decomposition.
Figure 5
Figure 5
Imputation root mean square error (RMSE) for a subset of 10,000 patients from simulation 4. A total of 12 imputation methods were tested (x-axis), and each color corresponds to a Logical Observation Identifiers Names and Codes (LOINC) code. The black line shows the theoretical error from random sampling. FI: fancyimpute; KNN: k-nearest neighbors; MICE: Multivariate Imputation by Chained Equations; pmm: predictive mean matching; RF: random forest; SVD: singular value decomposition.
Figure 6
Figure 6
Assessment of multiple imputation for each method. Using simulation 4, missing values were imputed multiple times with each method. The x-axes show the root mean square error (RMSE) between the imputed data and the observed values. The y-axes show the RMSE between multiple imputations of the same data. The axis scales vary between panels to better show the range of variation. The laboratory tests are indicated by the color of the points. The black diagonal line represents unity (y=x). Panels are ordered by each method’s mean deviation (MD) from unity, indicated in the top left corner of each panel. In the last 7 panels, the unity line is not visible because the variation between multiple imputations was close to zero. FI: fancyimpute; KNN: k-nearest neighbors; MICE: Multivariate Imputation by Chained Equations; pmm: predictive mean matching; RF: random forest; SVD: singular value decomposition.

References

    1. Steinbrook R. Health care and the American Recovery and Reinvestment Act. N Engl J Med. 2009 Mar 12;360(11):1057–60. doi: 10.1056/NEJMp0900665. - DOI - PubMed
    1. Flintoft L. Disease genetics: phenome-wide association studies go large. Nat Rev Genet. 2014 Jan;15(1):2. doi: 10.1038/nrg3637. - DOI - PubMed
    1. Wells BJ, Chagin KM, Nowacki AS, Kattan MW. Strategies for handling missing data in electronic health record derived data. EGEMS (Wash DC) 2013;1(3):1035. doi: 10.13063/2327-9214.1035. http://europepmc.org/abstract/MED/25848578 - DOI - PMC - PubMed
    1. Bounthavong M, Watanabe JH, Sullivan KM. Approach to addressing missing data for electronic medical records and pharmacy claims data research. Pharmacotherapy. 2015 Apr;35(4):380–7. doi: 10.1002/phar.1569. - DOI - PubMed
    1. Bhaskaran K, Smeeth L. What is the difference between missing completely at random and missing at random? Int J Epidemiol. 2014 Aug;43(4):1336–9. doi: 10.1093/ije/dyu080. http://europepmc.org/abstract/MED/24706730 - DOI - PMC - PubMed