Comparative Study
. 2018 Jun;67(6):1079-1085.
doi: 10.2337/db17-1028. Epub 2018 Feb 23.

Sleeve Gastrectomy Improves Glycemia Independent of Weight Loss by Restoring Hepatic Insulin Sensitivity

Affiliations
Comparative Study

Sleeve Gastrectomy Improves Glycemia Independent of Weight Loss by Restoring Hepatic Insulin Sensitivity

Samir Abu-Gazala et al. Diabetes. 2018 Jun.

Abstract

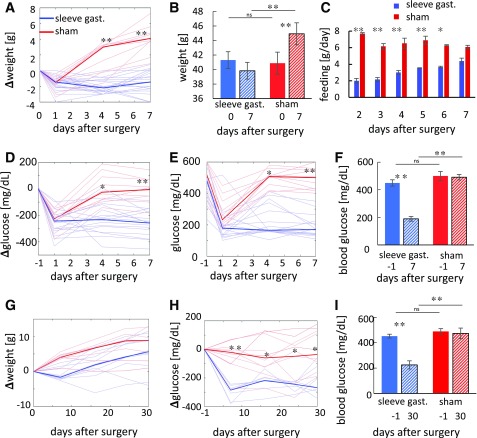
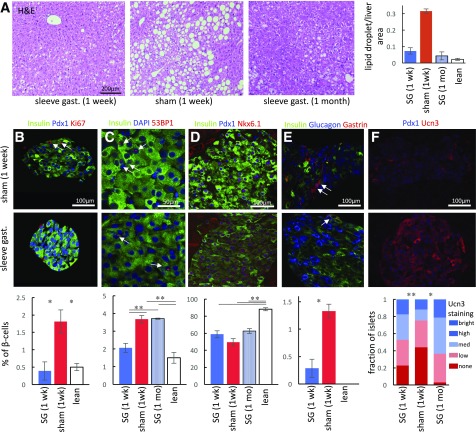
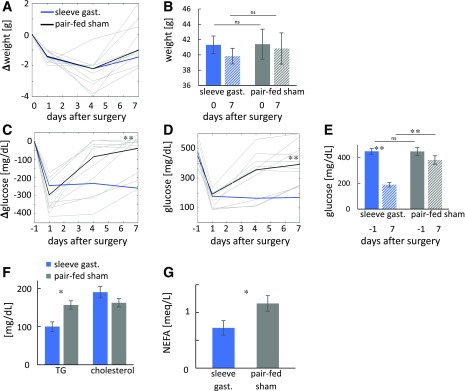
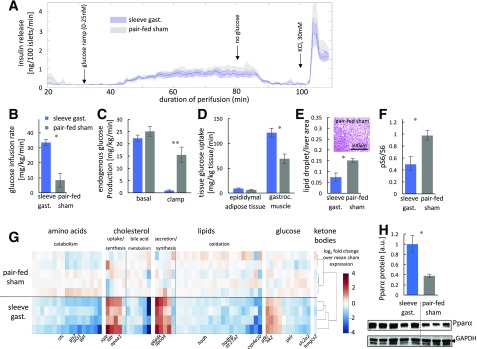
Bariatric surgery dramatically improves glycemic control, yet the underlying molecular mechanisms remain controversial because of confounding weight loss. We performed sleeve gastrectomy (SG) on obese and diabetic leptin receptor-deficient mice (db/db). One week postsurgery, mice weighed 5% less and displayed improved glycemia compared with sham-operated controls, and islets from SG mice displayed reduced expression of diabetes markers. One month postsurgery SG mice weighed more than preoperatively but remained near-euglycemic and displayed reduced hepatic lipid droplets. Pair feeding of SG and sham db/db mice showed that surgery rather than weight loss was responsible for reduced glycemia after SG. Although insulin secretion profiles from islets of sham and SG mice were indistinguishable, clamp studies revealed that SG causes a dramatic improvement in muscle and hepatic insulin sensitivity accompanied by hepatic regulation of hepatocyte nuclear factor-α and peroxisome proliferator-activated receptor-α targets. We conclude that long-term weight loss after SG requires leptin signaling. Nevertheless, SG elicits a remarkable improvement in glycemia through insulin sensitization independent of reduced feeding and weight loss.


Figures

Figure 1
Figure 1
Weight and glucose levels in SG- and sham-operated mice. AF: Weight and random glucose levels of SG- (n = 15–20) and sham-operated (n = 11) mice 1 week after surgery. Glucose and weight were measured on days 1, 4, and 7 after surgery. A: Change in weight in SG- and sham-operated mice relative to the weight at time of surgery. Median weight shown in dark colors and individual weight in light colors. B: Average weight of mice on the day of surgery and 7 days after surgery. C: Mean food consumption per mouse in the days after surgery. D: Change in nonfasting glucose levels compared with the day before surgery. Colors as in A. E: Glucose levels at the day before surgery and after surgery. Colors as in A. F: Mean glucose levels at the day before surgery and 7 days after surgery. GI: Weight and nonfasting glucose levels of SG- and sham-operated mice 30 days after surgery. Glucose and weight were measured at days 1, 4, 7, 16, 24, and 30 (n = 8–11). G: Change in weight in SG- and sham-operated mice relative to weight at surgical time. Colors as in A. H: Change in nonfasting glucose levels compared with the day before surgery. Colors as in A. I: Mean nonfasting blood glucose levels at the day before surgery and 30 days after surgery. Error bars indicate SEM. *P < 0.05, **P < 0.01 by two-way ANOVA with Bonferroni-corrected Tukey honest significant difference test. gast., gastrectomy; ns, not significant.
Figure 2
Figure 2
Hepatic and pancreatic response to SG. A: Hematoxylin-eosin staining of liver section 1 week after SG (left) or sham surgery (middle) and 1 month after SG (right). Fractional area of lipid droplets in livers of operated mice shown on the right (n = 3–6). BF: Immunohistochemical staining of pancreata from sham-operated (top) and SG-operated (bottom) mice. Quantification of staining shown below the images (n = 5–7 mice). B: SG reduces β-cell proliferation back to levels seen in lean mice. Nuclear Ki67 staining marking proliferating cells shown with arrows. C: SG transiently reduces DNA damage in β-cells to levels seen in lean mice. Red foci indicate nuclei experiencing DNA damage (arrows). D: SG increases nuclear colocalization of the β-cell transcription factors Pdx1 and Nkx6.1. E: SG reduces the number of gastrin-expressing cells (arrows), marking stressed endocrine cells. Gastrin is not expressed in pancreatic islets of lean mice. F: SG increases the fraction of islets expressing high levels of Ucn3, marking functional islets. All images taken under the same settings. Quantification shows pooled islets from all mice because of high intramouse variability among islets. Error bars indicate SEM. *P < 0.05, **P < 0.01 by unpaired Student t test. gast., gastrectomy.
Figure 3
Figure 3
Glycemia is improved by SG- but not in pair-fed sham-operated db/db mice. AE: Weight and nonfasting glucose levels of SG-fed (n = 15–20) and pair-fed sham-operated mice (n = 9–15) 1 week after surgery. Glucose and weight were measured at days 1, 4, and 7. Data for SG-operated mice as in Fig. 1. A: Change in weight in SG- and pair-fed sham-operated mice relative to weight at surgical time. Median weight shown in dark colors and individual weight in light colors. B: Mean weight at day of surgery and 7 days after surgery. C: Change in nonfasting glucose levels compared with the day before surgery. Colors as in A. D: Glucose levels at the day before surgery and after surgery. Colors as in A. E: Mean glucose levels at the day before surgery and 7 days after surgery. F: Mean triglycerides (TG) and total cholesterol. G: NEFAs in SG- and pair-fed sham-operated mice (n = 4–5). *P < 0.05, **P < 0.01 by two-way ANOVA with Bonferroni-corrected Tukey honest significant difference test (AE) or Student t test (F and G). gast., gastrectomy; ns, not significant.
Figure 4
Figure 4
Dramatic improvement in insulin sensitivity by SG- but not in pair-fed sham-operated db/db mice. A: Insulin secretion rate from isolated islets of SG- and pair-fed sham-operated mice. A glucose ramp from 0 to 25 nmol/L was applied from 30 to 80 min after perifusion. KCl was added at 100 min. There was no difference between the two groups. Shades indicate SEM (n = 4, 4). BD: Mean glucose infusion rate (B), hepatic glucose production (C), and tissue glucose uptake (D) during a hyperinsulinemic-euglycemic clamp (n = 4, 5). E: Fractional area of lipid droplets in livers of SG- and pair-fed sham-operated mice (n = 4, 4). F: Quantification of the ratio of phosphorylated S6 (pS6) to total S6 by Western blot in SG- and pair-fed sham-operated mice (n = 4, 5). G: Heat map of log2 fold change in expression of differentially regulated genes (q < 0.05) from the livers of SG- or pair-fed sham-operated mice harvested after a hyperinsulinemic-euglycemic clamp. Expression was normalized to the mean of pair-fed sham-operated mice. Genes are grouped from amino acid metabolism (left) to cholesterol, lipid, and glucose metabolism (right). Selected individual key genes are shown at the bottom of the heat map. Unsupervised clustering accurately separated surgical groups (dendogram). H: Quantification of PPARα levels by Western blot in SG- and pair-fed sham-operated mice (n = 5, 3). Error bars indicate SEM. *P < 0.05, **P < 0.01 by unpaired Student t test. a.u., arbitrary unit; gast., gastrectomy; gastroc., gastrocnemius.

Comment in

References

    1. Rubino F, Nathan DM, Eckel RH, et al. .; Delegates of the 2nd Diabetes Surgery Summit . Metabolic surgery in the treatment algorithm for type 2 diabetes: a joint statement by international diabetes organizations. Diabetes Care 2016;39:861–877 - PubMed
    1. Perry RJ, Peng L, Cline GW, et al. . Mechanisms by which a very-low-calorie diet reverses hyperglycemia in a rat model of type 2 diabetes. Cell Metab 2018;27:210–217.e3 - PMC - PubMed
    1. Jackness C, Karmally W, Febres G, et al. . Very low-calorie diet mimics the early beneficial effect of Roux-en-Y gastric bypass on insulin sensitivity and β-cell function in type 2 diabetic patients. Diabetes 2013;62:3027–3032 - PMC - PubMed
    1. Ryan KK, Tremaroli V, Clemmensen C, et al. . FXR is a molecular target for the effects of vertical sleeve gastrectomy. Nature 2014;509:183–188 - PMC - PubMed
    1. Kucharczyk J, Nestoridi E, Kvas S, Andrews R, Stylopoulos N. Probing the mechanisms of the metabolic effects of weight loss surgery in humans using a novel mouse model system. J Surg Res 2013;179:e91–e98 - PubMed

Publication types

MeSH terms