. 2018 Apr;176(4):3081-3102.
doi: 10.1104/pp.17.00858. Epub 2018 Feb 23.

Time-Course Transcriptomics Analysis Reveals Key Responses of Submerged Deepwater Rice to Flooding

Affiliations

Time-Course Transcriptomics Analysis Reveals Key Responses of Submerged Deepwater Rice to Flooding

Anzu Minami et al. Plant Physiol. 2018 Apr.

Abstract

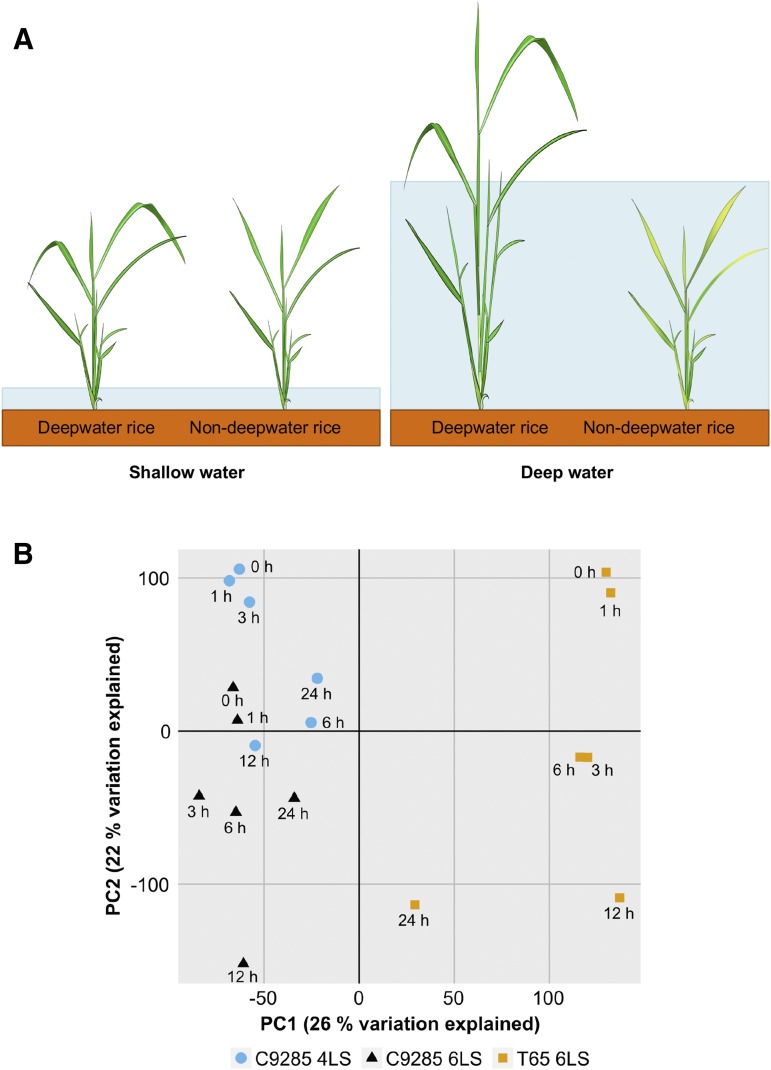
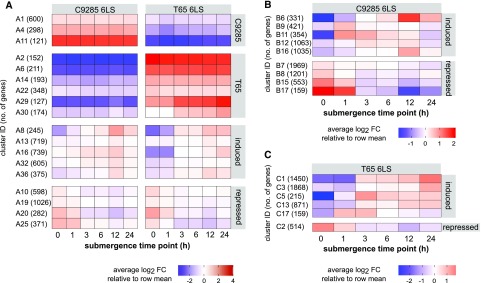
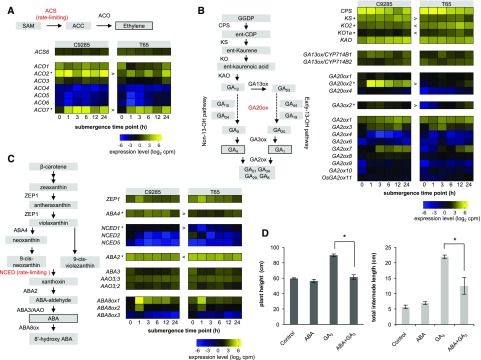
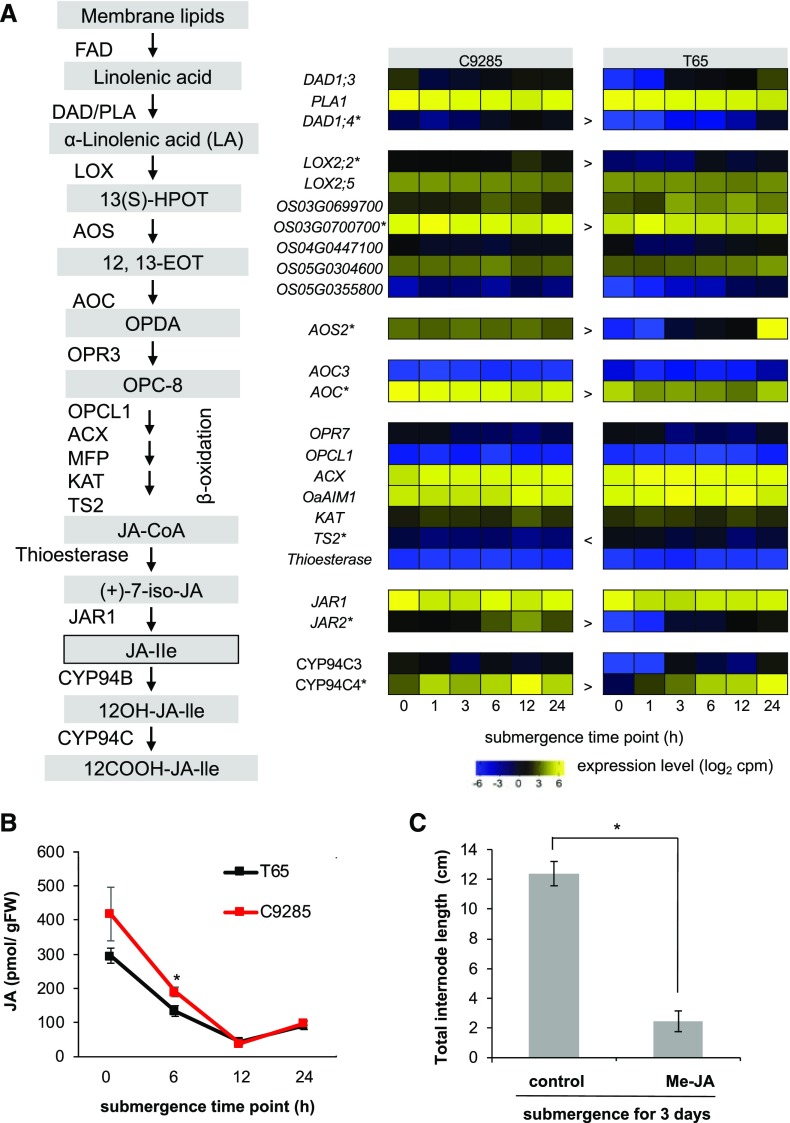
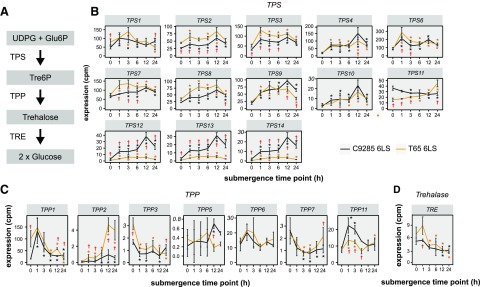
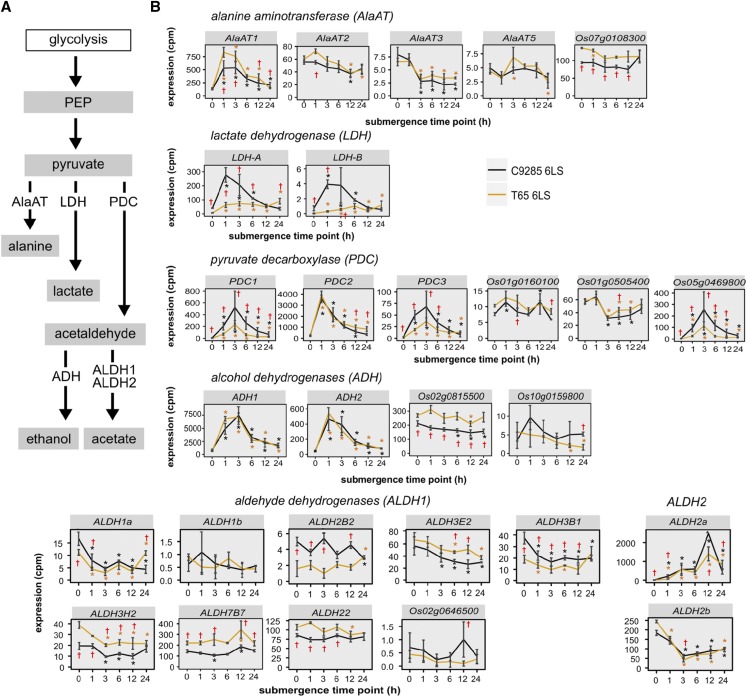
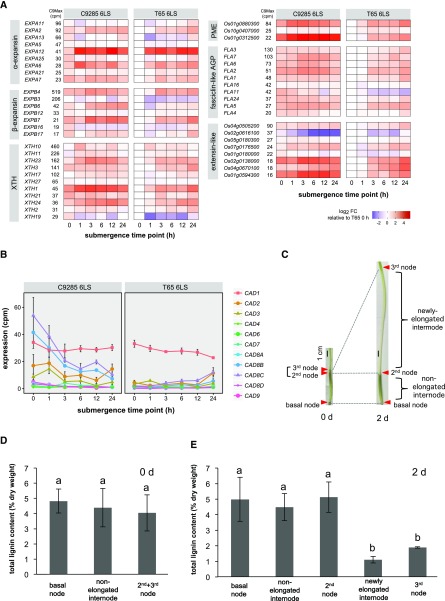
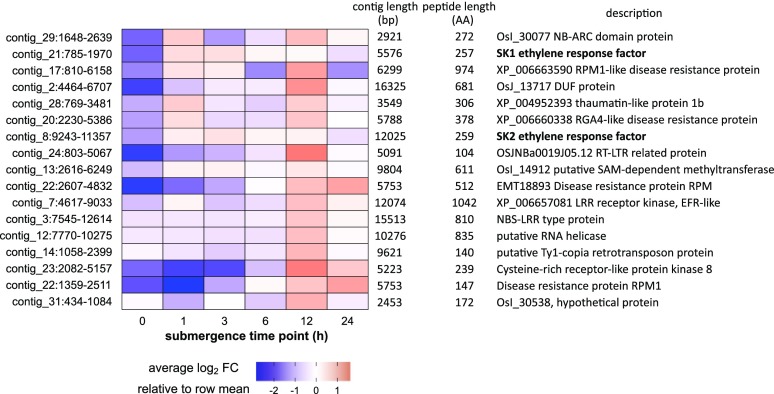
Water submergence is an environmental factor that limits plant growth and survival. Deepwater rice (Oryza sativa) adapts to submergence by rapidly elongating its internodes and thereby maintaining its leaves above the water surface. We performed a comparative RNA sequencing transcriptome analysis of the shoot base region, including basal nodes, internodes, and shoot apices of seedlings at two developmental stages from two varieties with contrasting deepwater growth responses. A transcriptomic comparison between deepwater rice cv C9285 and nondeepwater rice cv Taichung 65 revealed both similar and differential expression patterns between the two genotypes during submergence. The expression of genes related to gibberellin biosynthesis, trehalose biosynthesis, anaerobic fermentation, cell wall modification, and transcription factors that include ethylene-responsive factors was significantly different between the varieties. Interestingly, in both varieties, the jasmonic acid content at the shoot base decreased during submergence, while exogenous jasmonic acid inhibited submergence-induced internode elongation in cv C9285, suggesting that jasmonic acid plays a role in the submergence response of rice. Furthermore, a targeted de novo transcript assembly revealed transcripts that were specific to cv C9285, including submergence-induced biotic stress-related genes. Our multifaceted transcriptome approach using the rice shoot base region illustrates a differential response to submergence between deepwater and nondeepwater rice. Jasmonic acid metabolism appears to participate in the submergence-mediated internode elongation response of deepwater rice.


Figures

Figure 1.
Figure 1.
Submergence responses of deepwater rice and nondeepwater rice. A, Deepwater rice can survive and escape from submerged conditions by rapid elongation of stems (internodes) and leaves, while nondeepwater rice cannot elongate internodes during submergence. B, PCA of 18 RNA-Seq samples from cv C9285 and T65 submerged at different leaf stages and time points. A plot of all transcriptome samples along the first two principal components (PC1 and PC2) is shown. The percentage of variation explained is indicated at each axis. Colors indicate samples from different genotypes and leaf stages. Each data point represents averaged data from three independent time series, and one individual plant was sampled for each data point.
Figure 2.
Figure 2.
Clustering analysis of the transcriptomes of cv C9285 and T65 plants after submergence. Heat map representations of expression data from selected clusters in both cv C9285 and T65 at the 6LS (C9286 6LS and T65 6LS; A) and from clusters only in cv C9285 6LS (B) or cv T65 6LS (C) plants are shown. The clusters in the figure derived from Supplemental Data Set S1 were arranged manually. Rows represent clusters of genes generated by k-means clustering. Columns represent samples from different time points after submergence. Colors represent the average expression profile for each cluster, with red showing high expression and blue showing low expression. Before averaging within each cluster, the expression of each gene was normalized to its average expression across all samples and transformed to log2 values. Numbers on the left side of each heat map show the assigned cluster identifiers, and the number of genes in each cluster is in parentheses. The total number of clusters was k = 40 in A and k = 20 in B and C. FC, Fold change.
Figure 3.
Figure 3.
Ethylene, GA, and ABA metabolism during submergence. A to C, Schematic overviews of ethylene (A), GA (B), and ABA (C) metabolism alongside heat maps showing the expression of relevant genes. Each row represents one gene, columns represent samples from different time points after submergence, and colors represent gene expression levels as log2-transformed counts per million (cpm). Lower levels of expression are represented in blue and higher expression in yellow. AAO3, ABA-aldehyde oxidase; ABA8ox, ABA-8′ oxidase; CPS, copalyl-phosphate synthase; CYP714, cytochrome P714; GAXox, GAX oxidase; GGDP, geranyl-geranyl diphosphate; KAO, ent-kaurenoic acid oxidase; KO, ent-kaurene oxidase; KS, ent-kaurene synthase; NCED, 9-cis-epoxycarotenoid dioxygenase; ZEP1, zeaxanthin epoxidase1. Asterisks indicates genes with significant differences (false discovery rate < 0.05) at more than four time points between cv C9285 and T65 samples, and < and > indicate the direction of the difference relative to cv C9285. D, Effects of ABA and GA3 on plant height and total internode length. The cv C9285 4LS plants were grown in shallow water containing 10 µm GA3 and/or 10 µm ABA for 18 d. Bars represent averages of at least seven biological replicates, and error bars show se. Asterisks show significant differences (P < 0.05) between the indicated treatments as calculated by Student’s t tests.
Figure 4.
Figure 4.
JA metabolism during submergence. A, Schematic overview of JA metabolism alongside heat maps showing the expression of relevant genes. Each row represents one gene, columns represent samples from different time points after submergence, and colors represent gene expression levels as log2-transformed cpm. Lower levels of expression are represented in blue and higher expression in yellow. FDA, Fatty acid desaturase; DAD1, defective in anther dehiscence1; PLA, phospholipase A1; LOX, lipoxygenase; 13(S)-HPOT, 13(S)-hydroperoxyoctadecatrienoic acid; AOS, allene oxide synthase; 12,13-EOT, 12,13(S)-epoxy-octadecatrienoic acid; AOC, allene oxide cyclase; OPDA, cis-(+)-12-oxo-phytodienoic acid; OPR, 12-oxo-phytodienoic acid reductase; OPC-8, 3-oxo-2-(2′-pentenyl)-cyclopentane-1-octanoic acid; OPCL1, acyl-activating enzyme; ACX, acyl-CoA oxidase; MFP, multifunctional protein; KAT, 3-keto-acyl-CoA thiolase; TS2, tasselseed2; JA-CoA, jasmonoyl-CoA; (+)-7-iso-JA, (+)-7-iso-jasmonoyl; JAR1, jasmonate resistant1; JA-lle, (+)-7-iso-jasmonoly-l-Ile; CYP94, cytochrome P94. Asterisks indicate genes with significant differences (false discovery rate < 0.05) at more than four time points between cv C9285 and T65 samples, and < and > indicate the direction of the difference relative to cv C9285. B, Endogenous JA levels in the shoot base regions of cv C9285 and T65 plants during submergence for 24 h. Symbols represent averages of at least five biological replicates, and error bars represent se. The asterisk shows a significant difference (P < 0.05) between cv C9285 and T65 samples as calculated by Student’s t tests. FW, Fresh weight. C, JA inhibits internode elongation during submergence. The cv C9285 6LS plants were submerged under water containing 50 µm methyl jasmonate (Me-JA) for 3 d. Bars represent averages of at least 12 biological replicates, and error bars show se. The asterisk shows a significant difference (P < 0.05) between the indicated treatments as calculated by Student’s t tests.
Figure 5.
Figure 5.
Expression of trehalose metabolism-related genes during submergence. A, Schematic overview of the trehalose metabolic pathway. Glu-6P, Glc-6-P; UDPG, UDP-Glc. B to D, Expression of genes involved in trehalose metabolism during submergence in cv C9285 6LS (black) and cv T65 6LS (orange) plants at the indicated time points after submergence. Data points show expression levels as average cpm in three biological replicates, and error bars show sd. Black and orange asterisks indicate significant differences (P < 0.05) from 0 h at each time point for cv C9285 and T65 samples, respectively. Daggers indicate significant differences (false discovery rate < 0.05) between cv C9285 and T65 samples. P values were calculated using likelihood ratio tests and corrected for multiple testing by the Bonferroni-Holm method.
Figure 6.
Figure 6.
Expression of fermentation-related genes during submergence. A, Schematic overview of three fermentation pathways. B, Expression of genes related to fermentation during submergence in cv C9285 6LS (black) and cv T65 6LS (orange) plants at the indicated time points after submergence. Data points show expression levels as average cpm in three biological replicates, and error bars show sd. Graphs are arranged to reflect the different possibilities of anaerobic energy production. PEP, Phosphoenolpyruvate. Black and orange asterisks indicate significant differences (P < 0.05) from 0 h at each time point for cv C9285 and T65 samples, respectively. Daggers indicate significant differences (P < 0.05) between cv C9285 and T65 samples. P values were calculated using likelihood ratio tests and corrected for multiple testing by the Bonferroni-Holm method.
Figure 7.
Figure 7.
Effects of submergence on the expression of cell wall formation-related genes. A, Expression pattern of cell wall-related genes during 24 h of submergence. The gene expression levels in cv C9285 6LS and cv T65 6LS samples are indicated by log2 fold change (FC) at each time point (0, 1, 3, 12, and 24 h) relative to that of cv T65 samples before submergence. Genes with a maximal cpm value of more than 15 are shown. AGP, Arabinogalactan protein. B, Changes in expression of 11 CAD/SAD genes during submergence for 24 h. Data points show expression levels as average cpm in three biological replicates, and error bars show sd. C, Sampled regions of internodes for lignin quantification. The cv C9285 plants at the seven-leaf stage (7LS) that have already formed internodes were submerged for 2 d. Images of stems before (0 d) and after (2 d) submergence treatment of cv C9285 plants at the 7LS are shown. Red arrowheads indicate stem nodes. D and E, Lignin content in the nodes and internodes before (D) and after (E) 2 d of submergence of cv C9285 plants at 7LS. Bars represent averages of at least six biological replicates, and error bars represent se. Different letters indicate significant (P < 0.05) differences according to the Tukey-Kramer test.
Figure 8.
Figure 8.
Submergence-induced transcripts from cv C9285-unique loci. Expression from selected loci that are presumably absent in the IRGSP-1.0 reference genome is shown. Each row represents one locus, columns represent samples from different time points after submergence, and colors represent gene expression levels as log2-transformed cpm normalized to the average expression in all samples of different time points. Genes that have at least a 2-fold increase in expression after submergence in cv C9285 6LS plants are shown. Complete expression data from cv C9285-unique transcripts can be found in Supplemental Data Set S10, and sequence data are provided in Supplemental Data Sets S12 to S14. AA, Amino acids; FC, fold change.

Similar articles

Cited by

References

    1. Ayano M, Kani T, Kojima M, Sakakibara H, Kitaoka T, Kuroha T, Angeles-Shim RB, Kitano H, Nagai K, Ashikari M (2014) Gibberellin biosynthesis and signal transduction is essential for internode elongation in deepwater rice. Plant Cell Environ 37: 2313–2324 - PMC - PubMed
    1. Azuma T, Hirano T, Deki Y, Uchida N, Yasua T, Yamaguchi T (1995) Involvement of the decrease in levels of abscisic acid in the internodal elongation of submerged floating rice. J Plant Physiol 146: 323–328
    1. Bailey TL, Elkan C (1994) Fitting a mixture model by expectation maximization to discover motifs in biopolymers. Proc Int Conf Intell Syst Mol Biol 2: 28–36 - PubMed
    1. Bailey-Serres J, Voesenek LA (2008) Flooding stress: acclimations and genetic diversity. Annu Rev Plant Biol 59: 313–339 - PubMed
    1. Bailey-Serres J, Voesenek LA (2010) Life in the balance: a signaling network controlling survival of flooding. Curr Opin Plant Biol 13: 489–494 - PubMed

Publication types

MeSH terms

LinkOut - more resources