. 2018 Apr 6;293(14):5160-5171.
doi: 10.1074/jbc.RA117.001474. Epub 2018 Feb 23.

Hepatic loss of Lissencephaly 1 (Lis1) induces fatty liver and accelerates liver tumorigenesis in mice

Affiliations

Hepatic loss of Lissencephaly 1 (Lis1) induces fatty liver and accelerates liver tumorigenesis in mice

Xiaoling Li et al. J Biol Chem. .

Abstract

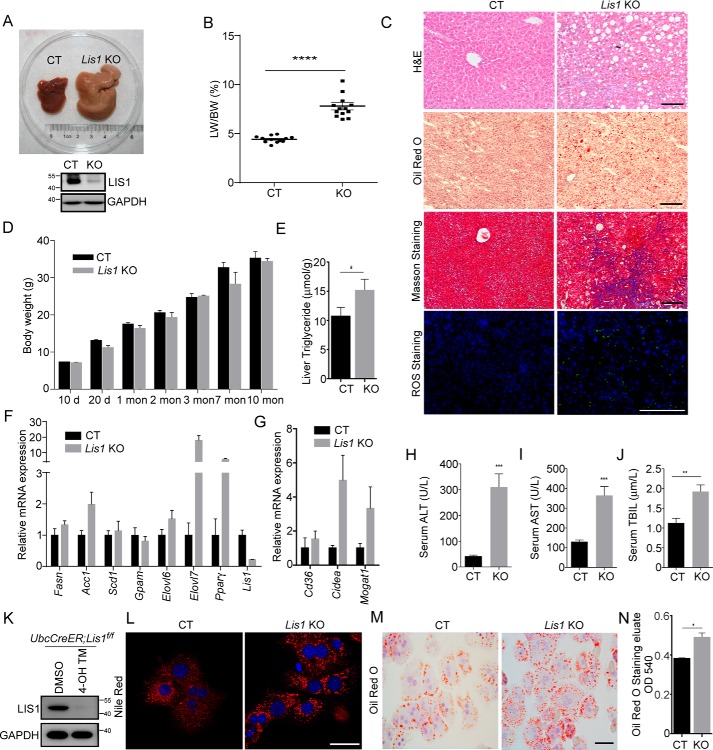
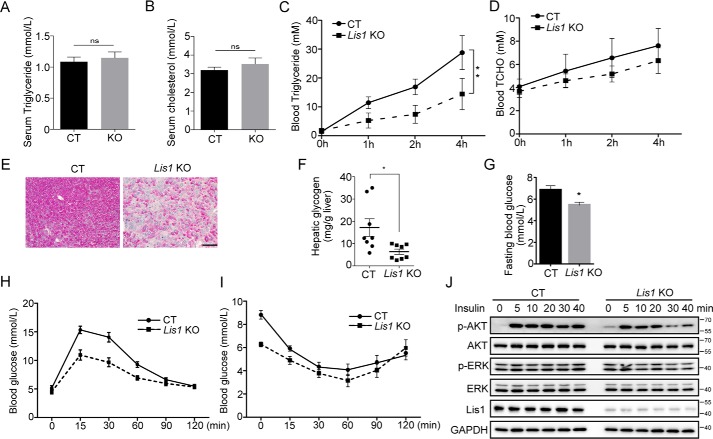
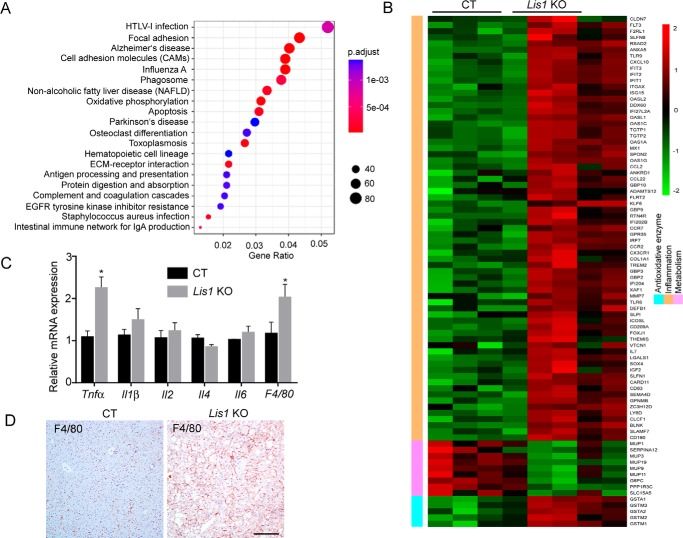
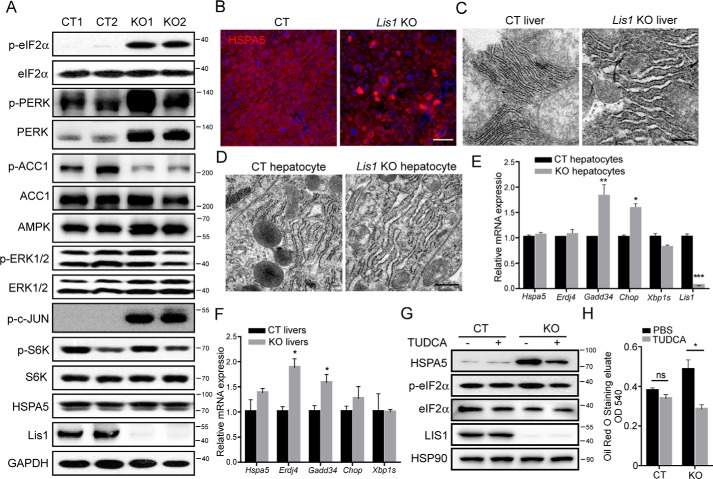
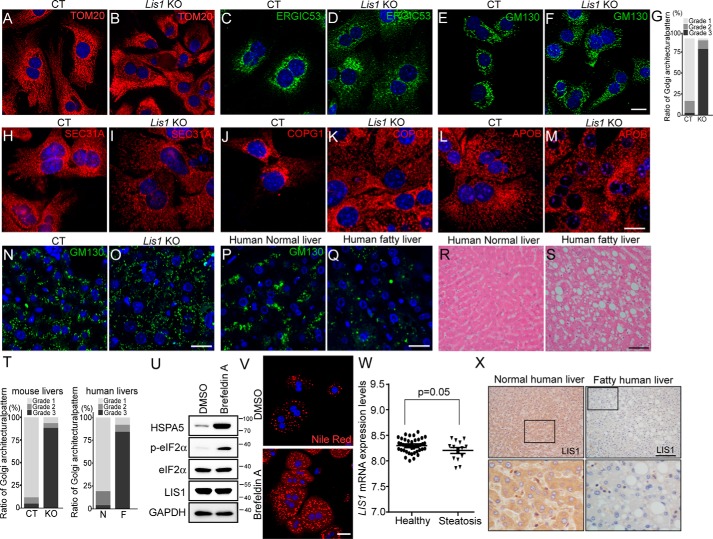
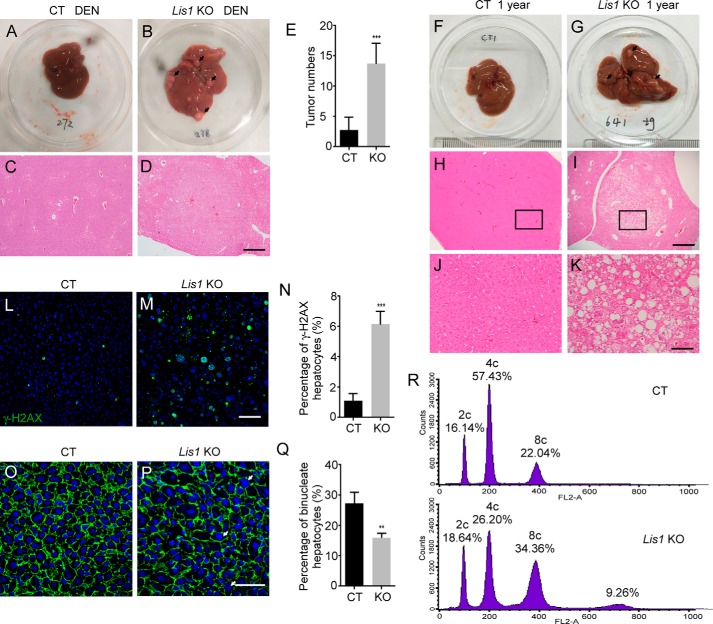
The liver is a major organ in lipid metabolism, and its malfunction leads to various diseases. Nonalcoholic fatty liver disease, the most common chronic liver disorder in developed countries, is characterized by the abnormal retention of excess lipid within hepatocytes and predisposes individuals to liver cancer. We previously reported that the levels of Lissencephaly 1 (LIS1, also known as PAFAH1B1) are down-regulated in human hepatocellular carcinoma. Following up on this observation, we found that genetic deletion of Lis1 in the mouse liver increases lipid accumulation and inflammation in this organ. Further analysis revealed that loss of Lis1 triggers endoplasmic reticulum (ER) stress and reduces triglyceride secretion. Attenuation of ER stress by addition of tauroursodeoxycholic acid (TUDCA) diminished lipid accumulation in the Lis1-deficient hepatocytes. Moreover, the Golgi stacks were disorganized in Lis1-deficient liver cells. Of note, the Lis1 liver-knockout mice exhibited increased hepatocyte ploidy and accelerated development of liver cancer after exposure to the liver carcinogen diethylnitrosamine (DEN). Taken together, these findings suggest that reduced Lis1 levels can spur the development of liver diseases from steatosis to liver cancer and provide a useful model for delineating the molecular pathways that lead to these diseases.

Keywords: Golgi; Lis1; endoplasmic reticulum stress (ER stress); hepatocyte; liver cancer; liver metabolism; mouse genetics; nonalcoholic fatty liver disease; ploidy; steatosis.


Conflict of interest statement

The authors declare that they have no conflicts of interest with the contents of this article

Figures

Figure 1.
Figure 1.
Liver-specific knockout of Lis1 results in fatty liver in mice. A, gross morphology of control (left) and Lis1 KO (right) mouse liver at 2 months. The Lis1 mutant displayed an enlarged liver. B, the ratio of liver weight (LW) to gross body weight (BW) of control and Lis1 KO mice at 2 months. C, stained sections of livers from control and Lis1 KO mice at 2 months with the indicated methods. Increased lipids, fibrosis, and ROS were observed in Lis1 KO livers. D, body weight of control and Lis1 KO mice at different ages. E, liver triglyceride quantification; n = 5. F, gene expression analysis by quantitative PCR showing increased lipogenesis in Lis1 KO livers; n = 4. G, gene expression analysis by quantitative PCR showing increased lipid uptake and storage in Lis1 KO livers; n = 4. H–J, quantifications of serum ALT (H), AST (I), and TBIL (J). Severe liver injury was observed in Lis1 KO mice. K, Western blotting analysis of UbcCreER;Lis1f/f hepatocytes treated with DMSO or 4-OH tamoxifen (4-OH TM) with the indicated antibodies. L, Nile Red staining of liver sections from control and Lis1 KO primary hepatocytes. Accumulation of lipids was found in primary hepatocytes in the absence of Lis1. M, Oil Red O staining of liver sections from control and Lis1 KO primary hepatocytes. N, relative amount of Oil Red O eluted from control and Lis1 KO primary hepatocytes was measured by spectrophotometer; n = 3 per group. The scale bars represent 100 μm in C, 10 μm in L, and 20 μm in M.
Figure 2.
Figure 2.
Triglyceride secretion and glucose homeostasis are disturbed in Lis1 KO mouse livers. A and B, quantification of serum triglyceride (A) and cholesterol (B) in 2-month-old control and Lis1 KO mice; n = 5. C and D, quantification of serum triglyceride (C) and cholesterol (D) in a VLDL-TG secretion assay performed in 2-month-old control and Lis1 KO mice; n = 5. VLDL-TG secretion was affected in Lis1 KO mice. E, PAS staining on the sections from control and Lis1 KO livers. Decrease in glycogen was detected by PAS staining. F, quantification of hepatic glycogen. Lis1 KO mice had reduced glycogen in the liver. G, quantification of fasting blood glucose levels; n = 5. H and I, the glucose tolerance test (H) and insulin tolerance test (I) were performed in 2-month-old control and Lis1 KO mice; n = 5. J, Western blot analysis of control and Lis1 KO primary hepatocytes treated with insulin for the indicated times. Phosphorylation of AKT was attenuated in Lis1 KO primary hepatocytes in response to insulin. The scale bar represents 100 μm in E.
Figure 3.
Figure 3.
RNA-Seq analysis of Lis1 KO livers. A, top pathways that were enriched in differentially expressed genes identified by RNA-Seq analysis in Lis1 KO livers compared with control livers. B, heat map analysis of the highly up-regulated (red) and down-regulated (green) metabolism, inflammatory and antioxidant genes in Lis1 KO livers compared with controls. C, quantitative PCR analysis of cytokines in control and Lis1 KO livers; n = 4. D, immunohistochemistry staining revealed increased macrophages in Lis1 KO livers by F4/80 antibody; n = 5.
Figure 4.
Figure 4.
Loss of Lis1 in mouse livers results in an elevated ER stress response in association with an enlarged ER size. A, Western blot analysis of control and Lis1 KO mouse livers at 2 months with the indicated antibodies. B, immunofluorescent analysis of livers from control and Lis1 KO mice with HSPA5 antibody. HSPA5 expression was substantially increased in 10% Lis1 KO hepatocytes. C, representative TEMs of 2-month-old control and Lis1 KO mouse livers. Enlarged ER was found in Lis1 KO hepatocytes. D, representative TEMs of control and Lis1 KO primary hepatocytes. E, quantitative PCR analysis in control and Lis1 KO primary hepatocytes; n = 4. F, quantitative PCR analysis in control and Lis1 KO livers at 3 months; n = 3. G, Western blot analysis of control and Lis1 KO primary hepatocytes with the indicated antibodies using the indicated treatment. p-eIF2α and HSPA5 expression was elevated after acute deletion of Lis1 in vitro. TUDCA treatment reduced the expression of p-eIF2α and HSPA5 in Lis1 KO hepatocytes. H, quantification of relative Oil Red O amount in primary control and Lis1 KO hepatocytes treated with DMSO or TUDCA; n = 3. The scale bars represent 100 μm in B, 500 nm in C and F.
Figure 5.
Figure 5.
Hepatocytes in Lis1 KO mouse and human fatty livers display diffused Golgi stacks. A–F, immunofluorescent staining of control and Lis1 KO primary hepatocytes with the indicated antibodies revealed the disorganization of mitochondria and Golgi stacks. G, quantification of the Golgi architectural changes in E and F. H–K, immunofluorescent staining with the indicated antibodies revealed the disorganization of COPII (H and I) and COPI (J and K) vesicles in Lis1 KO primary hepatocytes. L and M, immunofluorescent staining with APOB antibody revealed the abnormal distribution of APOB vesicles in Lis1 KO primary hepatocytes. N and O, immunofluorescent staining of control and Lis1 KO mouse livers with GM130 antibody. P and Q, immunofluorescent staining of human normal liver and fatty liver sections with GM130 antibody revealed disruption of normal Golgi structure in human fatty livers in vivo. R and S, H&E staining of human normal liver and fatty liver sections. T, quantifications of the architectural changes of the Golgi apparatus by GM130 staining in N–Q. N, normal human liver; F, fatty human liver. U, Western blotting analysis revealed elevated p-eIF2α expression in brefeldin A-treated primary hepatocytes. V, staining of primary hepatocytes using Nile Red revealed the accumulation of lipids in brefeldin A-treated cells. W, relative LIS1 mRNA levels in the livers of human healthy controls and NAFLD samples from data set GSE48452. X, immunohistochemistry staining of human normal and fatty liver sections with LIS1 antibody. LIS1 expression was reduced in human fatty livers. Higher magnification of boxed areas is shown in the lower panel. The scale bars represent 10 μm in A–F; 20 μm in H–M; 50 μm in N–Q; and 25 μm in V; and 100 μm in R, S, and X.
Figure 6.
Figure 6.
Lis1 regulates hepatocyte ploidy, genomic instability, and tumorigenesis in the liver. A and B, morphology of control and Lis1 KO mouse livers 6 months after DEN injection. Arrows indicate tumors. C and D, H&E staining of control and Lis1 KO mouse livers treated with DEN. E, quantification of tumor numbers from control and Lis1 KO mouse livers treated with DEN; n = 5. F and G, morphology of 1-year-old control and Lis1 KO mouse livers. Arrows indicate premalignant nodules. H and I, H&E staining of 1-year-old control and Lis1 KO mouse livers. J and K, higher magnification of H&E staining from the boxed areas in H and I, respectively. L and M, immunofluorescent staining of 2-month-old control and Lis1 KO livers with γH2AX antibody. Increased γH2AX positive hepatocytes were observed in Lis1 KO livers. N, quantification of γH2AX-positive hepatocytes in 2-month-old control and Lis1 KO livers; n = 5. O and P, immunofluorescent staining of livers with β-catenin antibody and DAPI from 2-month-old control and Lis1 KO mice. β-Catenin demarcates cell boundaries. Arrows indicate large nuclear in Lis1 KO hepatocytes. Q, quantification of the ratio of binucleate hepatocytes in 2-month-old control and Lis1 KO mice; n = 5. R, FACS analysis of the hepatocyte ploidy from 2-month-old control and Lis1 KO livers. Increased hepatocyte polyploidy was observed in Lis1 KO hepatocytes. The scale bars represent 500 μm in C, D, H, and I; 100 μm in J and K; 50 μm in L and M; and 25 μm in O and P.

References

    1. van den Berghe G. (1991) The role of the liver in metabolic homeostasis: implications for inborn errors of metabolism. J. Inherit. Metab. Dis. 14, 407–420 10.1007/BF01797914 - DOI - PubMed
    1. Browning J. D., and Horton J. D. (2004) Molecular mediators of hepatic steatosis and liver injury. J. Clin. Invest. 114, 147–152 10.1172/JCI200422422 - DOI - PMC - PubMed
    1. Cohen J. C., Horton J. D., and Hobbs H. H. (2011) Human fatty liver disease: old questions and new insights. Science 332, 1519–1523 10.1126/science.1204265 - DOI - PMC - PubMed
    1. Argo C. K., and Caldwell S. H. (2009) Epidemiology and natural history of non-alcoholic steatohepatitis. Clin. Liver Dis. 13, 511–531 10.1016/j.cld.2009.07.005 - DOI - PubMed
    1. Starley B. Q., Calcagno C. J., and Harrison S. A. (2010) Nonalcoholic fatty liver disease and hepatocellular carcinoma: a weighty connection. Hepatology 51, 1820–1832 10.1002/hep.23594 - DOI - PubMed

Publication types

MeSH terms