. 2018 Apr 13;293(15):5613-5623.
doi: 10.1074/jbc.RA118.001834. Epub 2018 Feb 23.

A chemical genetic approach to engineer phototropin kinases for substrate labeling

Affiliations

A chemical genetic approach to engineer phototropin kinases for substrate labeling

Jonathan Schnabel et al. J Biol Chem. .

Abstract

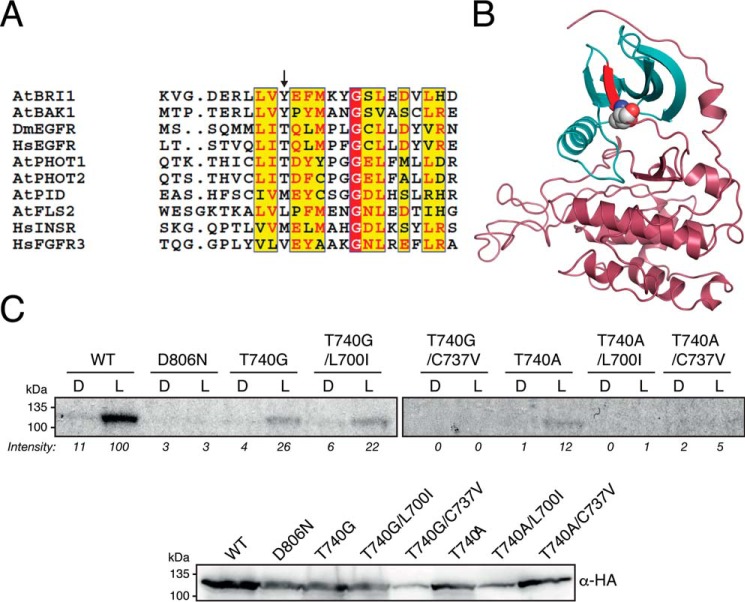
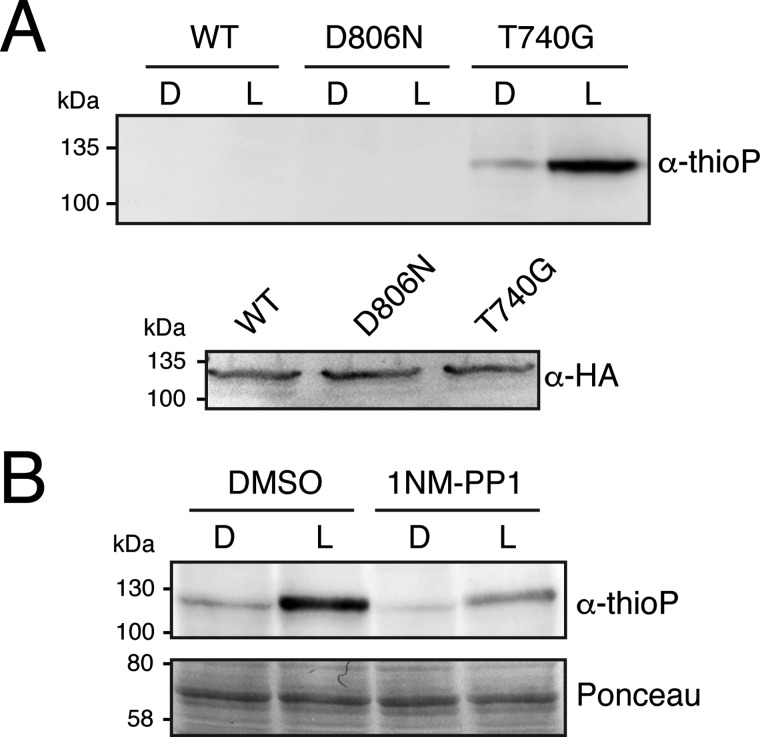
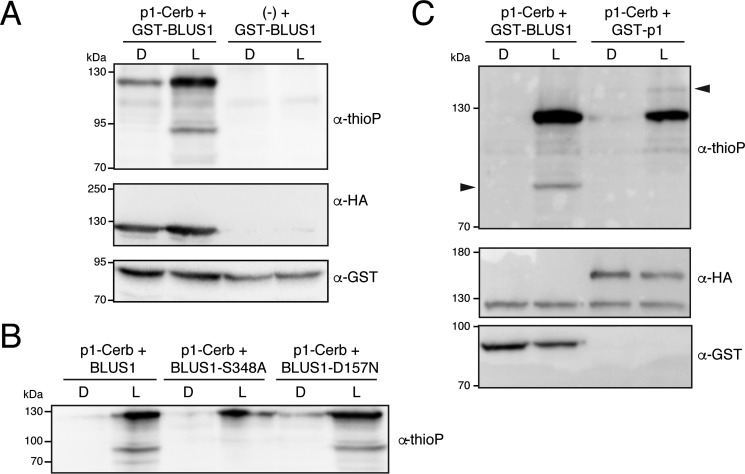
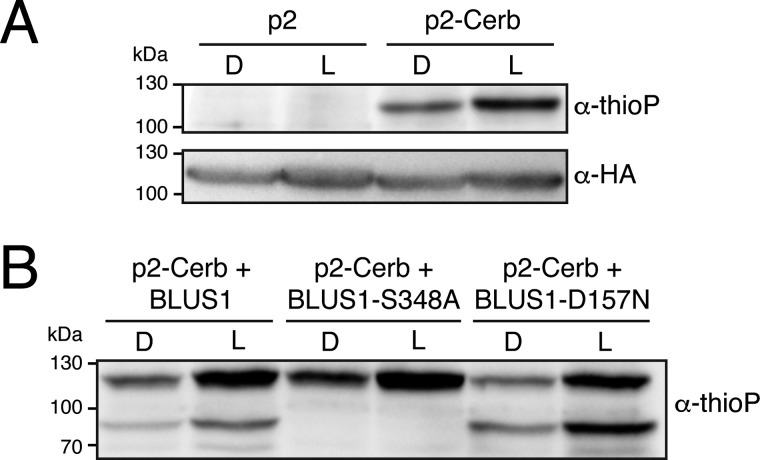
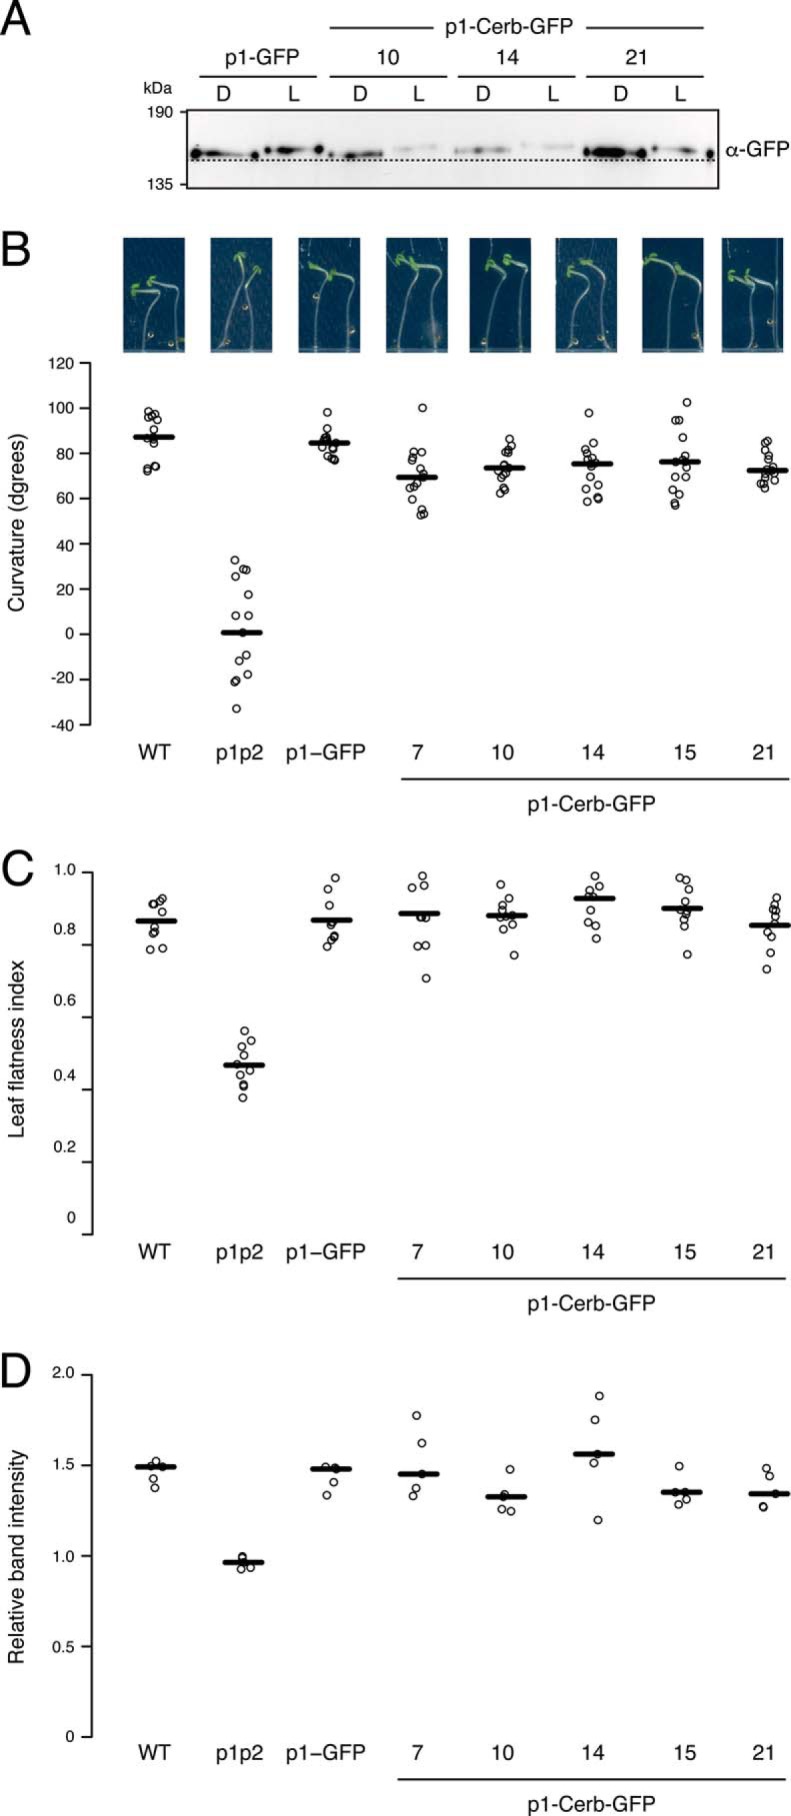
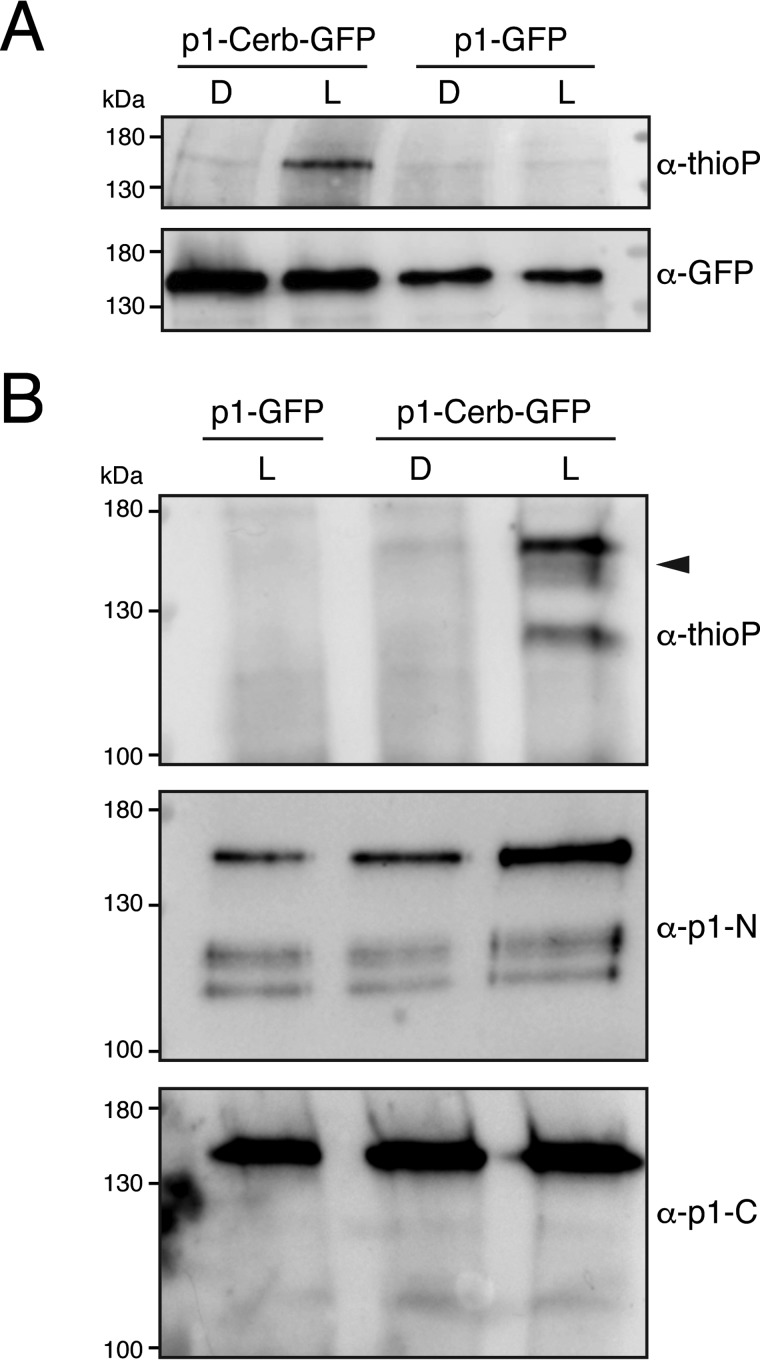
Protein kinases (PKs) control many aspects of plant physiology by regulating signaling networks through protein phosphorylation. Phototropins (phots) are plasma membrane-associated serine/threonine PKs that control a range of physiological processes that collectively serve to optimize photosynthetic efficiency in plants. These include phototropism, leaf positioning and flattening, chloroplast movement, and stomatal opening. Despite their identification over two decades ago, only a handful of substrates have been identified for these PKs. Progress in this area has been hampered by the lack of a convenient means to confirm the identity of potential substrate candidates. Here we demonstrate that the kinase domain of Arabidopsis phot1 and phot2 can be successfully engineered to accommodate non-natural ATP analogues by substituting the bulky gatekeeper residue threonine for glycine. This approach circumvents the need for radioactivity to track phot kinase activity and follow light-induced receptor autophosphorylation in vitro by incorporating thiophosphate from N6-benzyl-ATPγS. Consequently, thiophosphorylation of phot substrate candidates can be readily monitored when added or co-expressed with phots in vitro Furthermore, gatekeeper-modified phot1 retained its functionality and its ability to accommodate N6-benzyl-ATPγS as a phosphodonor when expressed in Arabidopsis We therefore anticipate that this chemical genetic approach will provide new opportunities for labeling and identifying substrates for phots and other related AGC kinases under in vitro and near-native in vivo conditions.

Keywords: ATP; Arabidopsis; chemical genetics; gatekeeper; photobiology; photoreceptor; protein engineering; protein kinase.


Conflict of interest statement

The authors declare that they have no conflicts of interest with the contents of this article

Figures

Figure 1.
Figure 1.
Threonine 740 is the gatekeeper residue of Arabidopsis phot1. A, amino acid sequence alignment of the kinase domain of A. thaliana (At) phototropin 1 with other protein kinases for which the gatekeeper residue has been identified (AtBRI1 and AtFLS2 (35)) or for which the gatekeeper has been engineered to accommodate bulky ATP analogues (Homo sapiens (Hs) AMPKa2 (51) and Saccharomyces cerevisiae (Sc) CDK1 (63)). B, structural model of the kinase domain of Arabidopsis phot1 generated by homology using SwissModel and displayed using PyMOL. Secondary structures are displayed as a schematic. The N-terminal lobe of the kinase domain is colored blue, whereas the C-terminal lobe is colored pink. The β5 strand in the N-terminal lobe is shown in red, and threonine 740 is shown in spheres colored by atom (carbon is gray, oxygen is red, nitrogen is blue). C, cell-free expression and autophosphorylation analysis of wildtype phot1 and different gatekeeper mutants in the presence of [γ-32P]ATP. Reactions were carried out in the absence (D) or presence of 10 s of white light (L). Samples were separated between two SDS-PAGE gels but exposed to autoradiography simultaneously (top panel). The extent of autophosphorylation in the autoradiogram was quantified by ImageJ, and the band intensity (percent) relative to the phot1 light-treated sample is shown below each lane. An immunoblot of phot1 protein levels using anti-HA antibody is shown below.
Figure 2.
Figure 2.
Phot1 containing a modified gatekeeper residue (T740G) can accommodate N6-benzyl-ATPγS and undergo thiophosphorylation in vitro. A, immunoblot of a kinase assay containing cell-free expressed wildtype phot1, phot1-D806N, or phot1-T740G in the presence of N6-benzyl-ATPγS. Reactions were carried out in the absence (D) or presence of 20 s of white light (L), and thiophosphorylation was detected using anti-thiophosphoester antibody (α-thioP). An immunoblot analysis of phot1 protein levels using anti-HA antibody is shown below. B, phot1-T740G thiophosphorylation in the presence of the kinase inhibitor 1-NM-PP1 or DMSO as a control. Ponceau staining of cell-free expression reactions is shown below to indicate equal protein loading.
Figure 3.
Figure 3.
Phot1-Cerberus (p1-T740G) directly phosphorylates BLUS1 in vitro. A, thiophosphorylation analysis of in vitro kinase assays containing phot1-Cerberus (p1-Cerb) and GST-BLUS1 or the cell-free expression extract alone (−) with GST-BLUS1. Reactions were carried out in the absence (D) or presence of 20 s of white light (L), and thiophosphorylation was detected using anti-thiophosphoester antibody (α-thioP). Phot1-Cerberus thiophosphorylation is evident, ∼130 kDa, whereas GST-BLUS1 is shown above 70 kDa. Blots were probed with anti-HA antibody to detect phot1 or anti-GST antibody to detect BLUS1 (shown below). B, thiophosphorylation analysis of in vitro kinase assays containing phot1-Cerberus together with GST-BLUS1-S348A or GST-BLUS1-D157N. C, thiophosphorylation analysis of in vitro kinase assays containing phot1-Cerberus co-expressed with either GST-BLUS1 or GST-phot1 (GST-p1). Reactions were carried out in the absence or presence of 20 s of white light, and thiophosphorylation was detected using anti-thiophosphoester antibody. Phot1-Cerberus thiophosphorylation is evident, ∼130 kDa, whereas thiophosphorylation of GST-phot1 and GST-BLUS1 is indicated above 130 and 70 kDa, respectively, by arrowheads. Blots were probed with anti-HA antibody to detect phot1 and GST-phot1 or with anti-GST antibody to detect BLUS1 (shown below).
Figure 4.
Figure 4.
Phot2-Cerberus phosphorylates BLUS1 at Ser-348. A, thiophosphorylation analysis of in vitro kinase assays containing wildtype phot2 (p2) or phot2-Cerberus (p2-Cerb). Reactions were carried out in the absence (D) or presence of 20 s of white light (L), and thiophosphorylation was detected using anti-thiophosphoester antibody (α-thioP). Phot2-Cerberus thiophosphorylation is evident above 100 kDa. Blots were probed with anti-HA antibody to detect phot2 protein levels (shown below). B, thiophosphorylation analysis of in vitro kinase assays containing phot2-Cerberus together with GST-BLUS1-S348A or GST-BLUS1-D157N. Reactions were carried out as in A. Thiophosphorylation of GST-BLUS1 is shown above 70 kDa, whereas phot2 thiophosphorylation is evident above 100 kDa.
Figure 5.
Figure 5.
Phot1-Cerberus is functional when expressed in the phot1 phot2 double mutant. A, immunoblot analysis of phot1 protein abundance in transgenic Arabidopsis expressing phot1-GFP (p1-GFP) and three independent lines expressing phot1-Cerberus fused to GFP (p1-Cerb-GFP). Protein extracts were isolated from 3-day-old etiolated seedlings either maintained in darkness (D) or irradiated with 20 μmol m−2 s−1 of blue light for 15 min (L) and probed with anti-GFP antibody. The dashed line indicates the lowest mobility edge. B, phototropic responses of 3-day-old etiolated wildtype (gl-1) seedlings, the phot1 phot2 double mutant (p1p2), plants expressing p1-GFP, and five independent lines expressing p1-Cerb-GFP. Measurements represent the angle made by the tip of the hypocotyl with the vertical. Representative seedling images are shown above. C, leaf flatness index (ratio of the leaf area before and after leaf uncurling) for the wildtype (gl-1), the phot1 phot2 double mutant (p1p2), plants expressing p1-GFP, and five independent lines expressing p1-Cerb-GFP. D, chloroplast accumulation measurements in the same genotypes as in A. Detached leaves were illuminated with 1.5 μmol m−2 s−1 of blue light through a 1-mm slit for 90 min, and the slit band intensity was quantified. The relative band intensity shown is expressed as the ratio of the irradiated to the non-irradiated areas. Ratios above 1 indicate accumulation. For B–D, quantifications of plant responses are represented as the median (horizontal line) and individual data points (open circles).
Figure 6.
Figure 6.
Phot1-Cerberus thiophosphorylation in plant protein extracts. A, thiophosphorylation analysis of in vitro kinase assays on microsomal extracts isolated from transgenic Arabidopsis expressing phot1-Cerberus fused to GFP (p1-Cerb-GFP) or phot1-GFP (p1-GFP). Reactions were carried out in the absence (D) or presence of 20 s of white light (L), and thiophosphorylation was detected using anti-thiophosphoester antibody (α-thioP). Phot1-Cerberus thiophosphorylation is evident above 130 kDa. Blots were probed with anti-GFP antibody to detect phot1 protein levels (shown below). B, thiophosphorylation analysis of in vitro kinase assays on total protein extracts isolated from the p1-Cerb-GFP or p1-GFP lines. Reactions were carried out as described in A, except that only the light-treated p1-GFP sample was used as a negative control. Phot1-Cerberus thiophosphorylation is evident above 130 kDa. Additional thiophosphorylation products are indicated by the arrowhead. Blots were also probed with anti-phot1 N-terminal (p1-N) or C-terminal (p1-C) antibodies to detect phot1 and its proteolytic cleavage products.

Similar articles

Cited by

References

    1. Jensen O. N. (2006) Interpreting the protein language using proteomics. Nat. Rev. Mol. Cell Biol. 7, 391–403 10.1038/nrm1939 - DOI - PubMed
    1. Schwessinger B., and Ronald P. C. (2012) Plant innate immunity: perception of conserved microbial signatures. Annu. Rev. Plant Biol. 63, 451–482 10.1146/annurev-arplant-042811-105518 - DOI - PubMed
    1. Mishra N. S., Tuteja R., and Tuteja N. (2006) Signaling through MAP kinase networks in plants. Arch. Biochem. Biophys. 452, 55–68 10.1016/j.abb.2006.05.001 - DOI - PubMed
    1. Katsir L., Davies K. A., Bergmann D. C., and Laux T. (2011) Peptide signaling in plant development. Curr. Biol. 21, R356–R364 10.1016/j.cub.2011.03.012 - DOI - PMC - PubMed
    1. Lehti-Shiu M. D., and Shiu S. H. (2012) Diversity, classification and function of the plant protein kinase superfamily. Philos. Trans. R Soc. Lond. B Biol. Sci. 367, 2619–2639 10.1098/rstb.2012.0003 - DOI - PMC - PubMed

Publication types

MeSH terms

Associated data

LinkOut - more resources