. 2018 May 11;122(10):1354-1368.
doi: 10.1161/CIRCRESAHA.117.312117. Epub 2018 Feb 23.

LncRNA ZFAS1 as a SERCA2a Inhibitor to Cause Intracellular Ca2+ Overload and Contractile Dysfunction in a Mouse Model of Myocardial Infarction

Affiliations

LncRNA ZFAS1 as a SERCA2a Inhibitor to Cause Intracellular Ca2+ Overload and Contractile Dysfunction in a Mouse Model of Myocardial Infarction

Ying Zhang et al. Circ Res. .

Abstract

Rationale: Ca2+ homeostasis-a critical determinant of cardiac contractile function-is critically regulated by SERCA2a (sarcoplasmic reticulum Ca2+-ATPase 2a). Our previous study has identified ZFAS1 as a new lncRNA biomarker of acute myocardial infarction (MI).

Objective: To evaluate the effects of ZFAS1 on SERCA2a and the associated Ca2+ homeostasis and cardiac contractile function in the setting of MI.

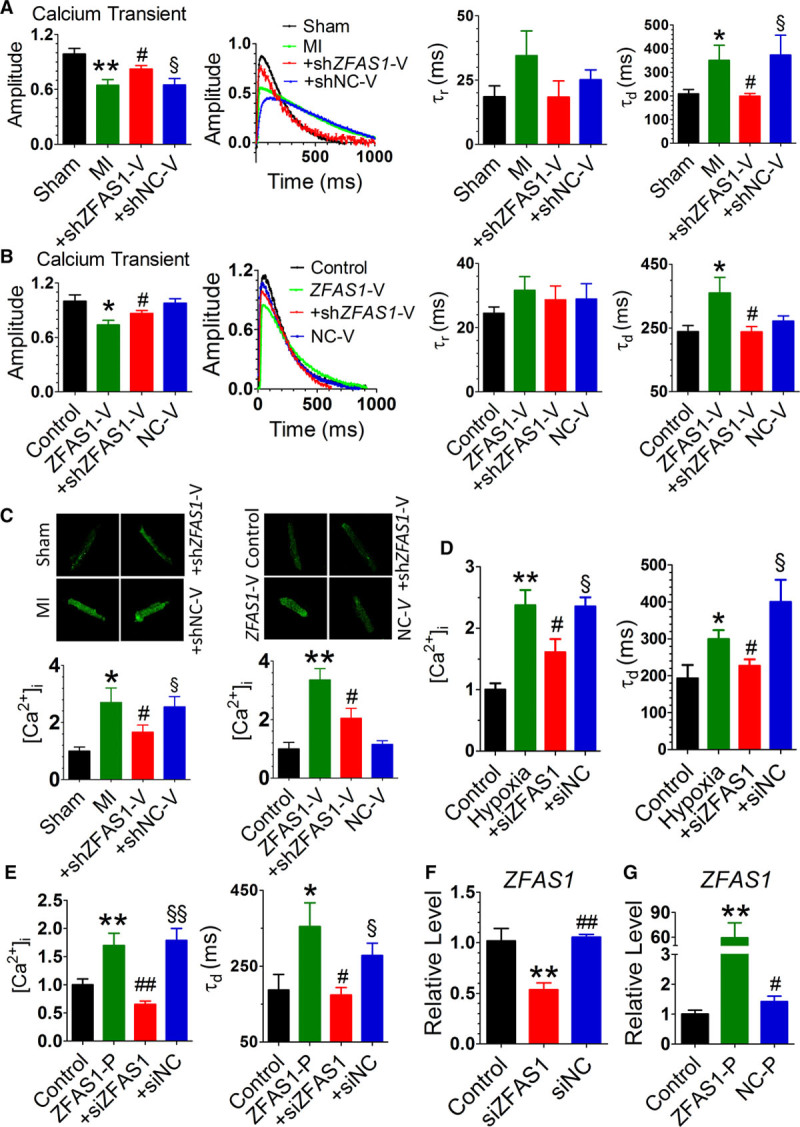
Methods and results: ZFAS1 expression was robustly increased in cytoplasm and sarcoplasmic reticulum in a mouse model of MI and a cellular model of hypoxia. Knockdown of endogenous ZFAS1 by virus-mediated silencing shRNA partially abrogated the ischemia-induced contractile dysfunction. Overexpression of ZFAS1 in otherwise normal mice created similar impairment of cardiac function as that observed in MI mice. Moreover, at the cellular level, ZFAS1 overexpression weakened the contractility of cardiac muscles. At the subcellular level, ZFAS1 deleteriously altered the Ca2+ transient leading to intracellular Ca2+ overload in cardiomyocytes. At the molecular level, ZFAS1 was found to directly bind SERCA2a protein and to limit its activity, as well as to repress its expression. The effects of ZFAS1 were readily reversible on knockdown of this lncRNA. Notably, a sequence domain of ZFAS1 gene that is conserved across species mimicked the effects of the full-length ZFAS1. Mutation of this domain or application of an antisense fragment to this conserved region efficiently canceled out the deleterious actions of ZFAS1. ZFAS1 had no significant effects on other Ca2+-handling regulatory proteins.

Conclusions: ZFAS1 is an endogenous SERCA2a inhibitor, acting by binding to SERCA2a protein to limit its intracellular level and inhibit its activity, and a contributor to the impairment of cardiac contractile function in MI. Therefore, anti-ZFAS1 might be considered as a new therapeutic strategy for preserving SERCA2a activity and cardiac function under pathological conditions of the heart.

Keywords: RNA, long noncoding; calcium; myocardial infarction; sarcoplasmic reticulum calcium-transporting ATPases.


Figures

Figure 1.
Figure 1.
Upregulation of ZFAS1 expression in ischemic heart and in hypoxic cardiomyocytes. A, Elevation of cardiac ZFAS1 level in the peri-infarct areas of a mouse model of myocardial infarction (MI; left) and of myocardium from patients with MI (right). Mouse MI was created by ligation of the left descending coronary artery, and the measurements were conducted 12 h after MI. ZFAS1 levels were determined by real-time polymerase chain reaction (same below). *P<0.05, MI mice vs Sham mice (n=6) or patients with MI vs without MI (n=3). B, Increase in ZFAS1 expression in cultured neonatal mouse cardiomyocytes (NMCMs; left) and in AC16 cells (adult human ventricular cardiomyocyte cell line; right) after hypoxia treatment for 12 h, relative to the cells kept under normoxic conditions. **P<0.01, hypoxia vs control; n=≈4–6. Above data are presented as mean±SEM. C, Representative images of In Situ Hybridization (ISH) in NMCMs showing an increase in ZFAS1 expression after hypoxia treatment for 12 h. Note that ZFAS1 was distributed evenly in both cytosol and nucleus. Red arrows pointing to the nucleus stained in light blue and green ones pointing to ZFAS1 stained in brown. Images are presented with a magnification of ×100 for the (top) and ×500 for the (bottom). Similar results were consistently observed in another 3 batches of cells.
Figure 2.
Figure 2.
Impairment of cardiac contractile function by ZFAS1 in myocardial infarction (MI) mice. A, Amelioration of impairment of contractile function by ZFAS1 overexpression produced by the recombinant adeno-associated virus (serotype 9; AAV9) vector carrying the shRNA (shZFAS1-V) to knock down endogenous ZFAS1 in MI mice. The viral constructs were intravenously injected into mice. Note that shZFAS1-V abrogated the ischemia-induced decreases in ejection fraction (EF) and fractional shortening (FS), and enlargement of left ventricular internal dimension at end diastole (LVIDd) and left ventricular internal dimension at systole (LVIDs). shNC-V: the negative control shRNA engineered into the AAV9 vector. **P<0.01 vs Sham, #P<0.05 vs MI, §P<0.05 vs shZFAS1-V; n=≈12–18. B, Impairment of contractile function induced by ZFAS1 overexpression generated by AAV9 vector carrying the full-length ZFAS1 gene (AAV9 vector carrying the ZFAS1 gene [ZFAS1-V]) in healthy mice. Note that ZFAS1-V significantly decreased EF and FS, and increased LVIDd and LVIDs, similar to those seen in MI mice, and these effects were essentially reversed by coinjection of shZFAS1-V. NC-V: the empty AAV9 vector as a negative control for ZFAS1-V. **P<0.01 vs control or NC-V, ##P<0.01 vs ZFAS1-V; n=≈7–10. C, Decreased maximum rate of rise of left ventricular pressure during contraction (+dp/dtmax) and the maximum rate of drop of left ventricular pressure during relaxation (−dp/dtmax) in MI mice. **P<0.01 vs Sham. ZFAS1 overexpressed by ZFAS1-V delivery showing reduced ±dp/dtmax. *P<0.05 vs control, #P<0.05 vs ZFAS1-V; n=3. D, Raw traces (left) showing the changes of sarcomere shortening (SS) as an index of contractility of cardiac muscles isolated from MI hearts, and mean values of SS in the presence of shZFAS1-V (middle) or ZFAS1-V (right). **P<0.01 vs Sham or control or NC-V, #P<0.05 vs MI, ##P<0.01 vs ZFAS1-V, §§P<0.01 vs shZFAS1-V; n=≈20–43. E, Representative cardiac sections showing the successful delivery of shZFAS1-V and ZFAS1-V into mouse myocardium in vivo the significant presence of fluorescence elicited by GFP (green fluorescent protein) attached to the viral vectors. F, Verification of knockdown of endogenous ZFAS1 by shZFAS1-V in MI myocardium determined by quantitative real-time-polymerase chain reaction. *P<0.05 vs Sham, #P<0.05 vs MI, §P<0.05 vs shZFAS1-V; n=≈12–20. G, Verification of overexpression of ZFAS1 elicited by ZFAS1-V in normal mice 4 and 7 wk after infection. *P<0.05 vs control, #P<0.05 vs ZFAS1-V; n=≈4–10. Data are all expressed as mean±SEM.
Figure 3.
Figure 3.
Impairment of intracellular Ca2+ homeostasis by ZFAS1 in cardiomyocytes. A, Restoration of the decreased amplitude of Ca2+ transient by adeno-associated virus serotype 9 vector carrying a ZFAS1-shRNA fragment (shZFAS1-V; left) and acceleration of the slowed time courses of the rising and decaying phases of Ca2+ transient by shZFAS1-V (right) in adult cardiac cells isolated from myocardial infarction (MI) hearts. **P<0.01 vs Sham, #P<0.05 vs MI, §P<0.05 vs shZFAS1-V; n=≈17–25. Middle left, Typical examples of Ca2+ transient traces recorded in Fluo-3-loaded cardiomyocytes isolated from MI mice with or without shZFAS1-V treatment. Right, Averaged data of time constants for sarcoplasmic reticulum (SR) Ca2+ release from (τr for the rising phase) and Ca2+ reuptake back to SR (τd for the decaying phase). The time constants were acquired by single exponential curve fitting to the data points of the rising phase and decaying phase, respectively. *P<0.05 vs Sham, #P<0.05 vs MI, §P<0.05 vs shZFAS1-V; n=≈15–17. B, Decline of the amplitude of Ca2+ transient induced by adeno-associated virus 9 vector carrying the ZFAS1 gene (ZFAS1-V; left) and increases in the time constants for the rising and decaying phases of Ca2+ transient by ZFAS1-V (right) in adult cardiac cells isolated from healthy mice. Middle left, Typical examples of Ca2+ transient traces recorded in Fluo-3-loaded cardiomyocytes isolated from healthy mice with or without ZFAS1-V or NC-V treatment. Right, Mean values of time constants for SR Ca2+ release from (τr) and Ca2+ reuptake (τd). *P<0.05 vs control or NC-V, #P<0.05 vs ZFAS1-V; n=≈27–32. C, Left, Mitigation of increased intracellular Ca2+ concentration ([Ca2+]i) by shZFAS1-V in MI mice. *P<0.05 vs Sham, #P<0.05 vs MI, §P<0.05 vs shZFAS1-V; n=≈15–25. Right, Elevation of [Ca2+]i induced by forced expression of ZFAS1 generated by ZFAS1-V infection. **P<0.01 vs control and NC-V, #P<0.05 vs ZFAS1-V; n=≈10–20. D, Mitigation of increased intracellular Ca2+ concentration ([Ca2+]i) by ZFAS1 siRNA (siZFAS1; n=≈13–19; left) and restoration of the decreased rate of Ca2+ reuptake into SR by siZFAS1 (n=≈9–13; right) in neonatal mouse cardiomyocytes (NMCMs) exposed to hypoxic environment. siRNAs were transfected into cardiomyocytes using X-tremeGENE siRNA transfection reagent. *P<0.05, **P<0.01 vs control, #P<0.05 vs hypoxia, §P<0.05 vs siZFAS1. E, Left, Elevation of [Ca2+]i induced by forced expression of ZFAS1 generated by pCDNA-ZFAS1 vector (ZFAS1-P) in nonhypoxia cardiomyocytes, and abrogation of the effects by cotransfection with siZFAS1. **P<0.01 vs control, ##P<0.01 vs ZFAS1-P, §§P<0.01 vs siZFAS1; n=≈11–16. Right, Slowing of Ca2+ reuptake into SR by forced expression of ZFAS1 generated by ZFAS1-P in nonhypoxia cardiomyocytes, and abrogation of the effects by cotransfection with siZFAS1. *P<0.05 vs control, #P<0.05 vs ZFAS1-P, §P<0.05 vs siZFAS1; n=≈8–12. F, Verification of the efficacy of siZFAS1 to knockdown endogenous ZFAS1 transcripts in cultured NMCMs. **P<0.01 vs control, ##P<0.01 vs siZFAS1; n=4. G, Verification of overexpression of ZFAS1 produced by ZFAS1-P. **P<0.01 vs control, #P<0.05 vs ZFAS1-P; n=4. siNC indicates scrambled negative control siRNA.
Figure 4.
Figure 4.
Downregulation of SERCA2a (sarcoplasmic reticulum Ca2+-ATPase 2a) expression induced by ZFAS1. A, Downregulation of SERCA2a expression at both protein (top) and mRNA (bottom) levels in myocardial infarction (MI) hearts relative to the sham animals and recovery of SERCA2a expression by adeno-associated virus serotype 9 vector carrying a ZFAS1-shRNA fragment (shZFAS1-V). *P<0.05, **P<0.01 vs Sham, #P<0.05 vs MI, §P<0.05 vs shZFAS1-V; n=≈6–8. B, Downregulation of SERCA2a expression at both protein (top) and mRNA (bottom) levels in healthy mice pretreated with adeno-associated virus 9 vector carrying the ZFAS1 gene (ZFAS1-V) and recovery of SERCA2a expression by shZFAS1-V. *P<0.05 vs control, #P<0.05 vs ZFAS1-V; n=≈4–6. C, Downregulation of SERCA2a expression at both protein (top) and mRNA (bottom) levels in neonatal mouse cardiomyocytes (NMCMs) cultured under hypoxic conditions relative to the cells in normoxic environment. Note that silence of ZFAS1 by siZFAS1 normalized the SERCA2a expression. *P<0.05, **P<0.01 vs control, #P<0.05 vs hypoxia, §P<0.05 vs siZFAS1; n=5. D, Downregulation of SERCA2a expression at both protein (top) and mRNA (bottom) levels by ZFAS1-P in NMCMs cultured under normoxic conditions and reversal of SERCA2a downregulation by siZFAS1. *P<0.05 vs control, #P<0.05 vs ZFAS1-P, §P<0.05 vs siZFAS1; n=≈4–6. Data are expressed as mean±SEM.
Figure 5.
Figure 5.
Interaction between lncRNA ZFAS1 and SERCA2a (sarcoplasmic reticulum Ca2+-ATPase 2a) protein. A, RNA-binding protein immunoprecipitation (RIP) analysis for ZFAS1:SERCA2a interaction. Note that immunoprecipitation (IP) of SERCA2a retrieved a robust amount of ZFAS1. **P<0.01 vs anti-IgG; n=4. B, RNA pulldown of ZFAS1 dragged down an appreciable quantity of SERCA2a. The band for the binding between ZFAS1 and SERCA2a protein disappeared when treated with an antisense fragment to ZFAS1 (AsZFAS1). Additionally, an unrelated lncRNA PLSCR4 (phospholipid scramblase 4) as a negative control, could not drag down SERCA2a, indicating the specific of the ZFAS1:SERCA2a interaction. **P<0.01, ##P<0.01, §§P<0.01 vs ZFAS1; n=3. C, Verification of the purity of isolated sarcoplasmic reticulum (SR) by the enhanced activity of SR-specific NADPH (nicotinamide adenine dinucleotide phosphate) cytochrome C reductase determined by colorimetry assay. **P<0.01 vs total protein samples; n=4. D, Upregulation of ZFAS1 expression in SR isolated from myocardial infarction (MI) hearts relative to Sham hearts, determined by quantitative real-time-polymerase chain reaction. *P<0.05 vs Sham; n=3. E, Downregulation of SERCA2a protein in SR of MI myocardium relative to sham control, determined by Western blot analysis. *P<0.05 vs Sham; n=3.
Figure 6.
Figure 6.
Dysfunction of SERCA2a (sarcoplasmic reticulum Ca2+-ATPase 2a) produced by ZFAS1. A, Top, An oligonucleotide fragment corresponding to the conserved region of ZFAS1 gene (functional domain of ZFAS1 [ZFAS1-FD]). Bottom, An oligonucleotide fragment antisense to ZFAS1-FD (AsZFAS1-FD). B, Downregulation of SERCA2a expression at both protein (left) and mRNA (right) levels in neonatal mouse cardiomyocytes (NMCMs) transfected with ZFAS1-FD. *P<0.05 vs control, #P<0.05 vs ZFAS1-FD; n=≈5–7. C, Deceleration of decaying kinetics of Ca2+ transient in NMCMs transfected with ZFAS1-FD. *P<0.05 vs control, #P<0.05 vs ZFAS1-FD; n=≈17–22. D, Increase in resting Ca2+ concentration ([Ca2+]i) in NMCMs transfected with ZFAS1-FD. **P<0.01 vs control, ##P<0.01 vs ZFAS1-FD; n=≈14–30. E, Effects of Mut-ZFAS1-FD and ZFAS1-FD on the expression of SERCA2a at both protein (left) and mRNA (right) levels in NMCMs. *P<0.05 vs control or NC; n=≈6–8. F, Resting Ca2+ concentration ([Ca2+]i) in NMCMs transfected with Mut-ZFAS1-FD. **P<0.01 vs control or NC; n=≈25–36. G, The decaying kinetics of Ca2+ transient in NMCMs transfected with Mut-ZFAS1-FD. *P<0.05 vs control or NC; n=≈9–12. H, Upregulation of SERCA2a expression at both protein (left) and mRNA (right) levels by AsZFAS1-FD in NMCMs pretreated with ZFAS1-P for ZFAS1 overexpression. *P<0.05 vs ZFAS1-P, #P<0.05 vs AsZFAS1-FD; n=≈5–9. I, Reversal of ZFAS1-induced reduction of Ca2+ transient amplitude by AsZFAS1-FD. *P<0.05 vs ZFAS1-P, #P<0.05 vs AsZFAS1-FD; n=≈10–18. J, Reversal of the time delay of Ca2+ release and reuptake by AsZFAS1-FD in NMCMs pretreated with ZFAS1-P for ZFAS1 overexpression. *P<0.05 vs AsZFAS1-FD (left) or ZFAS1-P (right), #P<0.05 vs AsZFAS1-FD; n=≈12–18. K, Verification of the efficacy of AsZFAS1-FD in reducing ZFAS1 level in NMCMs pretreated with ZFAS1-P for ZFAS1 overexpression. **P<0.01 vs control, #P<0.05 vs ZFAS1-P, §P<0.05 vs AsZFAS1-FD; n=6.

Comment in

Similar articles

Cited by

References

    1. Luo M, Anderson ME. Mechanisms of altered Ca2+ handling in heart failure. Circ Res. 2013;113:690–708. doi: 10.1161/CIRCRESAHA.113.301651. - PMC - PubMed
    1. Li XC, Wei L, Zhang GQ, Bai ZL, Hu YY, Zhou P, Bai SH, Chai Z, Lakatta EG, Hao XM, Wang SQ. Ca2+ cycling in heart cells from ground squirrels: adaptive strategies for intracellular Ca2+ homeostasis. PLoS One. 2011;6:e24787. doi: 10.1371/journal.pone.0024787. - PMC - PubMed
    1. Park WJ, Oh JG. SERCA2a: a prime target for modulation of cardiac contractility during heart failure. BMB Rep. 2013;46:237–243. - PMC - PubMed
    1. Xin W, Lu X, Li X, Niu K, Cai J. Attenuation of endoplasmic reticulum stress-related myocardial apoptosis by SERCA2a gene delivery in ischemic heart disease. Mol Med. 2011;17:201–210. doi: 10.2119/molmed.2010.00197. - PMC - PubMed
    1. Younce CW, Burmeister MA, Ayala JE. Exendin-4 attenuates high glucose-induced cardiomyocyte apoptosis via inhibition of endoplasmic reticulum stress and activation of SERCA2a. Am J Physiol Cell Physiol. 2013;304:C508–C518. doi: 10.1152/ajpcell.00248.2012. - PubMed

Publication types

MeSH terms