. 2018 Mar 13;115(11):2836-2841.
doi: 10.1073/pnas.1721899115. Epub 2018 Feb 23.

Highly multiplexed and quantitative cell-surface protein profiling using genetically barcoded antibodies

Affiliations

Highly multiplexed and quantitative cell-surface protein profiling using genetically barcoded antibodies

Samuel B Pollock et al. Proc Natl Acad Sci U S A. .

Abstract

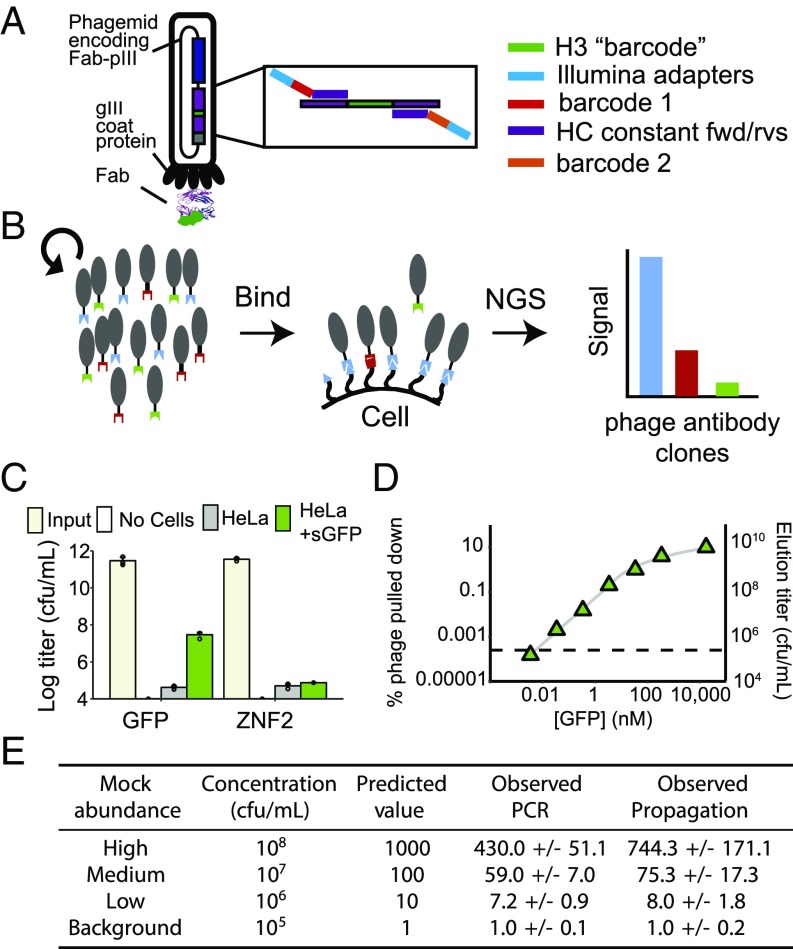
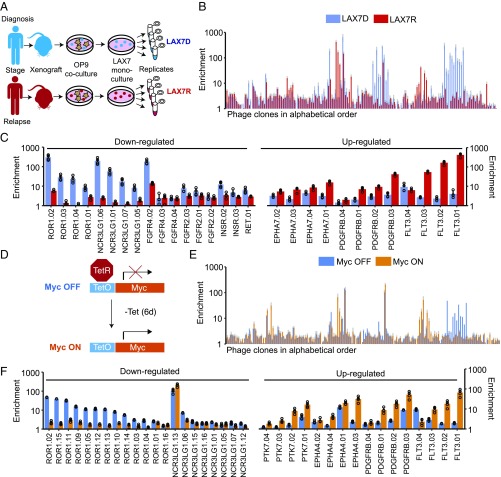
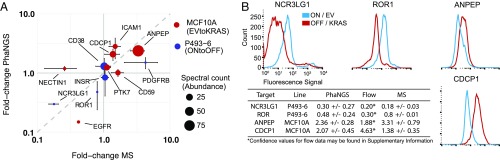
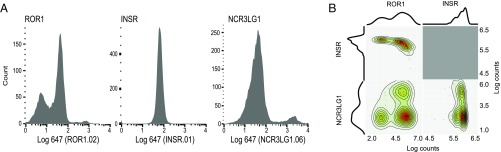
Human cells express thousands of different surface proteins that can be used for cell classification, or to distinguish healthy and disease conditions. A method capable of profiling a substantial fraction of the surface proteome simultaneously and inexpensively would enable more accurate and complete classification of cell states. We present a highly multiplexed and quantitative surface proteomic method using genetically barcoded antibodies called phage-antibody next-generation sequencing (PhaNGS). Using 144 preselected antibodies displayed on filamentous phage (Fab-phage) against 44 receptor targets, we assess changes in B cell surface proteins after the development of drug resistance in a patient with acute lymphoblastic leukemia (ALL) and in adaptation to oncogene expression in a Myc-inducible Burkitt lymphoma model. We further show PhaNGS can be applied at the single-cell level. Our results reveal that a common set of proteins including FLT3, NCR3LG1, and ROR1 dominate the response to similar oncogenic perturbations in B cells. Linking high-affinity, selective, genetically encoded binders to NGS enables direct and highly multiplexed protein detection, comparable to RNA-sequencing for mRNA. PhaNGS has the potential to profile a substantial fraction of the surface proteome simultaneously and inexpensively to enable more accurate and complete classification of cell states.

Keywords: NGS; biomarkers; cell surface proteomics; leukemia; phage display.


Conflict of interest statement

The authors declare no conflict of interest.

Figures

Fig. 1.
Fig. 1.
Design and validation of the PhaNGS method. (A) The Fab is fused to the gene III coat protein on the M13 phagemid within the viral particle. Each phage antibody is preselected for binding to specific proteins and can be uniquely identified by the sequence of its CDR H3 (green bar). (B) Diagram of the PhaNGS method, which consists of three steps: (i) A collection of phage antibodies is assembled that bind to specific targets of interest; (ii) the library is bound to a cell sample, and nonbinding phage antibodies are washed away; and (iii) the bound phage antibodies are propagated, amplified, and subjected to next-generation DNA sequencing to quantify the retained phage antibodies. (C) One antitarget (GFP.01, n = 3) and one control phage (ZNF2.01, n = 3) were profiled against a HeLa line stably overexpressing GFP tethered to the cell surface (green bar), along with its parental line (gray bar) and a no-cell control. Error bars show SD of three replicates. Input titer for GFP/ZNF2 phage was measured at 3 × 10¹¹/4 × 1011 cfu/mL. The phage titers after binding and washing were 3 × 10⁷/8 × 104 cfu/mL for HeLaGFP, 4 × 10⁴/5 × 104 for the HeLa cell control, and undetectable for the no-cell control. (D) To investigate the limit of detection of PhaNGS, a single, strong phage (Kd = ∼0.5 nM at 2 × 10¹¹ cfu/mL) was panned against varying concentrations of immobilized GFP (green triangles) or BSA alone (dashed line), acid eluted, and titered. Results are shown below the graph. A total of 3.4 pM of GFP was indistinguishable from BSA, however 34 pM appeared to be above the detection limit, which we approximate here at a titer of ∼106 cfu/mL phage at around 10 pM GFP. To obtain a value for the fraction of infective phage actually expressing a Fab, the same data are displayed as fraction of phage pulled down. We see the fraction level off at around 0.1, suggesting that 10% of GFP.01 phage actually display a Fab. (E) A mock phage mixture was assembled from four different Fab-phage clones with concentrations ranging from 105−8 cfu/mL, a 4-log range expected to match the range present on cells (14) and expected phage titers from above, to examine the accuracy and dynamic range of the PhaNGS method. Propagating the phage mixture to saturation in culture followed by PCR was more accurate than direct PCR without propagation.
Fig. 2.
Fig. 2.
PhaNGS profiling of surface proteomes at diagnosis and relapse in a patient with acute lymphoblastic leukemia (ALL). (A) Bone marrow samples obtained from a patient diagnosed with ALL (Ph-negative) at diagnosis (LAX7D) and relapse (LAX7R) were grown as xenografts into immune-compromised NOD/SCIDγc–/– mice, cocultured with OP9 cells, and later frozen as monoculture stocks. Samples were thawed and expanded in culture 1 wk before the PhaNGS profile experiment. Both cell populations were positive for CD10, CD19, and CD45. The LAX7R resistance sample possessed a KRASG12V mutation not detected at diagnosis. (B) PhaNGS profiles for 144 different Fab-phages (SI Appendix, Datasets S1 and S3) directed to 44 different membrane targets were allowed to bind to LAX7D (blue) or LAX7R (red) cells. The average value from four replicates, with SD (gray bars), is shown. (C) Targets are shown that were down- or up-regulated from LAX7D to LAX7R. (D) Experimental scheme for the P493-6 cell line in MycOFF and MycON conditions. Myc was repressed for 48 h with the addition of Tet (100 ng/mL, twice per day). The MycOFF state was harvested, Tet was washed out, and the cells recovered for 6 d before the MycON condition was harvested. (E) The extended bar chart displays the results of the PhaNGS profiling for the MycOFF to MycON experiment (blue and orange bars, respectively). The average value from four replicates, with SD (gray bars), is shown. (F) Targets are presented that were down- or up-regulated when transitioning from MycOFF to MycON.
Fig. 3.
Fig. 3.
Comparison of PhaNGS to established proteomic methods. (A) Comparison of fold-changes in surface expression of indicated surface proteins pre– and post–2-d suppression of Myc in P493-6 B cells or for empty vector to KRASG12V transformation of MCF10A cells as assessed by PhaNGS and Stable Isotope Labeling by Amino Acids in Cell Culture (SILAC) mass spectrometry. Dot size indicates spectral counts for mass spectrometry experiments to imply the abundance of each protein. Identity (y = x, gray dashed line) is shown as a benchmark for perfect agreement between MS and PhaNGS. R = 0.66 (regression line not pictured, y = 0.98x0.62). Where applicable, error bars for PhaNGS fold-change represent SD derived from unique Fab-phages against the same target. (B) Flow data corresponding to mass spectrometry vs. PhaNGS data for ANPEP, CDCP1, NCR3LG1, and ROR1. The fold-change values observed in the flow cytometry experiments closely match those observed for PhaNGS.
Fig. 4.
Fig. 4.
Single-cell PhaNGS on P493-6 cells. (A) Flow cytometry histograms on a population of P493-6 MycON cells (n = 12,000), using purified Fabs for ROR1 (clone ROR1.02, Left), insulin receptor (clone INSR.01, Middle), and NCR3LG1 (clone NCR3LG1.06, Right). Log fluorescence values are indicated on the x axis (anti–FLAG-APC). ROR1 shows bimodal expression with a small low-signal peak and large high-signal peak, INSR shows unimodal expression, and NCR3LG1 shows bimodal expression with a large low-signal peak and small high-signal peak. (B) Results from single-cell PhaNGS using the corresponding ROR1, INSR, and NCR3LG1 Fab-phage antibodies on 84 individual P493-6 cells match observations from flow cytometry.

References

    1. Kolodziejczyk AA, Kim JK, Svensson V, Marioni JC, Teichmann SA. The technology and biology of single-cell RNA sequencing. Mol Cell. 2015;58:610–620. - PubMed
    1. Fan HC, Fu GK, Fodor SP. Expression profiling. Combinatorial labeling of single cells for gene expression cytometry. Science. 2015;347:1258367. - PubMed
    1. Pascal LE, et al. Correlation of mRNA and protein levels: Cell type-specific gene expression of cluster designation antigens in the prostate. BMC Genomics. 2008;9:246. - PMC - PubMed
    1. Huang H, et al. Selection of recombinant anti-sh3 domain antibodies by high-throughput phage display. Protein Sci. 2015;24:1890–1900. - PMC - PubMed
    1. Hornsby M, et al. A high through-put platform for recombinant antibodies to folded proteins. Mol Cell Proteomics. 2015;14:2833–2847. - PMC - PubMed

Publication types