. 2018 Feb 23;9(1):803.
doi: 10.1038/s41467-018-03184-1.

Correlating chemical diversity with taxonomic distance for discovery of natural products in myxobacteria

Affiliations

Correlating chemical diversity with taxonomic distance for discovery of natural products in myxobacteria

Thomas Hoffmann et al. Nat Commun. .

Abstract

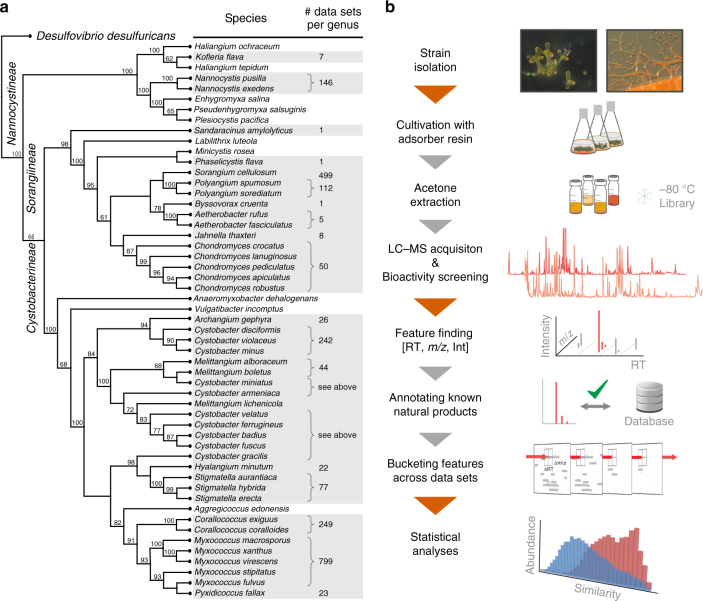
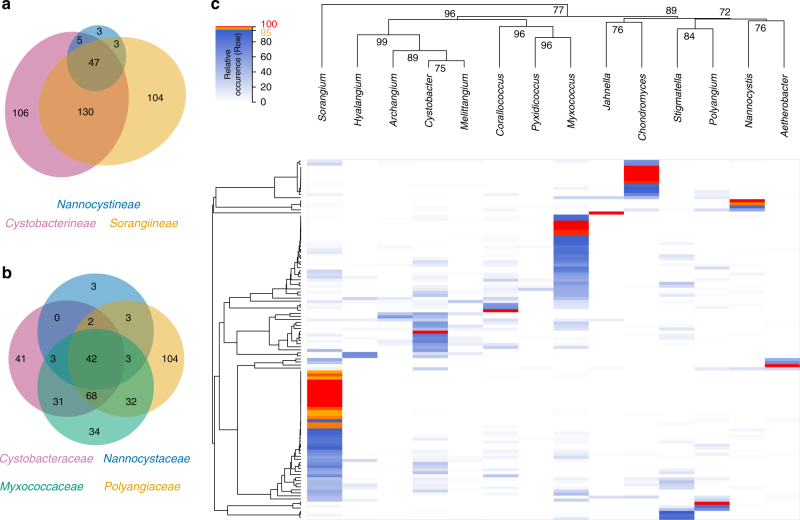
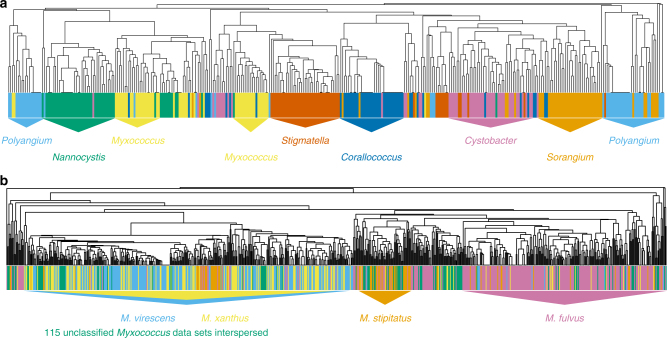
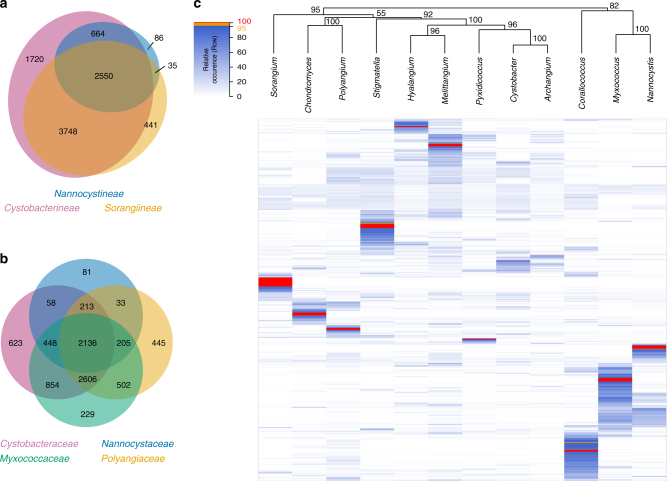
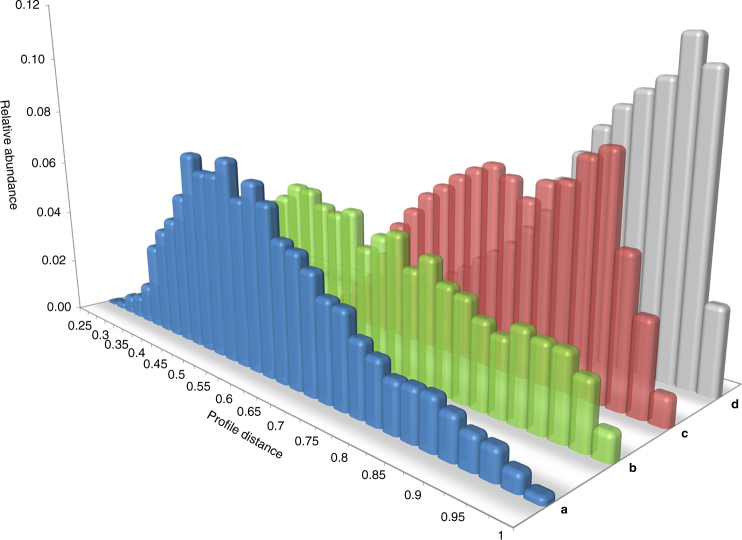
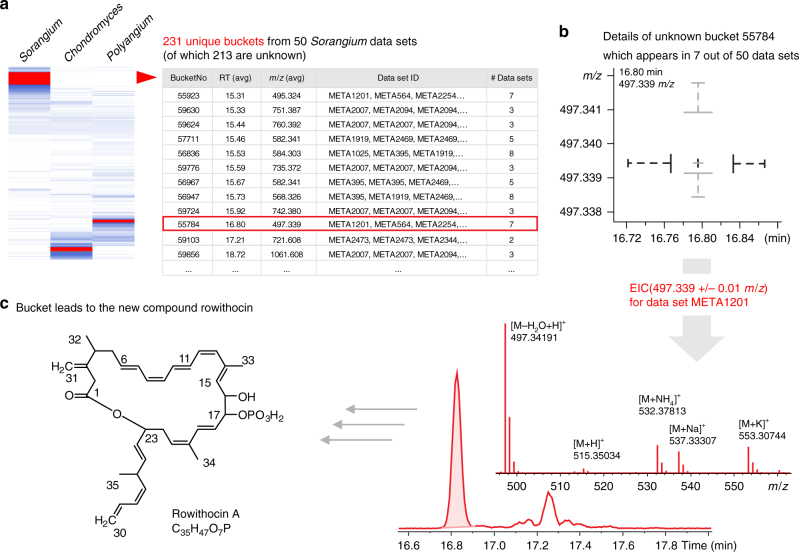
Some bacterial clades are important sources of novel bioactive natural products. Estimating the magnitude of chemical diversity available from such a resource is complicated by issues including cultivability, isolation bias and limited analytical data sets. Here we perform a systematic metabolite survey of ~2300 bacterial strains of the order Myxococcales, a well-established source of natural products, using mass spectrometry. Our analysis encompasses both known and previously unidentified metabolites detected under laboratory cultivation conditions, thereby enabling large-scale comparison of production profiles in relation to myxobacterial taxonomy. We find a correlation between taxonomic distance and the production of distinct secondary metabolite families, further supporting the idea that the chances of discovering novel metabolites are greater by examining strains from new genera rather than additional representatives within the same genus. In addition, we report the discovery and structure elucidation of rowithocin, a myxobacterial secondary metabolite featuring an uncommon phosphorylated polyketide scaffold.


Conflict of interest statement

The authors declare no competing financial interests.

Figures

Fig. 1
Fig. 1
Myxobacterial metabolite profile analysis. a Taxonomy of the order Myxococcales based on a neighbor-joining consensus tree constructed from 16S rRNA gene sequence data of type strains, with the number of available LC–MS data sets given for each genus. Additional strains not assigned to the listed species were included for some genera, for a total count of 2316 data sets (Supplementary Table 8 and Supplementary Data 1). b Outline of the analysis workflow used in this study
Fig. 2
Fig. 2
Distribution of known myxobacterial compounds amongst extracts from ~2300 strains. a Venn diagram on suborder level. b Euler plot on family level (overlap numbers between opposite circles not printed). c Heatmap displaying known compound families found among the myxobacterial genera after UPGMA-based hierarchical clustering. Red color indicates 100% of detections within one genus, i.e., the compound family is solely found in this genus although not necessarily in all data sets of the respective genus. Compound families that were more than 95% occuring within one genus are orange. The data sets originate from genera comprising at least 5 corresponding strains: Aetherobacter (5 strains), Archangium (26), Chondromyces (50), Corallococcus (249), Cystobacter (242), Hyalangium (22), Jahnella (8), Melittangium (44), Myxococcus (799), Nannocystis (146), Polyangium (112), Pyxidicoccus (23), Sorangium (499), and Stigmatella (77). A total of 170 metabolite families were considered, covering 398 compounds. Column clustering was subjected to bootstrapping (n = 500) with ‘approximately unbiased’ p-values displayed
Fig. 3
Fig. 3
Metabolite profiles clustering by taxonomy. a Clustering of 350 data sets based on the distribution of identified known myxobacterial compounds. Each of the 7 most abundant myxobacterial genera is represented by 50 randomly selected data sets with a distinguishable color coding. Colored triangles indicate regions which are enriched with data sets of a single genus. A total of 94 compound families was found amongst these data sets. b Clustering of all available Myxococcus data sets (790) covering a varying number of representatives of M. virescens (189, blue), M. xanthus (154, yellow), M. stipitatus (76, orange), M. fulvus (256, magenta), and unclassified Myxococcus species (115, green). See Supplementary Figures 6 and 7 for additional considerations
Fig. 4
Fig. 4
Clustering of unknown features. Distribution of mass spectral buckets created from unknown features of 515 myxobacterial strain extracts shown as a Venn diagram on suborder level and b Euler plot on family level. c Heat map displaying ~9200 buckets across all data sets. The data sets are distributed as follows: Archangium (26), Chondromyces (50), Corallococcus (50), Cystobacter (50), Hyalangium (22), Melittangium (44), Myxococcus (50), Nannocystis (50), Polyangium (50), Pyxidicoccus (23), Sorangium (50), and Stigmatella (50). Individual data sets were collapsed to genus level before applying UPGMA-based hierarchical clustering. Buckets unique to a genus are shown in red, those which are highly specific with >95% relative occurrence per genus are in orange (visible upon magnification). Column clustering was subjected to bootstrapping (n = 500) with ‘approximately unbiased’ p-values displayed. Contains no technical or biological replicates
Fig. 5
Fig. 5
Myxobacterial metabolite profile similarity in relation to taxonomic distance. Histogram plots depicting binned distributions for metabolite profile (dis)similarity within and between varying taxonomic ranks, whereas on x axis scale 0 means highest similarity, 1 means greatest distance. Distance distribution calculated between all profiles from: a – various strains within their respective species (blue), b – strains belonging to different species but within their respective genus (green), c – strains belonging to different genera but within their respective family (red), d – strains belonging to different suborders (gray). See Supplementary Table 5 for readouts from statistical tests
Fig. 6
Fig. 6
Discovery of the new myxobacterial natural product rowithocin. a Section of the heatmap featuring unique buckets from Sorangium. More than 200 buckets are found exclusively within the 50 Sorangium data sets. b Information on each bucket allows interpretation of the bucket’s characteristics such as median, quantile and outlier analysis. c Investigation of an unknown bucket with 497.339 m/z around 16.8 min revealed that the bucket corresponds—besides several adduct ions—to a distinct signal of type [M + H]+ with 515.350 m/z. Subsequent analyses of newly prepared extracts revealed additional related compounds with significantly increased abundance which were eventually characterized as the novel myxobacterial metabolite family of rowithocins. Rowithocin A (C35H47O7P) is the largest derivative with a monoisotopic mass of 610.3059 Da, detectable in fresh extracts as [M + H]+ (611.3132 m/z) or [M – H] (609.2986 m/z)

References

    1. Cragg GM, Newman DJ. Natural products: a continuing source of novel drug leads. Biochim. Biophys. Acta. 2013;1830:3670–3695. doi: 10.1016/j.bbagen.2013.02.008. - DOI - PMC - PubMed
    1. Bachmann BO, van Lanen SG, Baltz RH. Microbial genome mining for accelerated natural products discovery: is a renaissance in the making? J. Ind. Microbiol. Biotechnol. 2014;41:175–184. doi: 10.1007/s10295-013-1389-9. - DOI - PMC - PubMed
    1. Harvey AL, Edrada-Ebel R, Quinn RJ. The re-emergence of natural products for drug discovery in the genomics era. Nat. Rev. Drug. Discov. 2015;14:111–129. doi: 10.1038/nrd4510. - DOI - PubMed
    1. Lewis K. Platforms for antibiotic discovery. Nat. Rev. Drug. Discov. 2013;12:371–387. doi: 10.1038/nrd3975. - DOI - PubMed
    1. Bérdy J. Bioactive microbial metabolites. J. Antibiot. 2005;58:1–26. doi: 10.1038/ja.2005.1. - DOI - PubMed

Publication types

Substances