. 2018 Feb 23;9(1):796.
doi: 10.1038/s41467-018-03185-0.

Membrane cholesterol mediates the cellular effects of monolayer graphene substrates

Affiliations

Membrane cholesterol mediates the cellular effects of monolayer graphene substrates

Kristina E Kitko et al. Nat Commun. .

Abstract

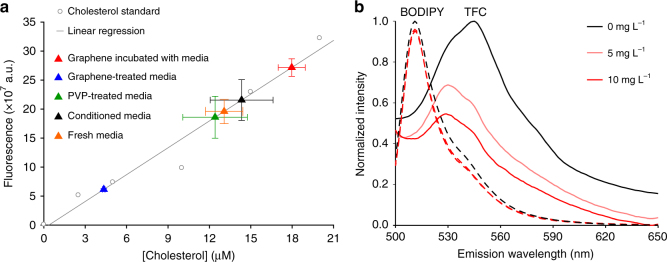
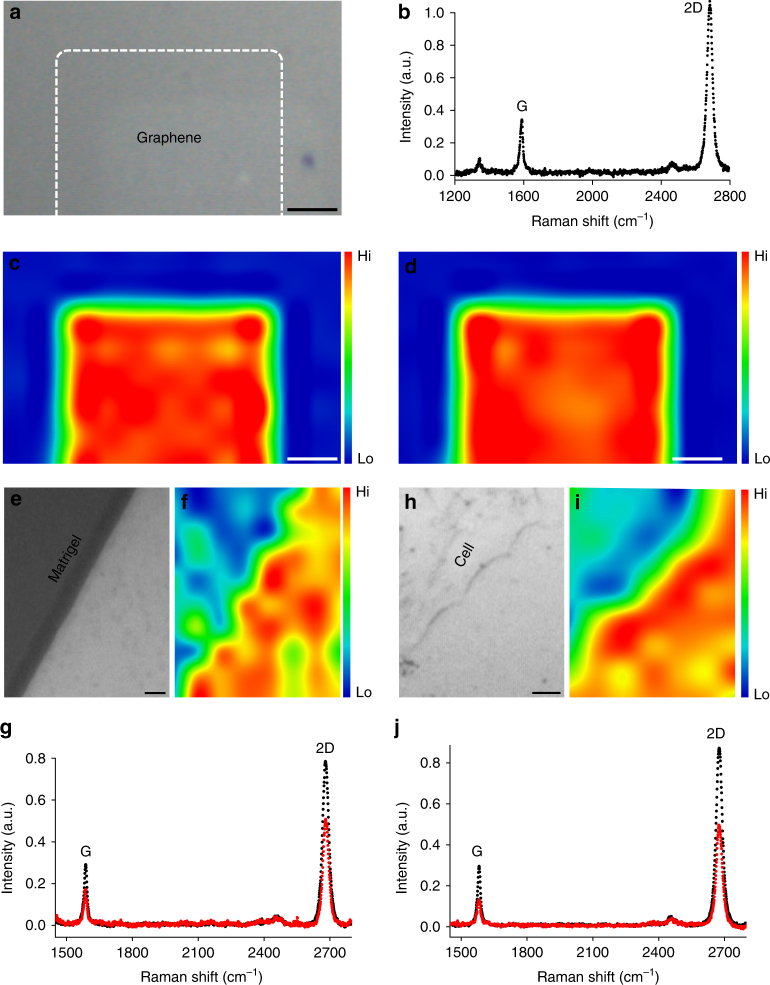
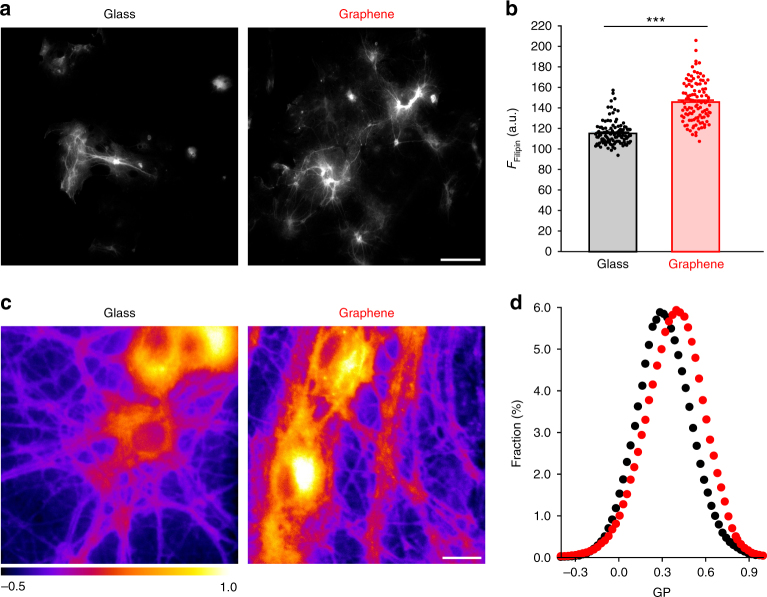
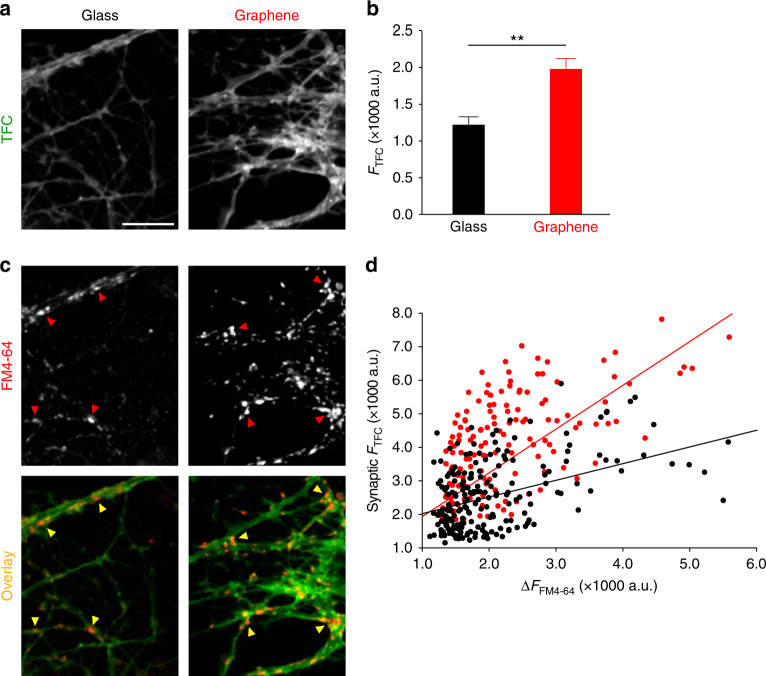
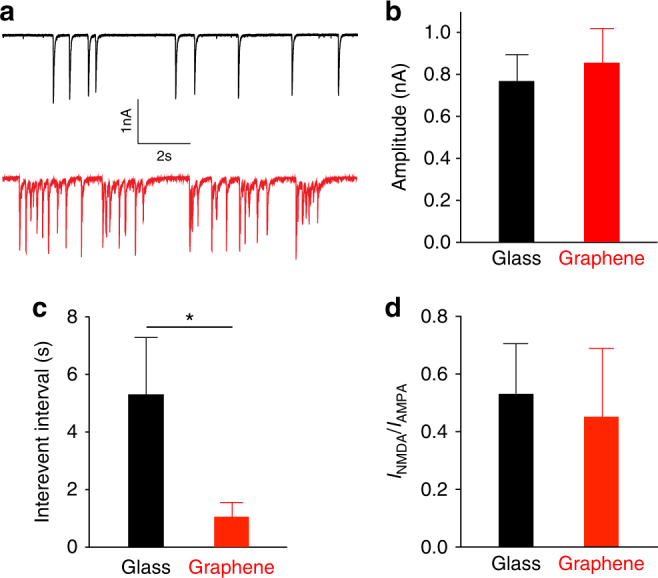
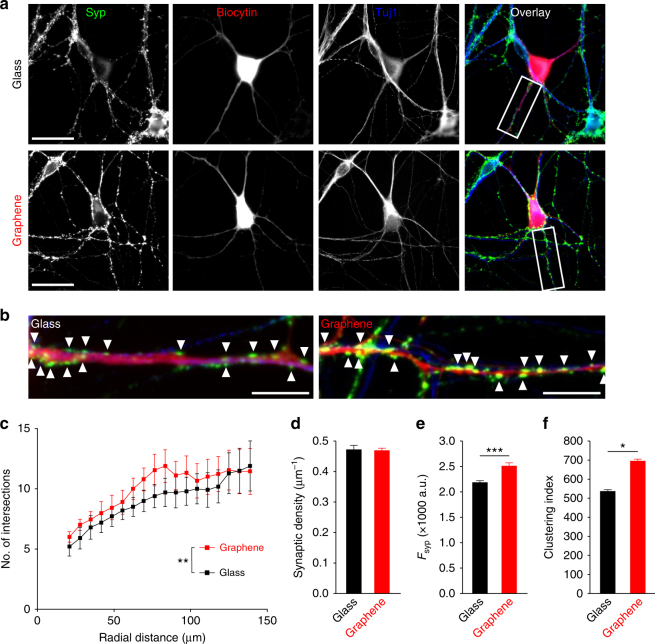
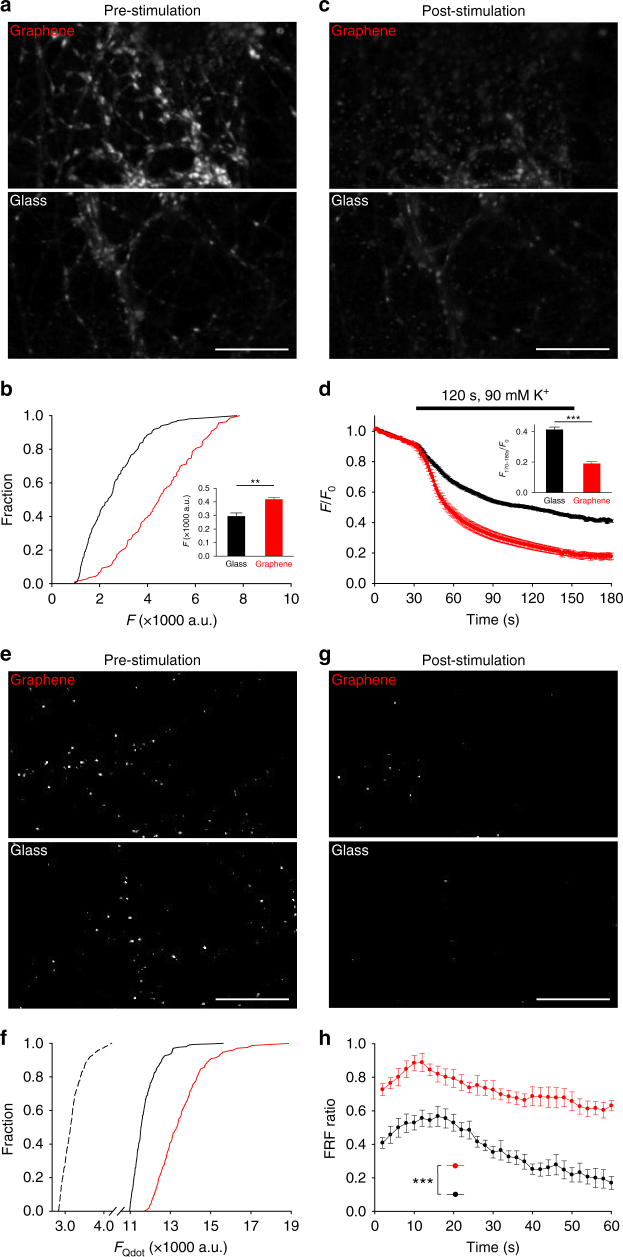
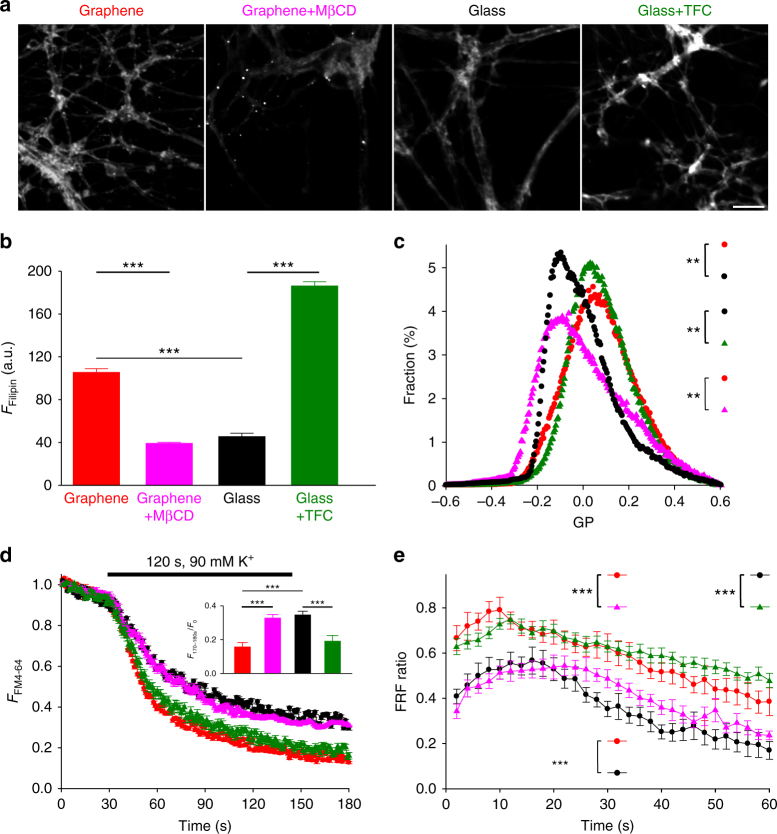
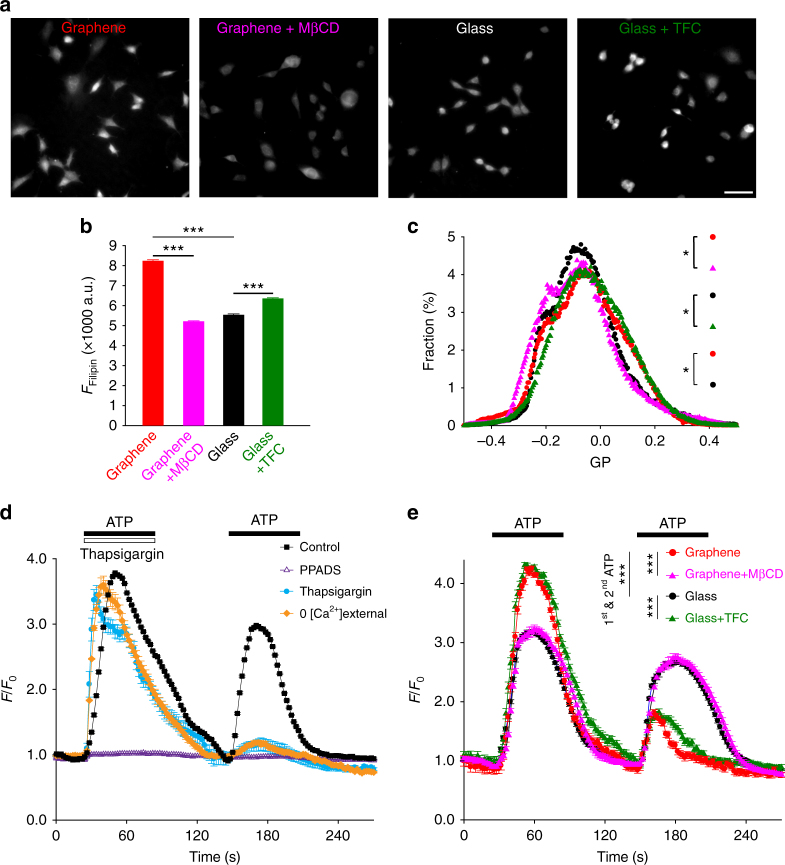
Graphene possesses extraordinary properties that promise great potential in biomedicine. However, fully leveraging these properties requires close contact with the cell surface, raising the concern of unexpected biological consequences. Computational models have demonstrated that graphene preferentially interacts with cholesterol, a multifunctional lipid unique to eukaryotic membranes. Here we demonstrate an interaction between graphene and cholesterol. We find that graphene increases cell membrane cholesterol and potentiates neurotransmission, which is mediated by increases in the number, release probability, and recycling rate of synaptic vesicles. In fibroblasts grown on graphene, we also find an increase in cholesterol, which promotes the activation of P2Y receptors, a family of receptor regulated by cholesterol. In both cases, direct manipulation of cholesterol levels elucidates that a graphene-induced cholesterol increase underlies the observed potentiation of each cell signaling pathway. These findings identify cholesterol as a mediator of graphene's cellular effects, providing insight into the biological impact of graphene.


Conflict of interest statement

The authors declare no competing financial interests.

Figures

Fig. 1
Fig. 1
Graphene interacts with cholesterol. a Cholesterol concentrations (based on the working curve generated from cholesterol standards, gray circles and line) in fresh serum-containing (orange triangle), untreated (black triangle), PVP-treated (green triangle), graphene-treated media (blue triangle), and graphene incubated with media (red triangle). n = 4 samples per batch, N = 4 total batches. Error bars are S.E.M. b Spectrofluorometer measurements of BODIPY (dashed line) and TFC (solid line) emission after 1-h incubation with graphene (light or dark red), adjusted for the concentration-dependent broadband absorbance of graphene (Supplementary Figure 1) and normalized to the maximum value of 0 mg L-1 graphene and minimum value of 10 mg L-1 graphene at each measured wavelength for both dyes
Fig. 2
Fig. 2
Characterization of graphene films. a Bright field image shows the field of view. Scale bar, 1 mm. b Raman spectrum at the graphene-covered area shows characteristic G and 2D peaks. The high 2D vs. G ratio and a symmetric 2D peak are consistent with those of monolayer graphene. Corresponding spatially resolved map of c Raman G-peak intensity and d 2D-peak intensity from the same field of view. Scale bar, 1 mm. e Bright field image shows the edge of a Matrigel droplet (upper-left) on a graphene-coated glass coverslip. f Corresponding Raman 2D-peak intensity map. Scale bar, 5 μm. g Raman spectrum of the bare graphene area (black) shows a high 2D vs. G ratio and a symmetric 2D peak, indicating monolayer graphene. At the Matrigel-coated graphene area (red), there is a strong reduction of intensity of both the G and 2D peaks. h Bright field image shows the edge of a cell (upper left) growing on a graphene-coated glass coverslip. i Corresponding Raman 2D-peak intensity map. Scale bar, 5 μm. j Raman spectrum at the cell-covered graphene area (red) also exhibits an intensity reduction for both G and 2D peaks in comparison with that at the bare graphene area (black)
Fig. 3
Fig. 3
Graphene increases cell membrane cholesterol. a Sample images of Filipin staining. Scale bar, 100 μm. b Filipin fluorescence intensity in neuronal neurites (nglass = 118 and ngraphene = 112 neurites, N = 3 batches, ***p < 0.001, Wilcoxin rank-sum test, Cohen’s d = 1.89). c Sample generalized polarization (GP) images. Scale bar, 20 μm. d Distributions of GP values over individual image pixels (n = 7 FOVs, N = 3 batches; p< 0.05, Kolmogorov–Smirnov test of the distributions of GP values, see 'Statistical analysis' section in Methods). Error bars are S.E.M.
Fig. 4
Fig. 4
Graphene increases synaptic membrane cholesterol. a Sample images of TopFluor-Cholesterol (TFC) staining of neurons. Scale bar, 10 μm. b Average TFC staining intensity of threshold defined ROIs (n = 9 FOVs, N = 3 batches, **p< 0.01, two-tailed t-test). c Sample images of FM4-64 staining of neurons. Same scale bar as a. Arrowheads indicate examples of synaptic boutons defined by FM4-64 labeling. d Overlay of a and b, arrowheads from b. e ∆FM 4-64 fluorescence intensity (see Methods) vs. TFC intensity in FM4-64-defined synaptic boutons (both n = 9 FOVs, N = 3 batches; p< 0.05, two-tailed t-test). Linear regression fittings indicate correlation for graphene (FTFC = 1.2083 × FFM4-64−253.29 a.u., Pearson correlation coefficient = 0.6629, red solid line) and glass (FTFC = 0.6273 × FFM4-64 + 837.85 a.u., Pearson correlation coefficient = 0.5698, black solid line). Error bars are S.E.M.
Fig. 5
Fig. 5
Graphene increases spontaneous firing frequency in neurons. a Sample traces from neurons on glass (black) or graphene (red). b Mean sEPSC amplitudes (nglass = 13 cells, ngraphene = 15 cells, N > 4 batches; p > 0.1, two-tailed t-test, Cohen’s d = 0.10). c Mean sEPSC inter-event intervals (nglass = 13 cells, ngraphene = 15 cells, N > 4 batches, *p < 0.05, two-tailed t-test, Cohen’s d = 1.30). d INMDAR/IAMPAR (nglass = 10 cells, ngraphene = 9 cells, N > 3 batches; p > 0.1, two-tailed t-test, Cohen’s d = 0.27). Error bars are S.E.M.
Fig. 6
Fig. 6
Morphological comparison of neurons on glass or graphene. a Sample images of immunofluorescence staining for the synaptic vesicle marker, Synaptophysin (Syp, green), and neuron-specific class III β-tubulin (TuJ1, blue) in recorded cells (biocytin filled, red). Scale bar, 30 μm. b Inset regions from the sample images are indicated by white boxes. Scale bar, 15 μm. Arrowheads indicate examples of Syp puncta. c Sholl analysis (**p = 0.01, F(1,323) = 6.7, two-way ANOVA with repeated measures followed by a Bonferroni multiple comparisons test, ω2 = 0.017, nglass = 12 cells, ngraphene = 11 cells, N > 4 batches). d Lateral density of Syp puncta along the neurites of recorded neurons (Tuj1-positive and biocytin-positive) (nglass = 12 cells, ngraphene = 11 cells, N > 4 batches; p > 0.1, two-tailed t-test). e Average Syp immunostaining (n > 10,000 synapses analyzed, N > 3 batches, ***p < 0.001, two-tailed t-test, Cohen’s d = 0.500). f Average Syp clustering within individual synaptic boutons (n ≥ 3 FOVs, N = 3 batches; *p< 0.05, two-tailed t-test, Cohen’s d = 0.65). Error bars are S.E.M.
Fig. 7
Fig. 7
Graphene induces presynaptic potentiation. a Sample images of FM1-43 labeling. Scale bar, 30 μm. b Cumulative distributions of FM1-43 intensities at synaptic boutons (black, glass; red, graphene, same color coding hereafter). nglass = 207 ROIs, ngraphene = 139 ROIs, N = 3; p < 0.05, Kolmogorov–Smirnov test). Inset. Average FM1-43 fluorescence. **p < 0.01, two-tailed t-test. c Sample images of FM1-43 labeling after destaining. Scale bar, 30 μm. d FM1-43 fluorescence during destaining. Inset is average fluorescence from 170 to 180 s (nglass = 207 ROIs, ngraphene = 139 ROIs, N = 3; ***p < 0.001, two-tailed t-test). e Sample images of single Qdot loading. Scale bar, 30 μm. f Cumulative distributions of Qdot intensity after background subtraction in ROIs defined by retrospective FM4-64 labeling (single Qdot loading, dotted line; total recycling pool loading, solid lines). The average single Qdot intensity after background subtraction is 378 ± 41 a.u. The average total Qdot intensities after background subtraction are 8787 ± 156 a.u. for glass and 11,050 ± 224 a.u. for graphene (nglass = 187 ROIs, ngraphene = 211 ROIs, N = 4; p < 0.001, Kolmogorov–Smirnov test). The estimated average numbers of total recycling vesicles are 23.2 for glass and 29.2 for graphene. g Sample images of single Qdot labeling after stimulation. Scale bar, 30 μm. h Fast-and-reversible fusion (FRF) ratio (out of all fusion events) during 1-min 10-Hz field stimulation (nglass = 174 ROIs, ngraphene = 181 ROIs, N = 3; ***p < 0.001, two-tailed t-test on the average FRF values from a five-frame window at the end of each time course). Error bars are S.E.M.
Fig. 8
Fig. 8
Cholesterol mediates graphene-induced presynaptic changes. a Sample Filipin staining images of neurites on graphene with (purple) or without (red) MβCD treatment and on glass with (green) or without (black) TFC loading. Scale bar, 50 μm. Same color coding hereafter. b Average Filipin staining intensities in neurites (ngraphene = 107 neurites, ngraphene+MβCD = 151 neurites, nglass = 188 neurites, nglass+TFC = 152 neurites, N = 3 batches for every group; for graphene vs. graphene+MβCD, graphene vs. glass, and glass vs. glass+TFC, ***p < 0.001, all Wilcoxin rank-sum tests). c Distributions of GP values over individual image pixels (n = 6 FOVs, N = 3 batches for every group; for graphene vs. graphene+MβCD and glass vs. glass+TFC, both **p < 0.01, for graphene vs. glass+TFC, p = 0.073, Kolmogorov–Smirnov test of the distributions of GP values, see 'Statistical analysis' section in Methods). d FM 4-64 fluorescence changes before and during 2-min 90-mM K+ and (inset) average fluorescence decrease using a five-frame window at the end of the stimulation period (n = 6 FOVs, N = 3 batches per group; for graphene vs. graphene+MβCD, graphene vs. glass, and glass vs. glass+TFC, ***p < 0.001, for graphene vs. glass+TFC and graphene+MβCD vs. glass, N.S. p > 0.05, all two-tailed t-tests). e FRF ratios during 1-min 30-Hz electrical stimulation (n = 3 FOVs, N = 3; for graphene vs. graphene+MβCD and glass vs. glass+TFC, both ***p < 0.05, two-tailed t-tests on the average of a five-frame window at the end of the stimulation period). Error bars are S.E.M.
Fig. 9
Fig. 9
Graphene enhances P2Y receptor-mediated Ca2+ responses. a Sample images of Filipin staining of 3T3 cells on graphene with (purple) or without (red) MβCD treatment and on glass with (green) or without (black) TFC loading. Same color coding hereafter. Scale bar, 50 μm. b Average intensities of Filipin staining (ngraphene = 1536 cells, ngraphene+MBCD = 2286 cells, nglass = 1317 cells, nglass+TFC = 1487 cells, N = 3 batches for every group; for graphene vs. graphene+MβCD, graphene vs. glass, and glass vs. glass+TFC, ***p < 0.001, all Wilcoxin rank-sum tests). c Distributions of GP values over individual image pixels (n = 6 FOVs, N = 3 batches; for graphene vs. graphene+MβCD graphene vs. glass, glass vs. glass+TFC, all *p < 0.05, for graphene vs. glass+TFC, p > 0.05, Kolmogorov–Smirnov test of the distributions of GP values, see 'Statistical analysis' in the Methods section). d Two consecutive 100-µM ATP applications elicited the release of Ca2+ from internal Ca2+ stores (n = 6 FOVs, N = 3 batches for every condition). The second Ca2+ response was smaller than the first with a 1 min interval between. Both Ca2+ responses were blocked by 50 μM PPADS (pyridoxalphosphate-6-azophenyl-2’,4’-disulphonic acid), a P2YR inhibitor (white triangles). Thapsigargin 1 μM (blue dots) elicited a similar Ca2+ response as ATP but significantly reduced the second response by exhausting internal Ca2+ stores. In the absence of extracellular Ca2+ (the source for refilling internal Ca2+ stores) (orange diamonds), the second response was also significantly reduced (n = 6 FOVs, N = 3 batches for every condition). e ATP-elicited Ca2+ release from internal stores was facilitated by graphene or TFC pretreatment and reduced by MβCD (n = 6 FOVs, N = 3 batches for every group; for graphene vs. graphene+MβCD, graphene vs. glass, and glass vs. glass+TFC, ***p < 0.001, two-tailed t-tests). Error bars are S.E.M.

Similar articles

Cited by

References

    1. Novoselov KS, et al. Electric field effect in atomically thin carbon films. Science. 2004;306:666–669. doi: 10.1126/science.1102896. - DOI - PubMed
    1. Geim AK. Graphene: status and prospects. Science. 2009;324:1530–1534. doi: 10.1126/science.1158877. - DOI - PubMed
    1. Novoselov KS, et al. A roadmap for graphene. Nature. 2012;490:192–200. doi: 10.1038/nature11458. - DOI - PubMed
    1. Bitounis D, Ali-Boucetta H, Hong BH, Min DH, Kostarelos K. Prospects and challenges of graphene in biomedical applications. Adv. Mater. 2013;25:2258–2268. doi: 10.1002/adma.201203700. - DOI - PubMed
    1. Mao HY, et al. Graphene: promises, facts, opportunities, and challenges in nanomedicine. Chem. Rev. 2013;113:3407–3424. doi: 10.1021/cr300335p. - DOI - PubMed

Publication types