. 2018 Feb 23;8(1):3529.
doi: 10.1038/s41598-018-21389-8.

STAT3 regulates cytotoxicity of human CD57+ CD4+ T cells in blood and lymphoid follicles

Affiliations

STAT3 regulates cytotoxicity of human CD57+ CD4+ T cells in blood and lymphoid follicles

Jalila Alshekaili et al. Sci Rep. .

Abstract

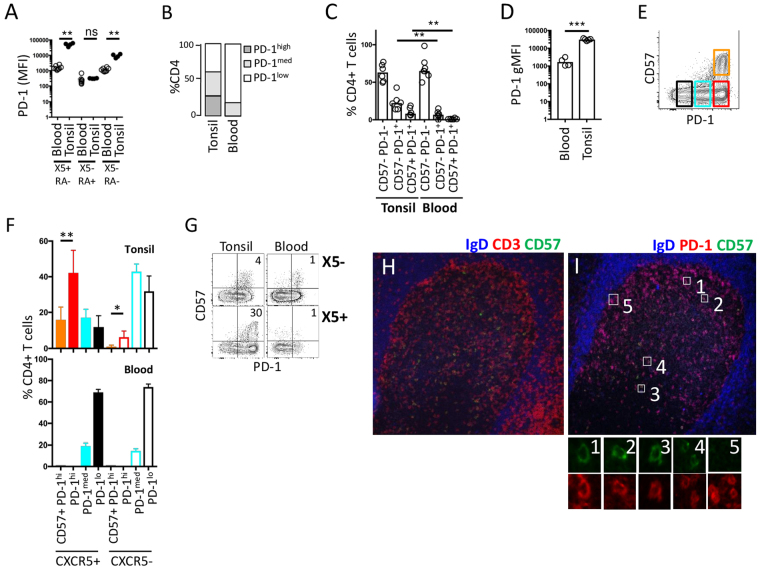
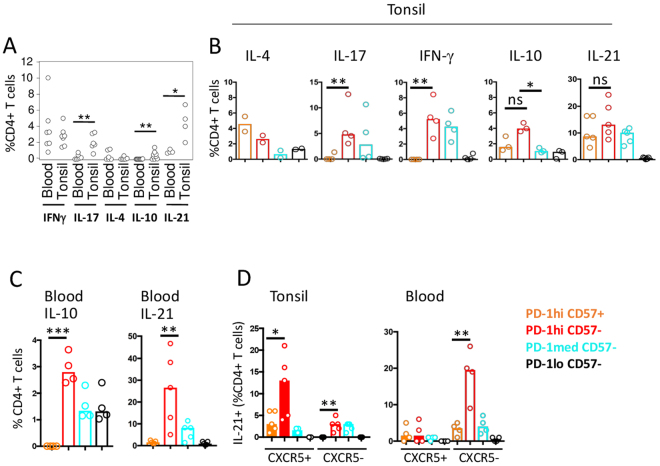
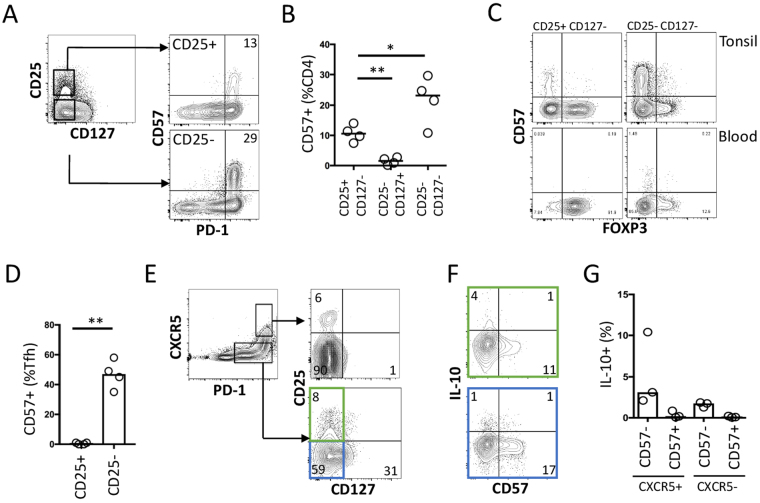
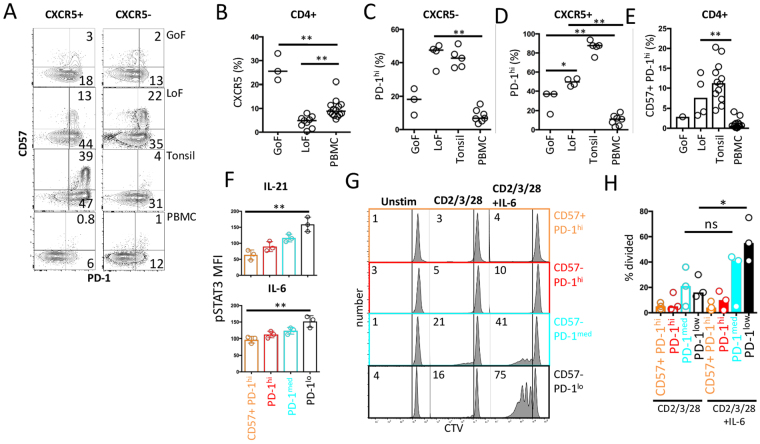
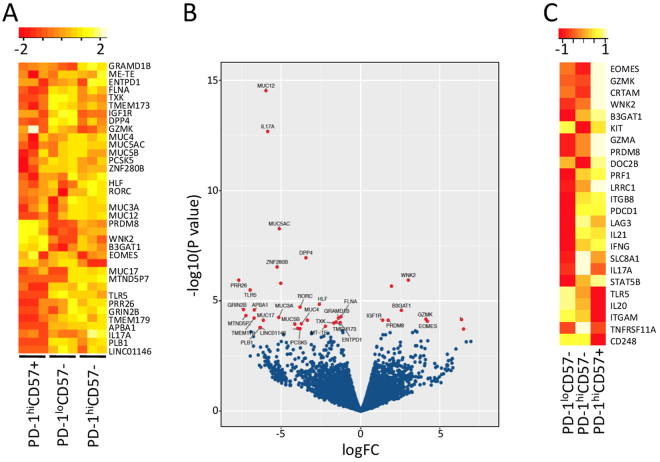
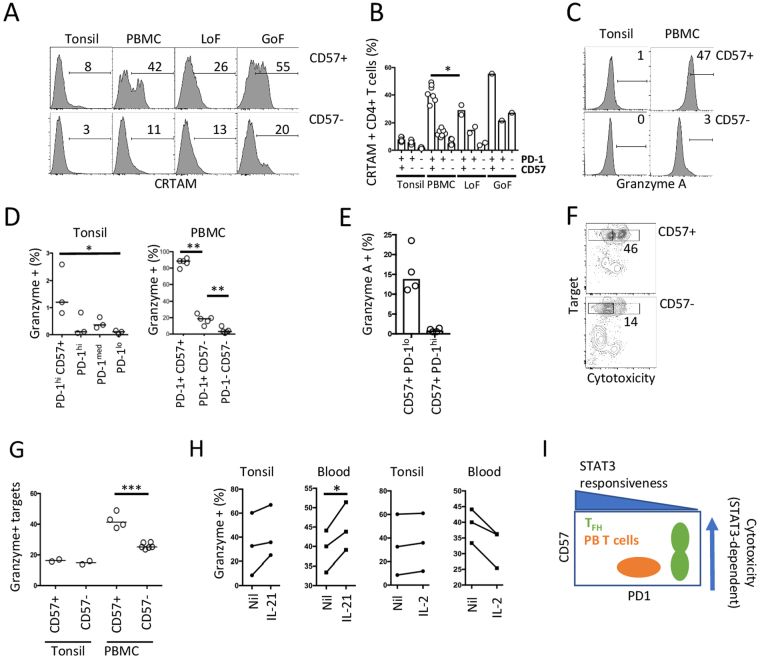
A subset of human follicular helper T cells (TFH) cells expresses CD57 for which no distinct function has been identified. We show that CD57+ TFH cells are universally PD-1hi, but compared to their CD57- PD-1hi counterparts, express little IL-21 or IL-10 among others. Instead, CD57 expression on TFH cells marks cytotoxicity transcriptional signatures that translate into only a weak cytotoxic phenotype. Similarly, circulating PD-1+ CD57+ CD4+ T cells make less cytokine than their CD57- PD-1+ counterparts, but have a prominent cytotoxic phenotype. By analysis of responses to STAT3-dependent cytokines and cells from patients with gain- or loss-of-function STAT3 mutations, we show that CD4+ T cell cytotoxicity is STAT3-dependent. TFH formation also requires STAT3, but paradoxically, once formed, PD-1hi cells become unresponsive to STAT3. These findings suggest that changes in blood and germinal center cytotoxicity might be affected by changes in STAT3 signaling, or modulation of PD-1 by therapy.


Conflict of interest statement

The authors declare no competing interests.

Figures

Figure 1
Figure 1
Distribution of CD57+ CD4+ T cells in blood and tonsil. (A) Summary of expression (mean fluorescence) of PD-1 by CD4+ T cell subsets defined as TFH (CXCR5+, X5+; CD45RA−; RA−), conventional memory (CXCR5−, X5−; CD45RA−, RA−), and naïve (CXCR5−, X5−; CD45RA+, RA+) in blood (n = 10) and tonsil (n = 4). (B) Summary of relative abundance in PBMC (n = 10) and tonsil (n = 4) of CD4+ T cells defined according to PD-1 levels (low, medium and high), using mean data from part A. (C) Summary of flow cytometric analysis of single cell suspensions from tonsil (n = 6) and PBMC (n = 7), indicating the proportion of cells within the indicated subsets. (D) Summary of mean fluorescence levels of PD-1 on CD57+ CD4+ T cells from blood (n = 4) and tonsil. (n = 7) (E). Representative flow cytometric analysis of four CD4+ T cell tonsil subsets determined by PD-1 and CD57 expression. (F) Summary of abundance of CD57 and PD-1 expression in blood and tonsil according to presence or absence of CXCR5. Tonsil, n = 4; blood, n = 4. (G) Representative flow cytometry of tonsil and blood suspensions for expression of PD-1 and CD57 in CXCR5+ (X5+) and CXCR5− (X5−) compartments. (H,I) Representative immunofluorescence images of CD57+ T cells in sections of tonsil, stained for CD57, CD3 and IgD (F) and IgD, PD-1 and CD57. Higher magnification of individual cells is shown below. *p < 0.05, **p < 0.01, ***p < 0.001 (Fig. 1A,C,D and F).
Figure 2
Figure 2
Cytokine production according to PD-1 and CD57 expression. (A) Summary of relative abundance of CD4+ T cells expressing the indicated cytokines in tonsil and blood, determined by intracellular staining and flow cytometry of paired samples from individual donors (n = 7, except for IL-21 where n = 4). (B) Summary of relative abundance of intracellular cytokines in purified CD4+ T cell subsets defined in Fig. 1H. Each symbol indicates a result from a different donor (IL-4, n = 2; IL-17, n = 4; IFN-γ, n = 4; IL-10, n = 3; IL-21, n = 5). (C) Summary of relative abundance of IL-21 (n = 5) and IL-10 (n = 4) positive cells in peripheral blood subsets. (D) Summary of abundance of IL-21 producing cells in each indicated CD4+ T cell subset from tonsil (n = 5) or blood (n = 4), analysed according to CXCR5 expression. *p < 0.05; **p < 0.01, ***p < 0.001.
Figure 3
Figure 3
CD57+ CD4+ T cells are not enriched with TFR cells. (A) Flow cytometric analysis of either CD25+ CD127− or CD25− CD127− CD4+ T cells for expression of CD57 and PD-1. (B) Summary of analysis in (A) (n = 4). (C) Representative analysis of CD4+ CD25+ CD127− T cells obtained from either blood or tonsil for FOXP3 and CD57 expression according to CD25+ or CD25− co-expression. (D) Summary of CD57+ cells within CD25+ or CD25− TFH (CXCR5hi PD-1hi) (n = 4). (E) Analysis of TFH and non-TFH PD-1+ cells for expression of CD25 and CD127. (F,G) Analysis and summary of proportion of IL-10 expression in CD57+ cells after gating on indicated regions in (E) (n = 3). *p < 0.05; **p < 0.01.
Figure 4
Figure 4
STAT3 modifies abundance of CD57+ CD4+ T cells. (A) Representative flow cytometric analysis of abundance of CD57+ cells in CXCR5+ and CXCR5− compartments in blood from patients with STAT3 loss-of-function (LoF), gain-of-function (GoF) mutations, or from PBMC of normal donors, or tonsil. (B) Summary of TFH cells (CXCR5+ CD45RA−) cells from STAT3 GoF (n = 3), STAT3 LoF (n = 9) or normal donors (n = 15). (C,D) Summary of abundance of PD-1hi cells (as a percentage of total CD4+ T cells) in CXCR5− (C) and CXCR5+ (D) compartments in PBMCs from STAT3 GoF (n = 3), LoF (n = 4), healthy donors (n = 7) or tonsil (n = 5). (E) Summary of PD-1+ CD57+ subset of CD4+ T cells in each indicated group, STAT3 GoF (n = 1), LoF (n = 4), healthy donors (n = 14) or tonsil (n = 12). (F) Summary of phosphorylated STAT3 expression after stimulation of each PD-1 and CD57+ subset with either IL-6, IL-21 (n = 3). (G). Representative flow cytometric analysis of ex vivo proliferation on day 4 of each purified CD4+ T cell subset (as labelled) after stimulation with CD2/3/28 in the presence or absence of IL-6. (H) Summary of proliferation of CD4+ T cell subsets (n = 3). *p < 0.05; **p < 0.01.
Figure 5
Figure 5
Analysis of global gene expression. (A) Relative gene expression (determined by RNA-Seq) in purified PD-1hi CD57+, PD-1hi CD57− and PD-1lo CD57− cells (n = 3 biological replicates per subset). (B) Volcano plot showing log fold change on x-axis and Log P Value on y-axis in the PD-1hi CD57+ versus PD-1hi CD57− cells comparison. The tonsil 2 samples were excluded from this analysis. Genes reaching statistical significance (FDR < 0.1) are highlighted (red). (C) Heatmap of average expression values (excluding T2) for the 3 conditions PD-1hi CD57+ vs PD-1lo CD57−, (column 2) and PD-1hi CD57− vs PD-1lo CD57− (column 1) comparisons (n = 2 biological replicates).
Figure 6
Figure 6
Cytotoxicity phenotype in CD57+ CD4+ T cells. (A) Representative flow cytometric analysis of CRTAM expression in tonsil (n = 3) and blood (n = 7) CD4+ T cells from healthy donors, or patients with STAT3 LoF (n = 2) or GoF (n = 1), gated on PD-1+ CD57− or PD-1+ CD57+, with summary results (B). (C) Representative analysis of intracellular granzyme A expression in tonsil and blood gated on PD-1hi CD57− or PD-1hi CD57+. (D) Summary of granzyme positive cells in tonsil (n = 3) and PBMC (n = 5) in CD4+ T cell subsets defined by PD-1 and CD57. (E) Summary of percentage of granzyme positive cells in PD-1hi and PD-1medium CD57+ CD4+ T cells. (F,G) Representative flow cytometric analysis of cytotoxicity of target cells co-cultured with CD57+ or CD57− CD4+ T cells, expressed graphically in E, in tonsil (n = 2) and PBMC (n = 4), summary in G. (H) Summary of granzyme A induction on day 2 by PBMC (n = 3) and tonsil (n = 3) cells in response to IL-21 or IL-2. Paired results from each donor are connected. (I) Model relating CD57 and PD-1 expression to STAT3 responsiveness. *p < 0.05; **p < 0.01, ***p < 0.001.

References

    1. Förster R, et al. A putative chemokine receptor, BLR1, directs B cell migration to defined lymphoid organs and specific anatomic compartments of the spleen. Cell. 1996;87:1037–1047. doi: 10.1016/S0092-8674(00)81798-5. - DOI - PubMed
    1. Ansel KM, McHeyzer-Williams LJ, Ngo VN, McHeyzer-Williams MG, Cyster JG. In vivo-activated CD4 T cells upregulate CXC chemokine receptor 5 and reprogram their response to lymphoid chemokines. J. Exp. Med. 1999;190:1123–1134. doi: 10.1084/jem.190.8.1123. - DOI - PMC - PubMed
    1. Hardtke S, Ohl L, Förster R. Balanced expression of CXCR5 and CCR7 on follicular T helper cells determines their transient positioning to lymph node follicles and is essential for efficient B-cell help. Blood. 2005;106:1924–1931. doi: 10.1182/blood-2004-11-4494. - DOI - PubMed
    1. Schaerli P, et al. CXC chemokine receptor 5 expression defines follicular homing T cells with B cell helper function. J. Exp. Med. 2000;192:1553–1562. doi: 10.1084/jem.192.11.1553. - DOI - PMC - PubMed
    1. Breitfeld D, et al. Follicular B helper T cells express CXC chemokine receptor 5, localize to B cell follicles, and support immunoglobulin production. J. Exp. Med. 2000;192:1545–1552. doi: 10.1084/jem.192.11.1545. - DOI - PMC - PubMed

Publication types

MeSH terms