

Depth matters: effects of precipitation regime on soil microbial activity upon rewetting of a plant-soil system
- PMID: 29476139
- PMCID: PMC5864200
- DOI: 10.1038/s41396-018-0079-z
Depth matters: effects of precipitation regime on soil microbial activity upon rewetting of a plant-soil system
Abstract
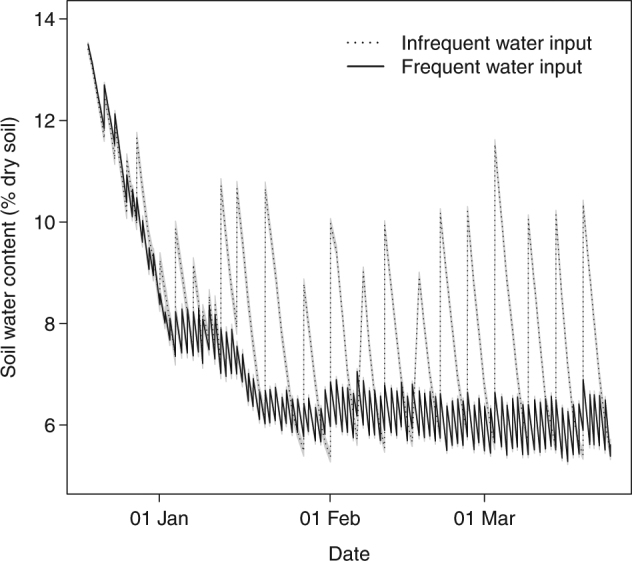
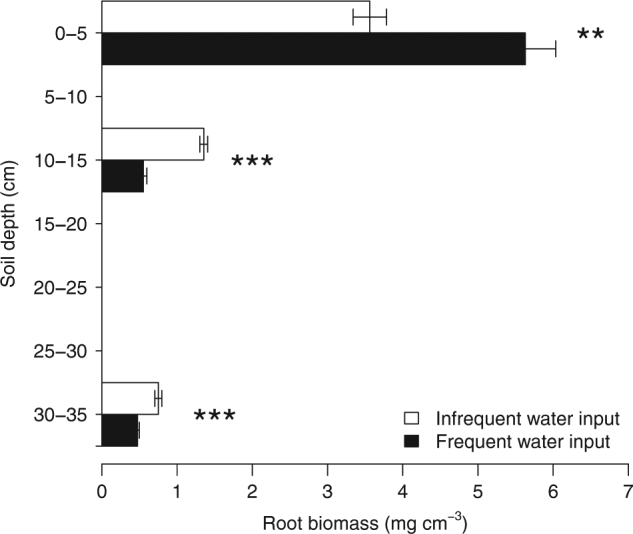
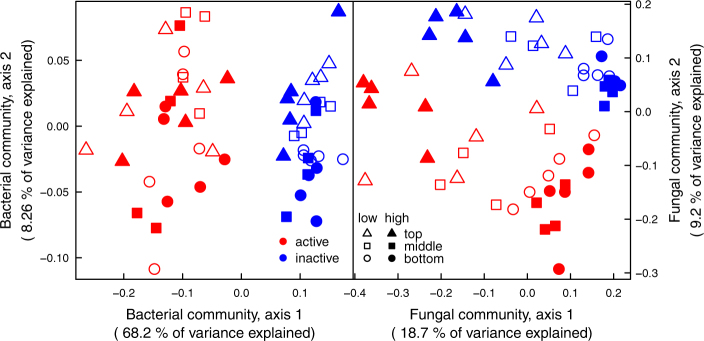
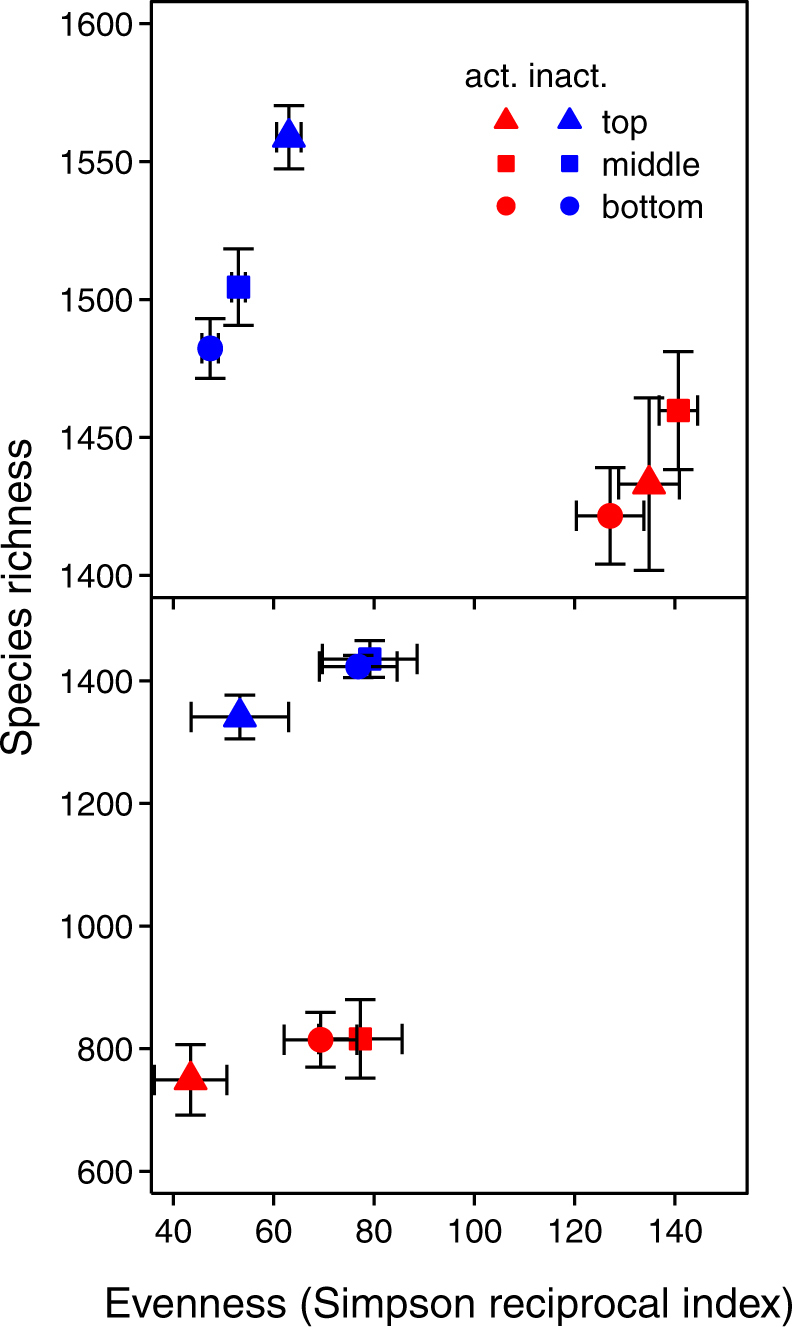
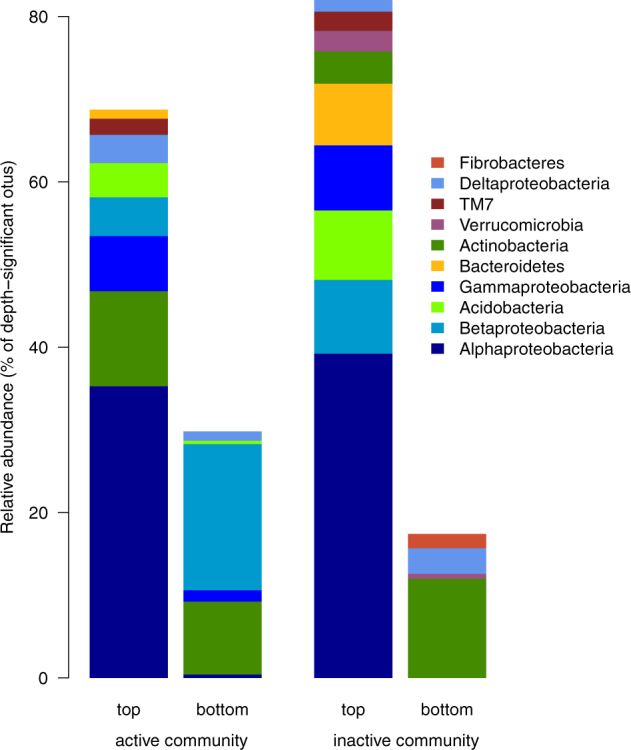
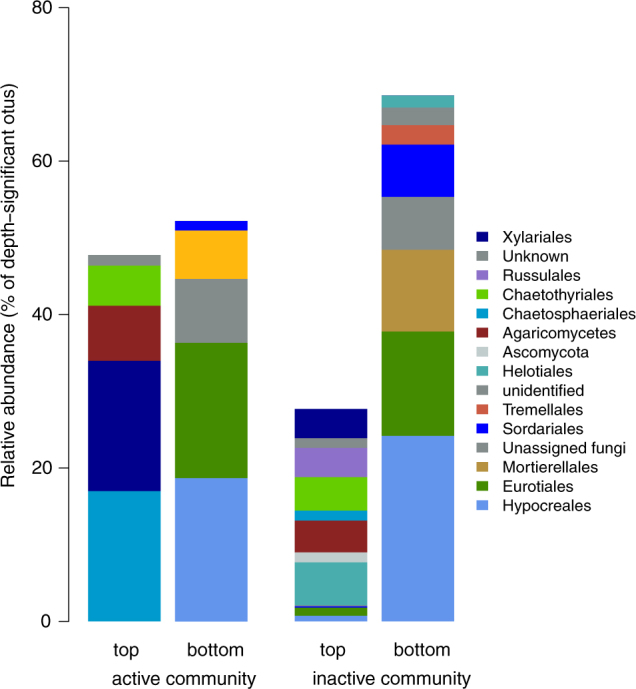
Changes in frequency and amplitude of rain events, that is, precipitation patterns, result in different water conditions with soil depth, and likely affect plant growth and shape plant and soil microbial activity. Here, we used 18O stable isotope probing (SIP) to investigate bacterial and fungal communities that actively grew or not upon rewetting, at three different depths in soil mesocosms previously subjected to frequent or infrequent watering for 12 weeks (equal total water input). Phylogenetic marker genes for bacteria and fungi were sequenced after rewetting, and plant-soil microbial coupling documented by plant 13C-CO2 labeling. Soil depth, rather than precipitation pattern, was most influential in shaping microbial response to rewetting, and had differential effects on active and inactive bacterial and fungal communities. After rewetting, active bacterial communities were less rich, more even and phylogenetically related than the inactive, and reactivated throughout the soil profile. Active fungal communities after rewetting were less abundant and rich than the inactive. The coupling between plants and soil microbes decreased under infrequent watering in the top soil layer. We suggest that differences in fungal and bacterial abundance and relative activity could result in large effects on subsequent soil biogeochemical cycling.
Conflict of interest statement
The authors declare that they have no conflict of interest.
Figures
References
-
- IPCC. Climate change 2007: impacts, adaptation and vulnerability. Contribution of Working Group II to the Fourth Assessment Report of the Intergovernmental Panel on Climate Change. Cambridge, UK: Cambridge University Press; 2007.
-
- Sowerby A, Emmett BA, Tietema A, Beier C. Contrasting effects of repeated summer drought on soil carbon efflux in hydric and mesic heathland soils. Glob Change Biol. 2008;14:2388–404. doi: 10.1111/j.1365-2486.2008.01643.x. - DOI
-
- Bloor JMG, Bardgett RD. Stability of above-ground and below-ground processes to extreme drought in model grassland ecosystems: interactions with plant species diversity and soil nitrogen availability. Perspect Plant Ecol Evol Syst. 2012;14:193–204. doi: 10.1016/j.ppees.2011.12.001. - DOI
-
- Hartmann AA, Niklaus PA. Effects of simulated drought and nitrogen fertilizer on plant productivity and nitrous oxide (N2O) emissions of two pastures. Plant Soil. 2012;361:411–26. doi: 10.1007/s11104-012-1248-x. - DOI
Publication types
MeSH terms
Substances
LinkOut - more resources
Full Text Sources
Other Literature Sources
Medical
Miscellaneous
