

Coordinate and redox interactions of epinephrine with ferric and ferrous iron at physiological pH
- PMID: 29476145
- PMCID: PMC5824886
- DOI: 10.1038/s41598-018-21940-7
Coordinate and redox interactions of epinephrine with ferric and ferrous iron at physiological pH
Abstract
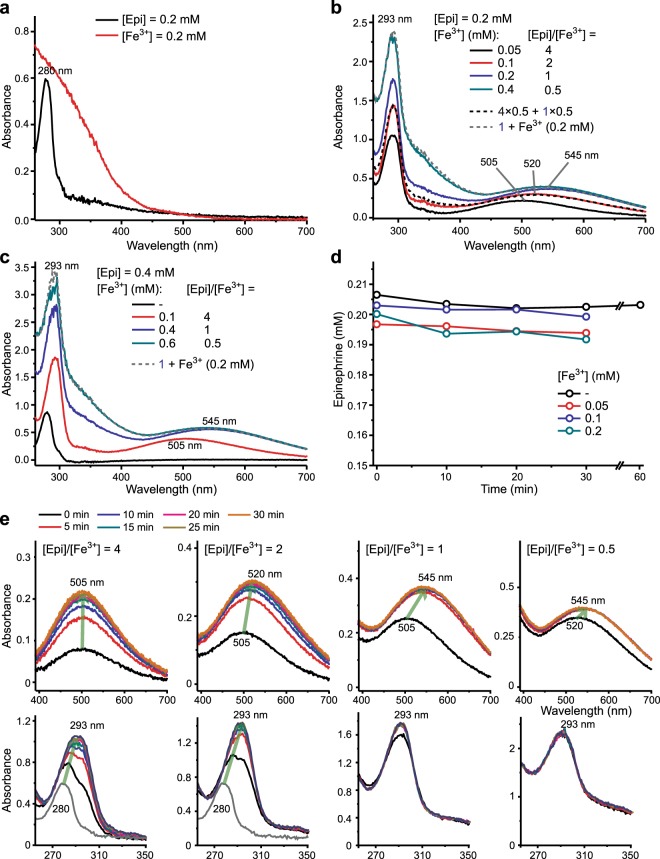
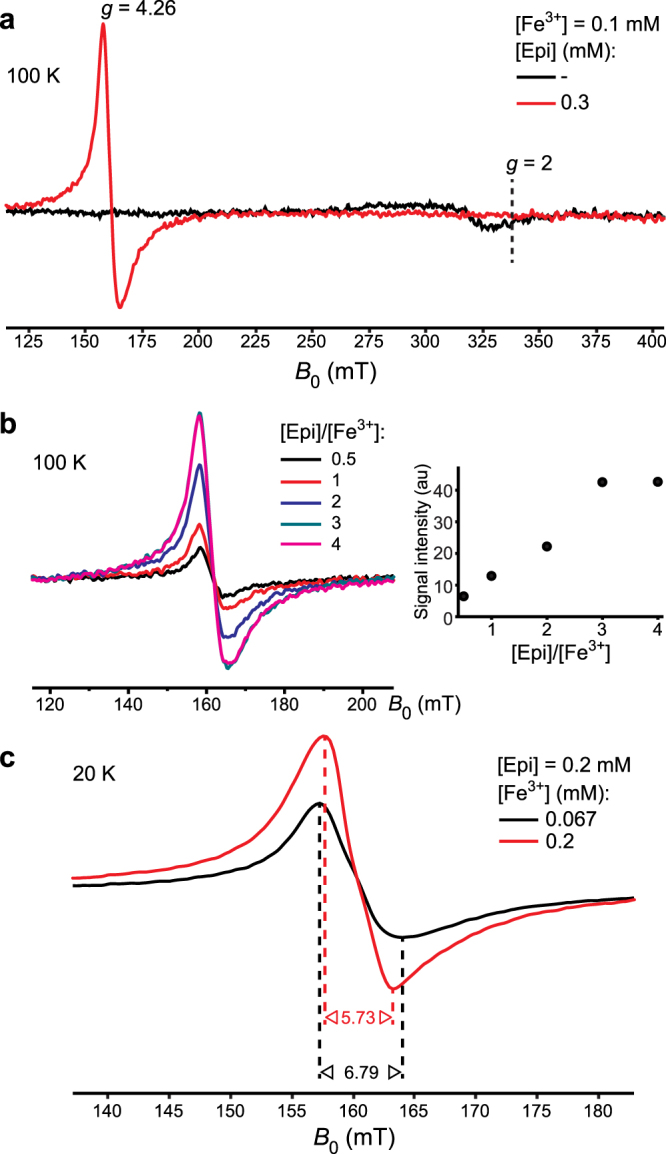
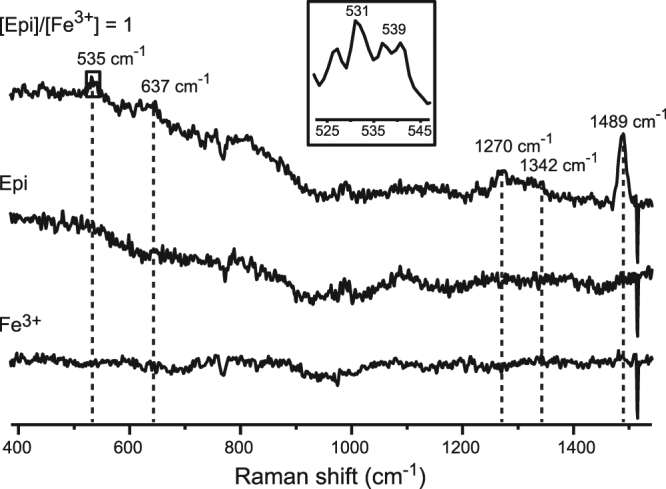
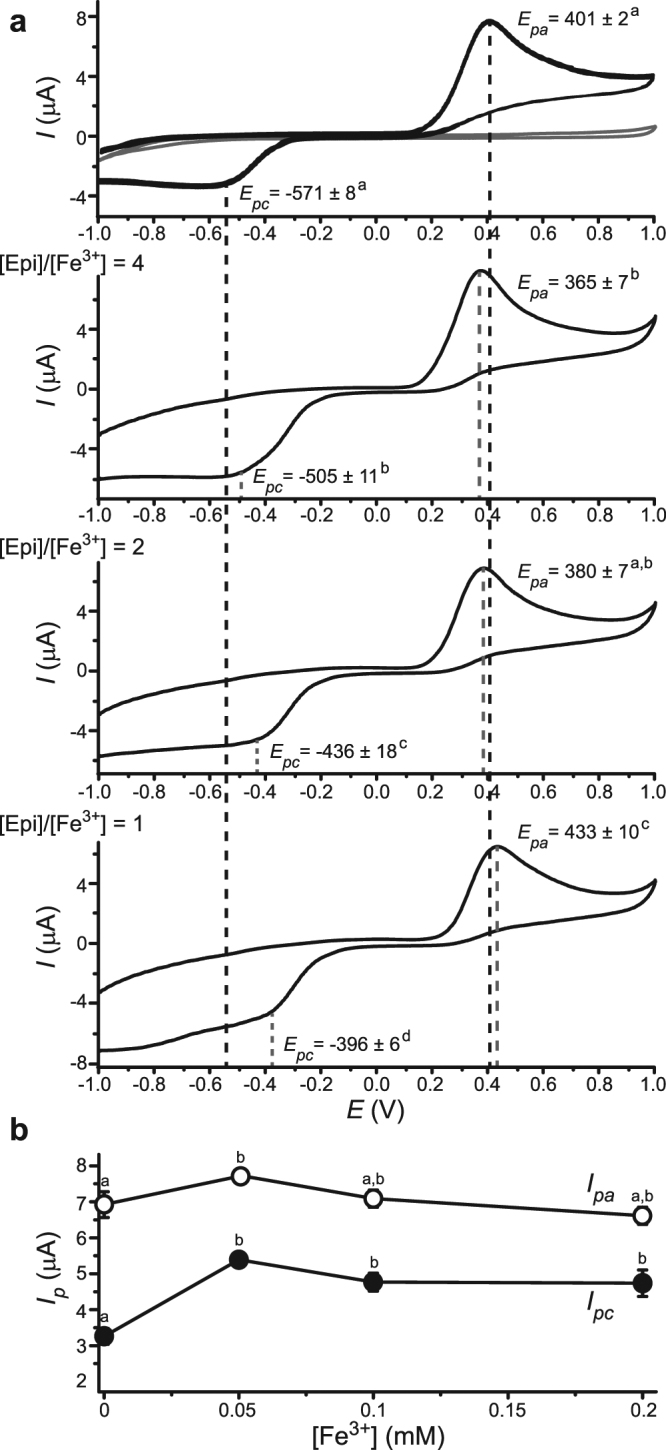
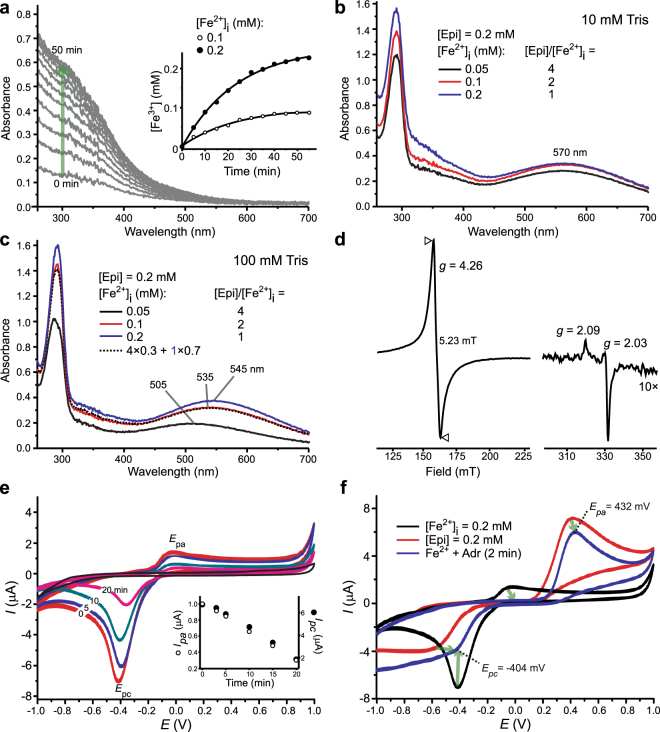
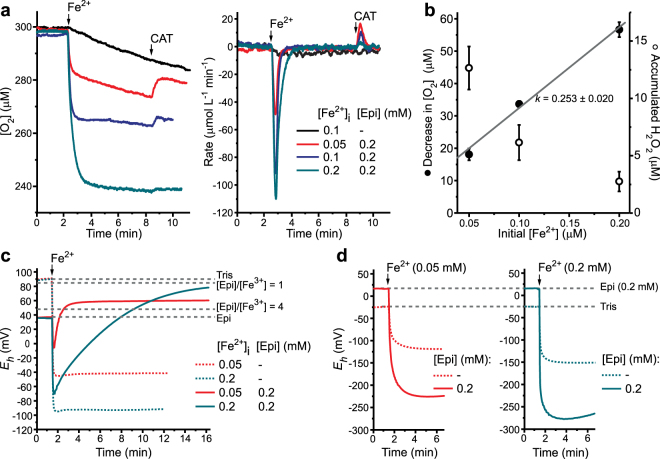
Coordinate and redox interactions of epinephrine (Epi) with iron at physiological pH are essential for understanding two very different phenomena - the detrimental effects of chronic stress on the cardiovascular system and the cross-linking of catecholamine-rich biopolymers and frameworks. Here we show that Epi and Fe3+ form stable high-spin complexes in the 1:1 or 3:1 stoichiometry, depending on the Epi/Fe3+ concentration ratio (low or high). Oxygen atoms on the catechol ring represent the sites of coordinate bond formation within physiologically relevant bidentate 1:1 complex. Redox properties of Epi are slightly impacted by Fe3+. On the other hand, Epi and Fe2+ form a complex that acts as a strong reducing agent, which leads to the production of hydrogen peroxide via O2 reduction, and to a facilitated formation of the Epi-Fe3+ complexes. Epi is not oxidized in this process, i.e. Fe2+ is not an electron shuttle, but the electron donor. Epi-catalyzed oxidation of Fe2+ represents a plausible chemical basis of stress-related damage to heart cells. In addition, our results support the previous findings on the interactions of catecholamine moieties in polymers with iron and provide a novel strategy for improving the efficiency of cross-linking.
Conflict of interest statement
The authors declare no competing interests.
Figures
Similar articles
-
Iron-catalyzed oxidation of arsenic(III) by oxygen and by hydrogen peroxide: pH-dependent formation of oxidants in the Fenton reaction.Environ Sci Technol. 2003 Jun 15;37(12):2734-42. doi: 10.1021/es026208x. Environ Sci Technol. 2003. PMID: 12854713
-
Ferrous iron binding to epinephrine promotes the oxidation of iron and impedes activation of adrenergic receptors.Free Radic Biol Med. 2020 Feb 20;148:123-127. doi: 10.1016/j.freeradbiomed.2020.01.001. Epub 2020 Jan 3. Free Radic Biol Med. 2020. PMID: 31911148
-
Co-oxidation of As(III) and Fe(II) by oxygen through complexation between As(III) and Fe(II)/Fe(III) species.Water Res. 2018 Oct 15;143:599-607. doi: 10.1016/j.watres.2018.06.072. Epub 2018 Jun 30. Water Res. 2018. PMID: 30025352
-
Mechanisms of toxicity by and resistance to ferrous iron in anaerobic systems.Free Radic Biol Med. 2019 Aug 20;140:167-171. doi: 10.1016/j.freeradbiomed.2019.06.027. Epub 2019 Jun 25. Free Radic Biol Med. 2019. PMID: 31251977 Review.
-
Photo-chemical aspects of iron complexes exhibiting photo-activated chemotherapy (PACT).J Inorg Biochem. 2023 Jan;238:112055. doi: 10.1016/j.jinorgbio.2022.112055. Epub 2022 Oct 29. J Inorg Biochem. 2023. PMID: 36335746 Review.
Cited by
-
Epinephrine as a Therapeutic Agent for Hyperferritinemia in Diabetes Mellitus and Hypertension.Am J Case Rep. 2025 Apr 20;26:e947289. doi: 10.12659/AJCR.947289. Am J Case Rep. 2025. PMID: 40253583 Free PMC article.
-
Fluorescence Sensing Platforms for Epinephrine Detection Based on Low Temperature Cofired Ceramics.Sensors (Basel). 2020 Mar 5;20(5):1429. doi: 10.3390/s20051429. Sensors (Basel). 2020. PMID: 32151107 Free PMC article.
-
Bio-inspired chitosan/polydopamine-nanoparticle based sorbent bead: A versatile platform for separation and HPLC analysis of tetracycline antibiotics from various sample matrix.J Food Drug Anal. 2024 Dec 15;32(4):520-531. doi: 10.38212/2224-6614.3510. J Food Drug Anal. 2024. PMID: 39752864 Free PMC article.
References
-
- Rump AF, Rösen R, Klaus W. Cardioprotection by superoxide dismutase: a catecholamine-dependent process? Anesth Analg. Anesth. Analg. (Philadelphia, PA, U. S.) 1993;76:239–246. - PubMed
-
- Rump AF, Klaus W. Evidence for norepinephrine cardiotoxicity mediated by superoxide anion radicals in isolated rabbit hearts. Naunyn-Schmiedeberg’s Arch. Pharmacol. 1994;349:295–300. - PubMed
Publication types
MeSH terms
Substances
LinkOut - more resources
Full Text Sources
Other Literature Sources
Medical
