. 2018 Mar;20(3):285-295.
doi: 10.1038/s41556-018-0045-z. Epub 2018 Feb 23.

Recognition of RNA N6-methyladenosine by IGF2BP proteins enhances mRNA stability and translation

Affiliations

Recognition of RNA N6-methyladenosine by IGF2BP proteins enhances mRNA stability and translation

Huilin Huang et al. Nat Cell Biol. 2018 Mar.

Erratum in

Abstract

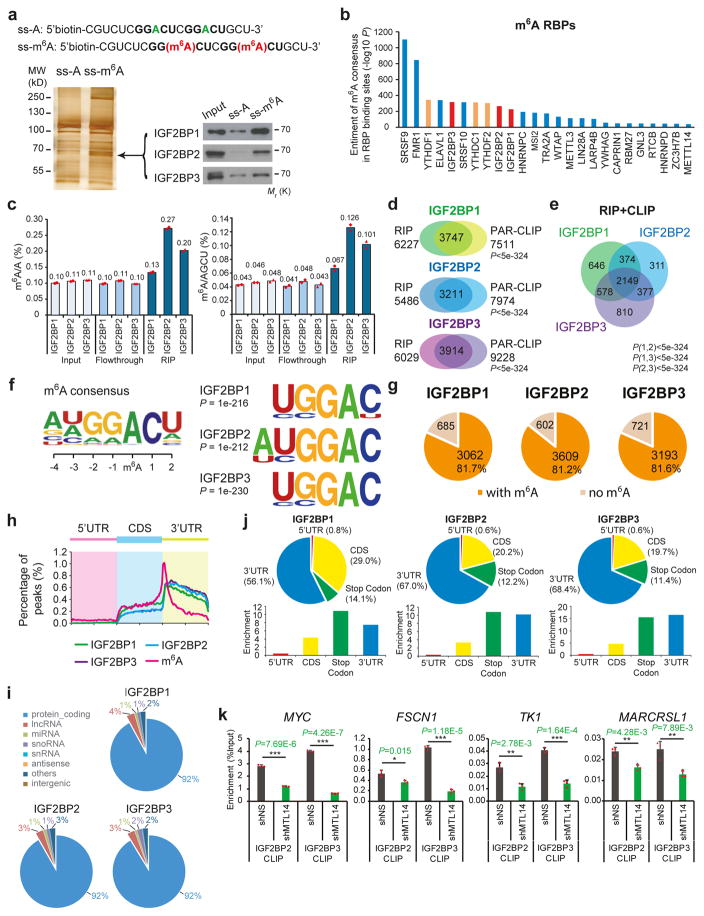
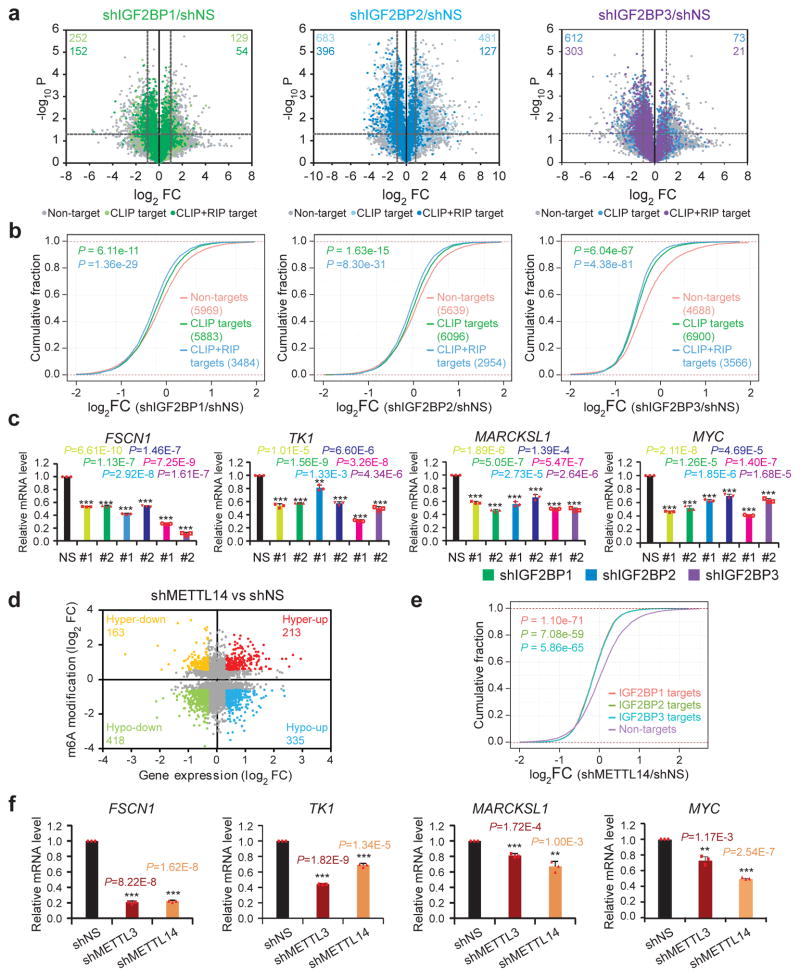
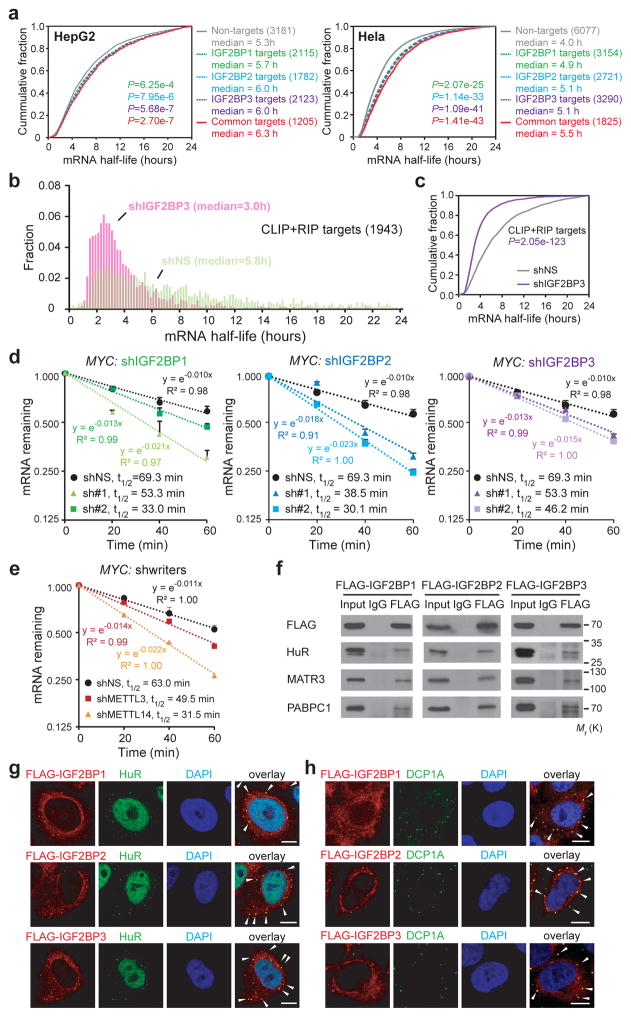
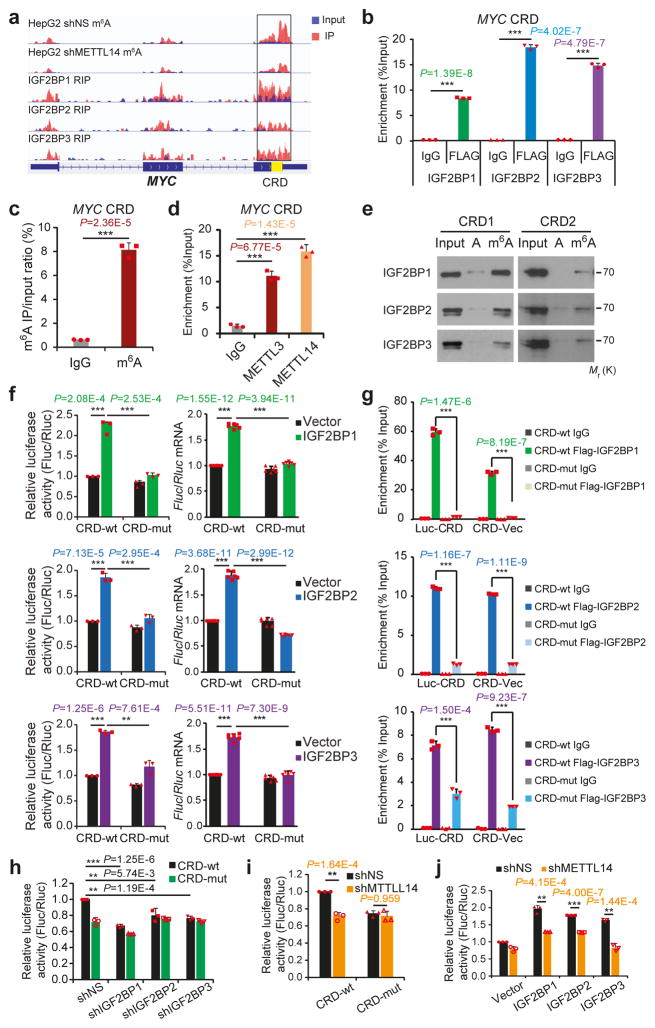
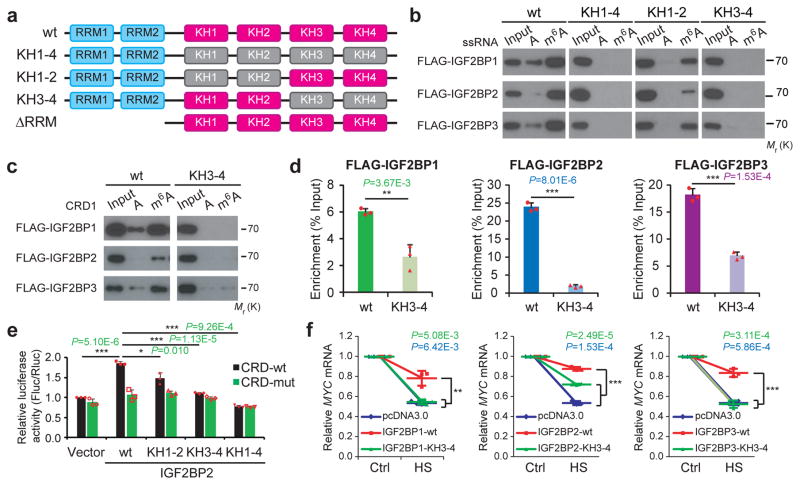
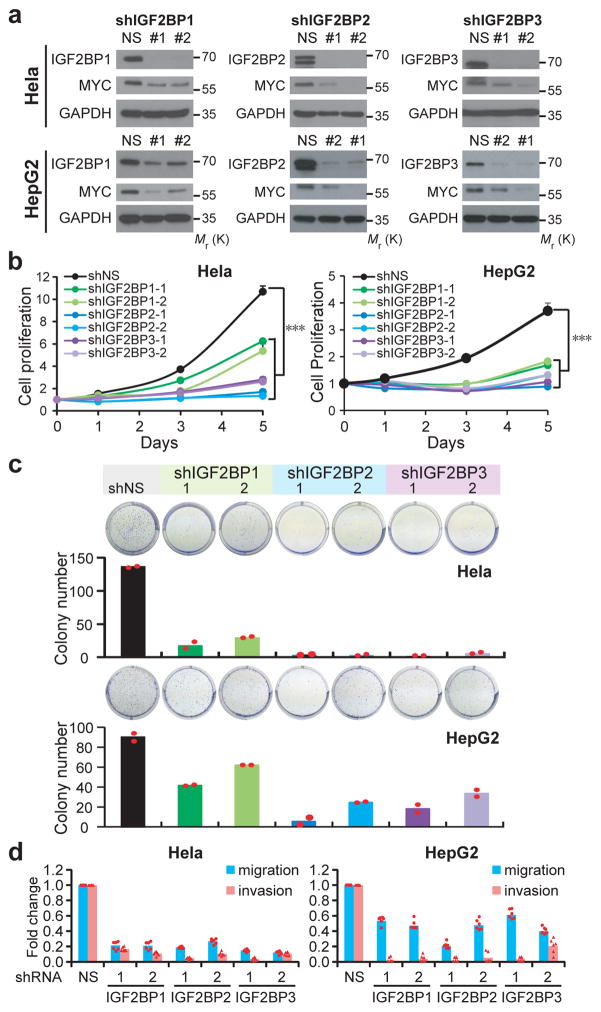
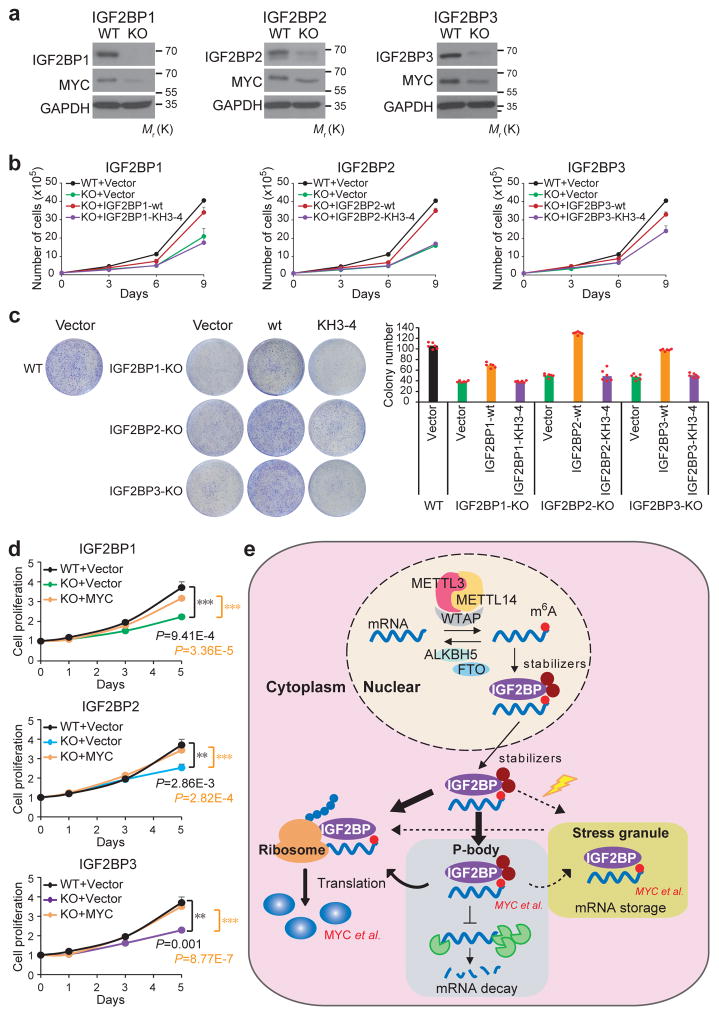
N6-methyladenosine (m6A) is the most prevalent modification in eukaryotic messenger RNAs (mRNAs) and is interpreted by its readers, such as YTH domain-containing proteins, to regulate mRNA fate. Here, we report the insulin-like growth factor 2 mRNA-binding proteins (IGF2BPs; including IGF2BP1/2/3) as a distinct family of m6A readers that target thousands of mRNA transcripts through recognizing the consensus GG(m6A)C sequence. In contrast to the mRNA-decay-promoting function of YTH domain-containing family protein 2, IGF2BPs promote the stability and storage of their target mRNAs (for example, MYC) in an m6A-dependent manner under normal and stress conditions and therefore affect gene expression output. Moreover, the K homology domains of IGF2BPs are required for their recognition of m6A and are critical for their oncogenic functions. Thus, our work reveals a different facet of the m6A-reading process that promotes mRNA stability and translation, and highlights the functional importance of IGF2BPs as m6A readers in post-transcriptional gene regulation and cancer biology.


Conflict of interest statement

COMPETING FINANCIAL INTERESTS

C.He is a scientific founder of Accent Therapeutics, Inc.

Figures

Figure 1
Figure 1. Selective binding of IGF2BPs to m6A-modified RNAs
(a) Identification of m6A specific binding proteins by RNA affinity chromatography using ssRNA probes with methylated (red) or unmethylated (green) adenosine. Silver staining (lower left) and Western blotting (lower right) showed selective pulldown of ~68kDa IGF2BP proteins from HEK293T nuclear extract. Western blot images were representative of 3 independent experiments. (b) Enrichment of m6A consensus sequence “GGAC” in the binding sites of RBPs. The three IGF2BP paralogues were shown in red, while the YTH domain proteins were shown in orange. (c) Quantification of m6A/A and m6A/AGCU ratios by LC-MS/MS in RNAs bound by ectopically expressed IGF2BP1 (chicken ZBP1), IGF2BP2 (human), or IGF2BP3 (human). Values are mean of n =2 independent experiments and individual data points are showed. (d) Overlap of IGF2BP target genes identified by RIP-seq and published PAR-CLIP in HEK293T cells. RIP-seq was performed once. P value was calculated by Fisher’s test. (e) Venn diagram showing the numbers of shared high-confidence targets (i.e., CLIP+RIP targets) amongst IGF2BP paralogues. P value was calculated by Fisher’s test. (f) Top consensus sequences of IGF2BP binding sites and the m6A motif detected by HOMER Motif analysis with PAR-CLIP data. (g) Pie charts showing numbers and percentages of IGF2BP high-confidence target genes that contain m6A peaks. The m6A-seq data was reported in Ref. . (h) Metagene profiles of enrichment of IGF2BP binding sites and m6A modifications across mRNA transcriptome. (i) Percentages of various RNA species bound by IGF2BPs. (j) The distribution (upper) and enrichment (lower) of IGF2BPs binding peaks within different gene reions. The enrichment was determined by the proportion of IGF2BPs binding peaks normalized by the length of the region. Analyses in i and j were performed twice with similar results. (k) In vivo binding of Flag-IGF2BP2 to representative target genes in METTL14 knockdown or control HEK293T cells. Values are mean±s.d. of n =3 independent experiments. *, P<0.05; **, P <0.01; ***, P <0.001; two-tailed Student’s t-test. Unprocessed scans of western blot analysis are available in Supplementary Figure 8. Source data of c and k are in Supplementary Table 3.
Figure 2
Figure 2. IGF2BPs regulate transcriptome-wide mRNA levels
(a) Volcano plots displaying enrichment of dysregulated target genes in IGF2BP knockdown (shIGF2BP) vs. control (shNS) HepG2 cells. The numbers of significantly downregulated (log2FC<−1, P<0.05, two-tailed Student’s t-test) or upregulated genes (log2FC>1, P<0.05, two-tailed Student’s t-test) in the CLIP target group and CLIP+RIP target group are shown. FC, fold change. (b) Cumulative frequency of mRNA log2-fold change in non-target, CLIP target and CLIP+RIP target genes upon IGF2BP silencing. P values were calculated using two-sided Wilcoxon and Mann-Whitney test. (c) Relative changes in FSCN1, TK1, MARCKSL1, and MYC mRNA levels upon IGF2BP silencing. Results from 2 shRNAs for each IGF2BP are shown. Values are mean±s.d. of n = 3 independent experiments. Two-tailed Student’s t-tests were used (**, P <0.01; ***, P <0.001). (d) Distribution of genes with a significant change in both m6A level and gene expression level in METTL14 knockdown HepG2 cells compared to control cells. (e) Cumulative frequency of mRNA log2-fold change showing global reduction of IGF2BPs high-confidence target genes in shMETTL14 vs. shNS cells. P values were calculated using two-sided Wilcoxon and Mann-Whitney test. Exponential regression was used in d and e. Gene expression in a, b were analyzed for three times, while e were analyzed twice. (f) Relative changes in FSCN1, TK1, MARCKSL1, and MYC mRNA levels upon METTL3 or METL14 silencing. Values are mean±s.d. of n =3 independent experiments. Two-tailed Student’s t-tests were used (**, P <0.01; ***, P <0.001). Source data of c and f are in Supplementary Table 3.
Figure 3
Figure 3. Knockdown of IGF2BPs decreases mRNA stability
(a) Cumulative distribution of mRNA half-lives of non-target or IGF2BP high-confidence target genes in HepG2 (left) and Hela (right) cells. (b) Distribution of mRNA half-lives in IGF2BP3 high-confidence targets in HepG2 cells with shIGF2BP3 or shNS. (c) Cumulative distribution of mRNA half-life of IGF2BP3 high-confidence targets in shIGF2BP3 or shNS HepG2 cells. mRNA half-life analyses in a, b and c were repeated twice. (d and e) Reducing MYC mRNA half-life by silencing IGF2BPs (d) or m6A writers (e) in HepG2 cells. Values are mean±s.d. of n =3 independent experiments. (f) Co-Immunoprecipitation and Western blotting showing the binding of mRNA stabilizers with FLAG-tagged IGF2BPs in HEK293T cells, representative of 3 independent experiments. (g and h) Co-localization of IGF2BP proteins with HuR (g) or DCP1A (h) in Hela cells. Arrows indicate co-localization in cytoplasmic granules. Scale bar=10μm. Images were representative of 3 independent experiments. P values were calculated using two-sided Wilcoxon and Mann-Whitney test in a, b, c. Unprocessed scans of western blot analysis are available in Supplementary Figure 8. Source data of d and e are in Supplementary Table 3.
Figure 4
Figure 4. IGF2BPs regulate MYC expression through binding to methylated CRD
(a) Distribution of m6A peaks across MYC mRNA transcript. The coding region instability determinant (CRD) region is highlighted in yellow. m6A-seq was repeated twice while RIP-seq was performed once.(b) RIP-qPCR showing the association of MYC CRD with FLAG-tagged IGF2BPs in HEK293T cells. (c) Enrichment of m6A modification in MYC CRD as detected by gene specific m6A qPCR assay. (d) RIP-qPCR showing the binding of METTL3 and METTL14 to the MYC CRD. (e) RNA pulldown of endogenous IGF2BP proteins from HEK293T nuclear extract using synthetic CRD RNA fragments, CRD1 and CRD2, with (m6A) or without (A) m6A modifications. Images are representative of 3 independent experiments. (f) Relative firefly luciferase (Fluc) activity (i.e., protein level; left) and Fluc mRNA level (right) of wild-type (CRD-wt) or mutated (CRD-mut) CRD reporters in HEK293T cells with ectopically expressed IGF2BP1, IGF2BP2, or IGF2BP3. (g) RIP-qPCR detecting the in vivo binding of Flag-IGF2BPs to the transcripts of CRD-wt or CRD-mut luciferase reporter in HEK293T cells. (h and i) Relative luciferase activity of CRD-wt or CRD-mut in Hela cells with or without stable knockdown of IGF2BPs (h) or METTL14 (i). (j) Relative luciferase activity of CRD-wt or CRD-mut in METTL14 stable knockdown or control Hela cells with ectopic expression of IGF2BPs. For all luciferase assays, the Fluc/Rluc ratio (representing luciferase activity) of CRD-wt with empty vector or shNS was used for normalization. Values are mean±s.d. of n =3 independent experiments, and two-tailed Student’s t-tests were used in b, c, d, f, g, h, i, j. (**, P <0.01; ***, P <0.001). Unprocessed scans of western blot analysis are available in Supplementary Figure 8. Source data of b, c, d, f, g, h, i, j are in Supplementary Table 3.
Figure 5
Figure 5. The KH domains of IGF2BPs are critical for m6A recognition and binding
(a) Schematic structures showing RNA binding domains within IGF2BP proteins and a summary of IGF2BP variants used in this study. Blue boxes are RRM domains, red boxes are wild-type KH domains with GxxG core, and grey boxes are inactive KH domain with GxxG to GEEG conversions. (b) RNA pulldown followed by Western blotting showed in vitro binding of ssRNA baits with wild-type (wt) or KH domain-mutated IGF2BP variants, representative of 3 independent experiments. (c) In vitro binding of CRD1 RNA probes with wild-type or KH3-4 mutated IGF2BPs, representative of 3 independent experiments. (d) The association of wild-type and KH3-4 mutated IGF2BPs with MYC CRD in HEK293T cells as assessed by RIP-qPCR. (e) Relative luciferase activity of CRD reporters in HEK293T cells with forced expression of wild-type or mutated IGF2BP2 variants. (f) Changes in MYC mRNA levels in Hela cells with empty vector or forced expression of wild-type or KH3-4 mutated IGF2BPs one hour post-heat shock (HS). Values are mean±s.d. of n =3 independent experiments, and two-tailed Student’s t-tests were used in d, e, f (*, P <0.05; **, P <0.01; ***, P <0.001). Unprocessed scans of western blot analysis are available in Supplementary Figure 8. Source data of d, e, f are in Supplementary Table 3.
Figure 6
Figure 6. The oncogenic functions of IGF2BPs in human cancer cells
(a) Western blot showing depletion of MYC protein in IGF2BPs-silenced Hela and HepG2 cells, representative of 3 independent experiments. (b) Inhibition of cell proliferation in IGF2BP-silenced cells compared to control cells as determined by MTT assays. Values are mean±s.d. of n =3 independent experiments. Two-tailed Student’s t-tests were used (***, P <0.001). (c) Effect of IGF2BP silencing on colony formation ability. Representative images of crystal violet staining of cells in 6-well plate are shown on top of the histograms. Colonies were counted from 3 replicate wells and 2 independent experiments were performed. The colony number of each experiment represents the total count of 3 replicate wells. (d) Repression of migration and invasion by shRNAs against IGF2BPs. Numbers of migrated or invaded cells were counted from 3 replicate wells and 2 independent experiments were performed. The numbers in the control (shNS) groups were set as 1. Unprocessed scans of western blot analysis are available in Supplementary Figure 8. Source data of b, c, d are in Supplementary Table 3.
Figure 7
Figure 7. IGF2BPs are oncogenic m6A readers
(a) CRISPR-Cas9 mediated knockout (KO) of IGF2BPs and the subsequent depletion of MYC in HepG2 cells as detected by Western blotting. Images were representative of 3 independent experiments. (b) Effect of wild-type or KH3-4 mutated IGF2BPs on restoring cell proliferation in IGF2BP-KO cells. Data shown represent mean value of viable cell numbers of 2 independent experiments. (c) Colony formation assay using wild-type (WT) or IGF2BP KO (sgIGF2BP) HepG2 cells. Representative images of crystal violet staining of cells were shown on top of the histograms of colony numbers. Colonies were counted from 3 replicate wells of and 2 independent experiments were performed. The colony number of each experiment represents the average count of 3 replicate wells. (d) MTT assays displaying the effect of MYC on restoring cell proliferation in IGF2BP-KO cells. Values are mean±s.d. of n =3 independent experiments. Two-tailed student t-test were used (**, P <0.01; ***, P <0.001). (e) Working model of IGF2BP-mediated regulation of m6A modified mRNAs. mRNAs were methylated de novo by the methyltransferase complex composed of METTL3, METTL14 and a regulatory subunit WTAP. The naïve mRNA with m6A modifications were preferentially recognized by IGF2BP proteins. By recruiting mRNA stabilizers, such as HuR and MATR3, IGF2BPs protect target mRNAs from degradation in the P-body while facilitating translation after being exported to cytoplasm. Under stress conditions such as heat shock, IGF2BP-containing mRNPs are translocated to stress granules for the storage of their mRNA targets. Unprocessed scans of western blot analysis are available in Supplementary Figure 8. Source data of b, c, d are in Supplementary Table 3.

Comment in

  • An additional class of m6A readers.
    Zhou KI, Pan T. Zhou KI, et al. Nat Cell Biol. 2018 Mar;20(3):230-232. doi: 10.1038/s41556-018-0046-y. Nat Cell Biol. 2018. PMID: 29476150 Free PMC article.

References

    1. Jia G, et al. N6-methyladenosine in nuclear RNA is a major substrate of the obesity-associated FTO. Nat Chem Biol. 2011;7:885–887. - PMC - PubMed
    1. Dominissini D, et al. Topology of the human and mouse m6A RNA methylomes revealed by m6A-seq. Nature. 2012;485:201–206. - PubMed
    1. Meyer KD, et al. Comprehensive analysis of mRNA methylation reveals enrichment in 3′ UTRs and near stop codons. Cell. 2012;149:1635–1646. - PMC - PubMed
    1. Zhao X, et al. FTO-dependent demethylation of N6-methyladenosine regulates mRNA splicing and is required for adipogenesis. Cell Res. 2014;24:1403–1419. - PMC - PubMed
    1. Su R, et al. R-2HG exhibits anti-tumor activity by targeting FTO/m6A/MYC/CEBPA signaling. Cell. 2017 Epub ahead of print. - PMC - PubMed

Publication types

MeSH terms