. 2018 Feb 23;8(1):3523.
doi: 10.1038/s41598-018-21876-y.

Foxm1 controls a pro-stemness microRNA network in neural stem cells

Affiliations

Foxm1 controls a pro-stemness microRNA network in neural stem cells

Zein Mersini Besharat et al. Sci Rep. .

Abstract

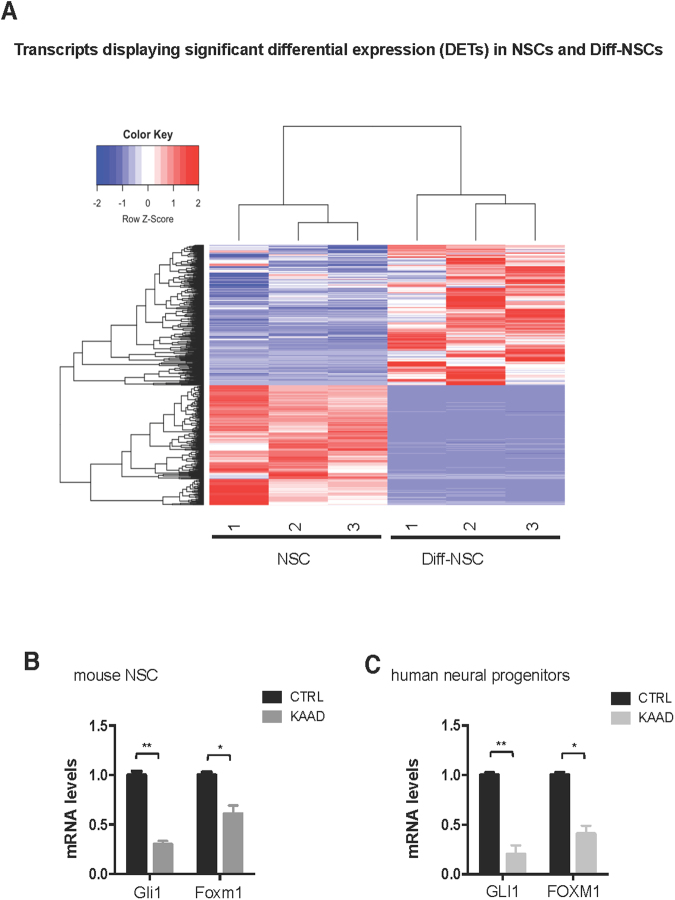
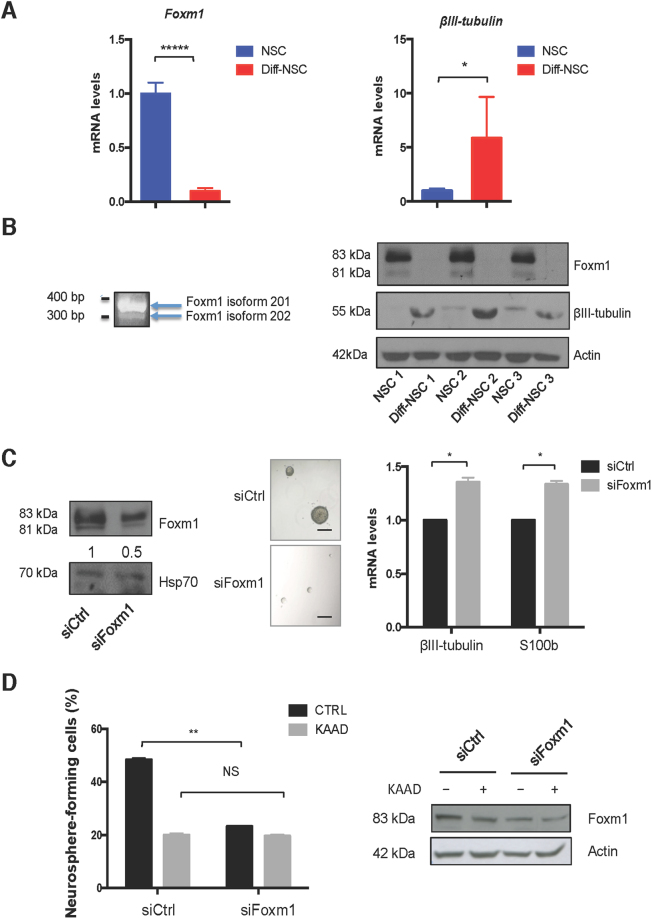
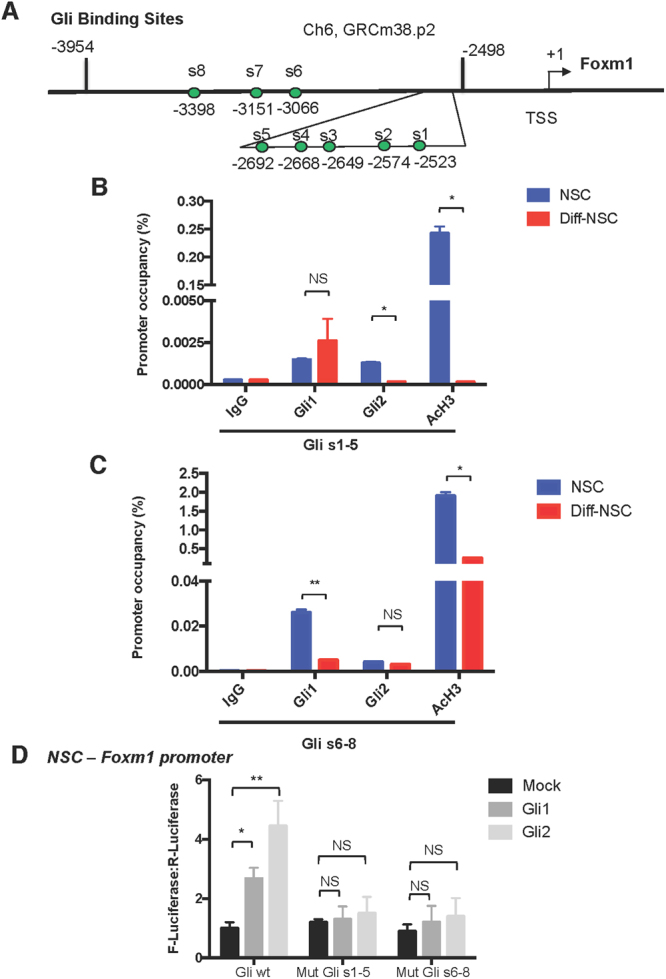
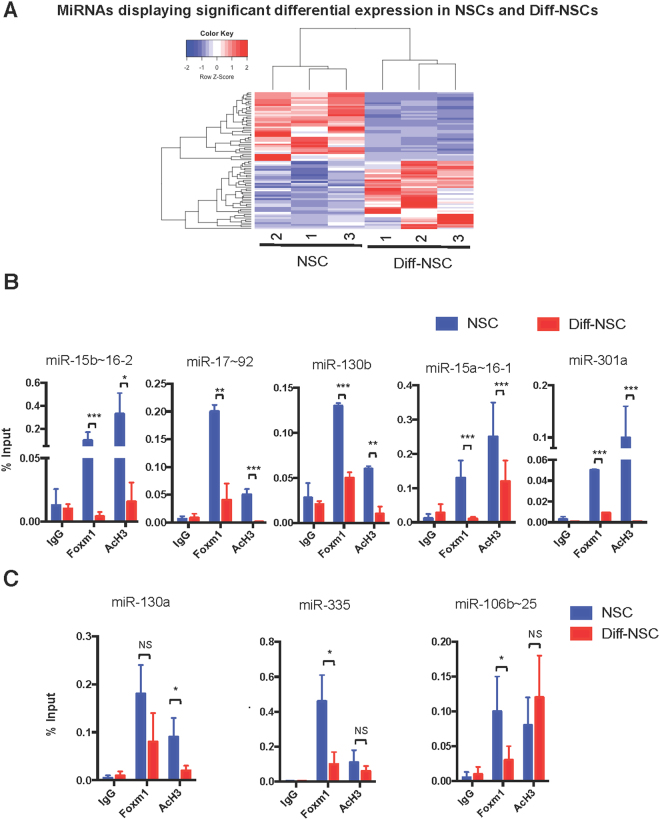
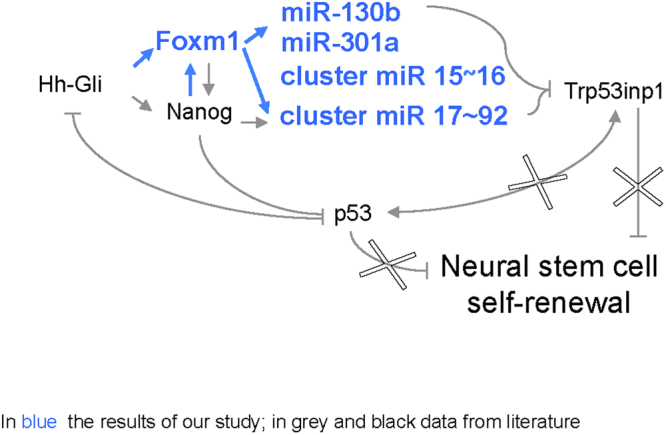
Cerebellar neural stem cells (NSCs) require Hedgehog-Gli (Hh-Gli) signalling for their maintenance and Nanog expression for their self-renewal. To identify novel molecular features of this regulatory pathway, we used next-generation sequencing technology to profile mRNA and microRNA expression in cerebellar NSCs, before and after induced differentiation (Diff-NSCs). Genes with higher transcript levels in NSCs (vs. Diff-NSCs) included Foxm1, which proved to be directly regulated by Gli and Nanog. Foxm1 in turn regulated several microRNAs that were overexpressed in NSCs: miR-130b, miR-301a, and members of the miR-15~16 and miR-17~92 clusters and whose knockdown significantly impaired the neurosphere formation ability. Our results reveal a novel Hh-Gli-Nanog-driven Foxm1-microRNA network that controls the self-renewal capacity of NSCs.


Conflict of interest statement

The authors declare no competing interests.

Figures

Figure 1
Figure 1
Foxm1 levels upon modulation of the Hedgehog pathway. (A) Hierarchical clustering of the 988 transcripts differentially expressed (adj. P < 0.05) (Bray-Curtis method with average linkage). (B) RT-qPCR data showing Gli1 and Foxm1 levels in mouse NSCs before and after 48 h of cyclopamine-KAAD (KAAD) treatment. P values vs. CTRL (DMSO as control) (*P < 0.05: 0.0412, **P < 0.01: 0.0044). (Mann–Whitney U test). (C) RT-qPCR data showing GLI1 and FOXM1 levels in normal human neural progenitors (NHNP) before and after 48 h of cyclopamine-KAAD (KAAD) treatment. P values vs. CTRL (DMSO as control). (*P < 0.05: 0.02, **P < 0.01: 0.0031). (Mann–Whitney U test). Bars in B and C represent the mean (SD) of three independent experiments.
Figure 2
Figure 2
Upregulated expression of Foxm1 in P4 cerebellar NSCs and its effect on self-renewal. (A) RT-qPCR data showing differential expression in pre- and post-differentiation NSCs of mRNA for Foxm1 (*****P < 0.0001: 0.0000089) and the neuronal differentiation gene βIII-tubulin (*P < 0.05: 0.029) (Mann–Whitney U test). (B) Left: PCR assay of Foxm1 expression using isoform-specific primers. Agarose (2%) gel separation of the amplified product yielded two bands corresponding to Foxm1 isoforms 201 (400 bp) and 202 (300 bp). Full-length gel is presented in Supplementary Figure 8A. Right: Immunoblots showing endogenous levels of Foxm1, βIII-tubulin, and Actin (loading control) in three NSC cultures before and after differentiation. Full-length immunoblots are presented in Supplementary Figure 8B. (C) Left: Immunoblots showing endogenous levels of Foxm1 and Hsp70 (loading control) in NSCs transfected with siRNA against Foxm1 or non-targeting siRNA controls (siCtrl). Densitometric values appear below blots. Full-length immunoblots are presented in Supplementary Figure 8C. Middle: Representative bright-field images of neurospheres formed by NSCs transfected with siCtrl and siFoxm1. Scale bar: 100 μm. Right: RT-qPCR data showing mRNA levels of βIII-tubulin (*P < 0.05: 0.043) and S100b (*P < 0.05: 0.031) in NSCs transfected with siCtrl and siFoxm1. P values vs siCtrl. (Mann–Whitney U test). (D) Left: Neurosphere-formation capacity of NSCs transfected with siCtrl and siFoxm1 and treated with cyclopamine-KAAD (KAAD) to suppress endogenous Hedgehog signalling. Graphs show percentage of seeded cells that formed neurospheres. P values vs siCtrl. (**P < 0.01: 0.003, NS: Not significant 0.072) (Two-way ANOVA test). Right: Immunoblots showing endogenous levels of Foxm1 in NSCs transfected with siCtrl and siFoxm1 and treated with cyclopamine-KAAD (KAAD). Full-length immunoblots are presented in Supplementary Figure 9A. Bars in panels A, C, and D represent the mean (SD) of three independent experiments.
Figure 3
Figure 3
Foxm1 promoter occupancy by Gli1 and Gli2. (A) Schematic of the Foxm1 promoter showing locations of the 8 putative Gli-responsive elements (s1–s8). (B,C) qPCR-ChIP assay of endogenous Gli1 and Gli2 occupancy of the Foxm1 promoter region in NSCs and Diff-NSCs. Immunoprecipitation with IgG was performed as control. Anti-acetyl-H3 antibodies was used to detect Foxm1 transcriptional activation. Eluted DNA was qPCR-amplified using primers encompassing putative Gli binding sites [s1–s5 (B) and s6–s8 (C)]. Results are expressed as fold induction values relative to ChIP input controls. B-actin was utilized as unrelated chromatin control and is presented in Supplementary Figure 5 A. Bars represent means (SD) of three independent experiments. P values vs. Diff-NSCs (Mann-Whitney U test): (B) *P < 0.05: 0.04797 (s1-5, Gli2), 0.03271 (s1-5, AcH3); NS (not significant): 0.2514 (s1-5, Gli1). (C) *P < 0.05: 0.0490 (s6-8, AcH3); **P < 0.01: 0.001374 (s6-8, Gli1); NS: 0.296763205 (s6-8, Gli2). (D) Luciferase activity induced in the Foxm1 promoter region in NSCs by Gli1, Gli2, and Mock (negative control, PCDNA). Results are normalized to pRL-CMV-Renilla luciferase (R-Luciferase). Bars represent means (SD) of at least three independent experiments, each performed in triplicate. P values vs. control cells (One-way ANOVA test): *P < 0.05: 0.02 (Gli wt-Gli1); **P < 0.01: 0.005 (Gli wt-Gli2), NS: Not significant 0.072 (Mut Gli s1-5-Gli1); 0.066(Mut Gli s1-5-Gli2); 0.083 (Mut Gli s6-8-Gli1); 0.077(Mut Gli s6-8-Gli2).
Figure 4
Figure 4
Foxm1 controls the transcription in P4 murine cerebellar NSCs of multiple miRNAs and miRNA clusters. (A) Heat map and dendrogram depiction of the 80 miRNAs displaying significant differential expression in NSCs before and after induction of differentiation. (B,C) qPCR-ChIP assays of NSCs and Diff-NSCs using anti-Foxm1 antibody and anti-acetyl-H3 antibody. Immunoprecipitation with IgG was performed as control. Eluted DNA was PCR-amplified with primers annealing to promoter regions of the miRNA genes of interest. Findings for miRNA candidates belonging to a cluster are based on assays of one representative cluster member. Results are expressed as fold induction versus input controls. B-actin was utilized as unrelated chromatin control and is presented in Supplementary Figure 6B. Bars represent the mean (SD) of three independent experiments. P values NSCs vs. Diff-NSCs (Mann–Whitney U test): Statistically significant (B) Foxm1: **P < 0.01: 0.002204 (miR-17~92); ***P < 0.001: 0.000 (miR-15b~16-2), 0.0003471 (miR-130b), 0.00004 (miR-15a~16-1), 0.0003906 (miR-301a). AcH3: *P < 0.05: 0.049416827 (miR-15b~16-2); **P < 0.01: 0.008868 (miR-130b); ***P < 0.001: 0.0008656 (miR-17~92), 0.00000069 (miR-15a~16-1), 0.00000920 (miR-301a). (C) Foxm1: *P < 0.05: 0.01467 (miR-335), 0.01021 (miR-106b~25); NS: not significant: 0.07214 (miR-130a). AcH3: *P < 0.05: 0.02903 (miR-130a); NS: 0.5259 (miR-335), 0.4417 (miR-106b~25).
Figure 5
Figure 5
Foxm1-mediated miRNAs and miRNA clusters affect NSC neurosphere formation. (A) Neurosphere-formation capacity of NSCs transfected with LNA anti-miR-130b, -miR-301a, miR-19a (to inhibit miR-17-92 cluster members) and miR-15b (to inhibit miR-15–16 cluster members) that were used separately and combined. [3 LNA combination: anti- miR-130b, -miR-301a, and miR-19a; 4 LNA combination: anti-miR-130b, -miR-301a, miR-19a, and miR-15b]. P values vs. scrambled LNA control (One-way ANOVA test): *P < 0.05: 3 LNA combination: 0.0424; 4 LNA combination: 0.0500). (B) RT-qPCR data showing βIII-tubulin, S100b, Pcna and Casp3 mRNA levels after 4 LNA combination. P values vs. scrambled LNA control (Two-way ANOVA test): *P < 0.05: 0.047 (βIII-tubulin), ***P < 0.001: 0.00086 (S100b), NS: Not Significant (Pcna, Casp3). Bars in A and B panels represent means (SD) of at least three independent experiments.
Figure 6
Figure 6
Foxm1 promoter occupancy by Nanog. (A) Schematic of the Foxm1 promoter showing putative Nanog-responsive elements (s1; s2 - s3 and s4). (B) qPCR-ChIP assay of endogenous Nanog occupancy of the Foxm1 promoter region in NSCs and Diff-NSCs. Immunoprecipitation with IgG was performed as control. Anti-acetyl-H3 antibodies was used to identify Foxm1 transcriptional activation. Eluted DNA was PCR-amplified with primers for Nanog binding sites s1, s2-s3, s4. Results are expressed as fold induction values relative to input controls. B-actin was utilized as unrelated chromatin control and is presented in Supplementary Figure 7A. Bars represent means (SD) of three independent experiments. P values vs. Diff-NSCs (Mann-Whitney U test): **P < 0.01: 0.002572 (s2-3, AcH3); ****P < 0.0001: 0.00000718 (s2-3, Nanog), 0.0001051 (s1, AcH3), 0.00004356 (s4, AcH3); NS: 0.4531 (s1, Nanog), 0.7118 (s4, Nanog). (C) Luciferase activity induced by ectopic expression of Nanog and Mock (negative control, PCDNA) in NSCs transfected with luciferase vector carrying the wild-type Foxm1 promoter (wt) and its mutant lacking the Nanog binding sites s2 and s3 (mutants s2, s3). Bars represent means (SD) of at least three independent experiments, each performed in triplicate. P values vs. indicated controls (Mann–Whitney U test). ***P < 0.001: 0. 000937 (Nanog wt); NS: 0.097 (Mut Nanog s2), 0.18 (Mut Nanog s3).
Figure 7
Figure 7
Regulation of cerebellar NSC self-renewal by the Hh-Foxm1-miRNA axis. Increased Hh-Gli signalling promotes NSC self-renewal by inhibiting p53 and upregulating Nanog expression. The tumour-suppressor p53 checks NSC self-renewal directly, by activating Trp53inp1, and by inhibiting Gli and Nanog. Our data show (bold-face type) that Hh-Gli signalling also upregulates the expression of Foxm1 (directly and indirectly via Nanog). The targets of these two transcription factors include a number of miRNAs that regulate the expression of important genes, including Trp53inp1. Repression of Trp53inp1 disrupts a feedback loop that maintains high p53 levels, thereby diminishing the tumour suppressor’s ability to repress Gli and Nanog expression.

References

    1. Montalbán-Loro R, Domingo-Muelas A, Bizy A, Ferrón S. Epigenetic regulation of stemness maintenance in the neurogenic niches. World journal of stem cells. 2015;7:700. doi: 10.4252/wjsc.v7.i4.700. - DOI - PMC - PubMed
    1. Davis AA, Temple S. A self-renewing multipotential stem cell in embryonic rat cerebral cortex. Nature. 1994;372:263–266. doi: 10.1038/372263a0. - DOI - PubMed
    1. Po A, et al. Hedgehog controls neural stem cells through p53-independent regulation of Nanog. EMBO J. 2010;29:2646–2658. doi: 10.1038/emboj.2010.131. - DOI - PMC - PubMed
    1. Gage FH. Mammalian neural stem cells. Science. 2000;287:1433–1438. doi: 10.1126/science.287.5457.1433. - DOI - PubMed
    1. Harris, L., Zalucki, O., Piper, M. & Heng, J. I.-T. Insights into the Biology and Therapeutic Applications of Neural Stem Cells. Stem cells international2016 (2016). - PMC - PubMed

Publication types

MeSH terms