Clinical Trial
. 2018 Mar;19(3):255-266.
doi: 10.1038/s41590-018-0052-z. Epub 2018 Feb 23.

Toll-like receptor 9 antagonizes antibody affinity maturation

Affiliations
Clinical Trial

Toll-like receptor 9 antagonizes antibody affinity maturation

Munir Akkaya et al. Nat Immunol. 2018 Mar.

Abstract

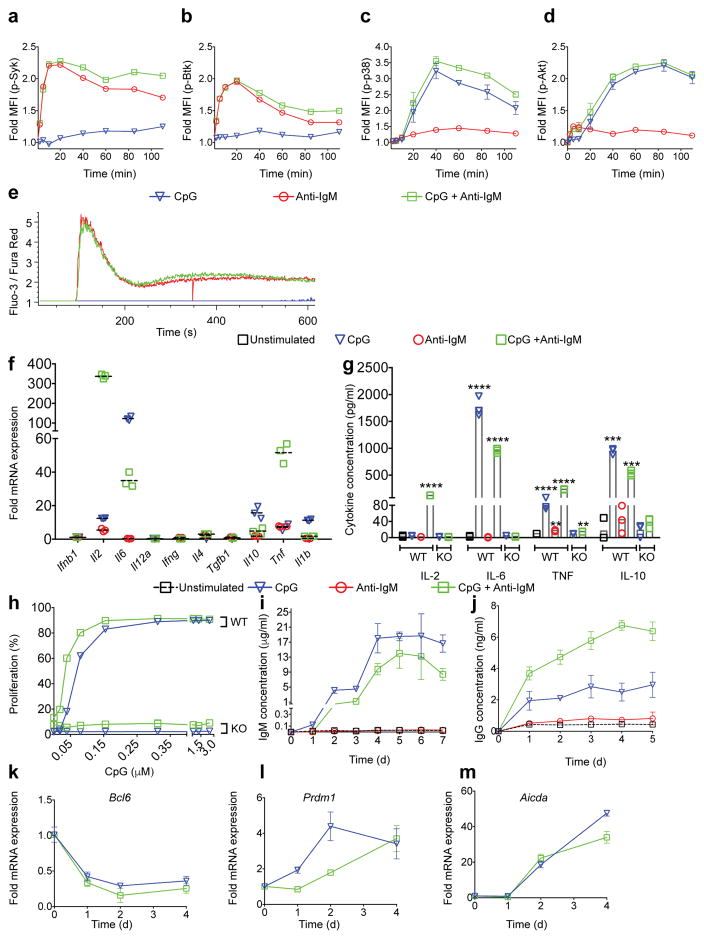
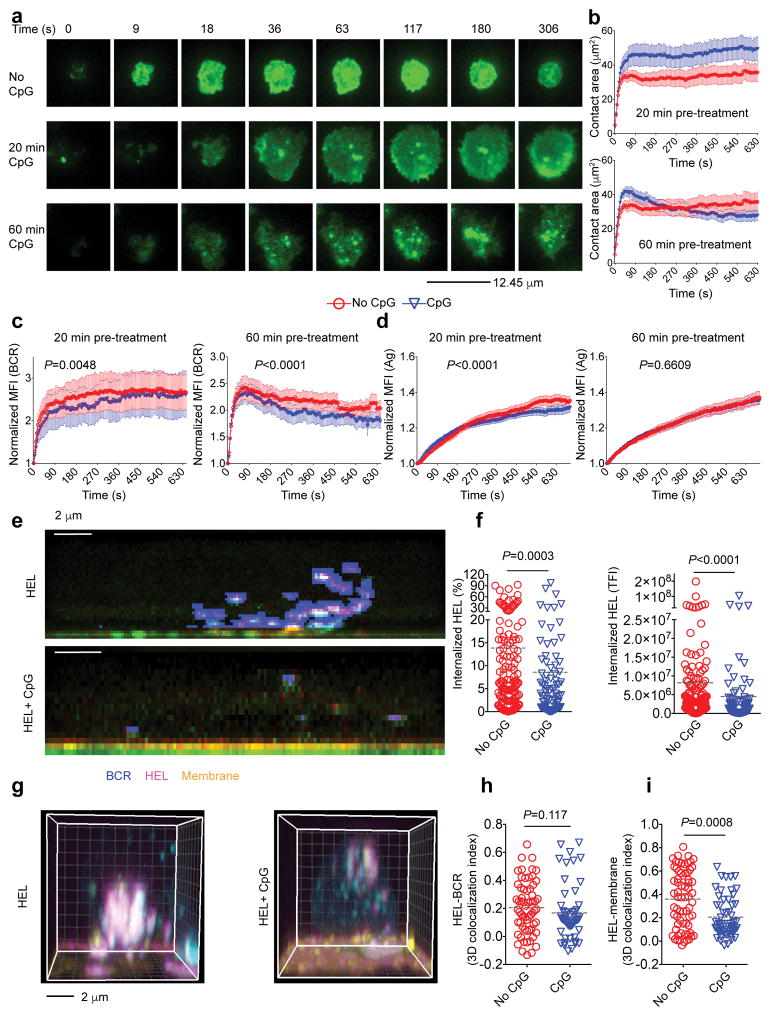
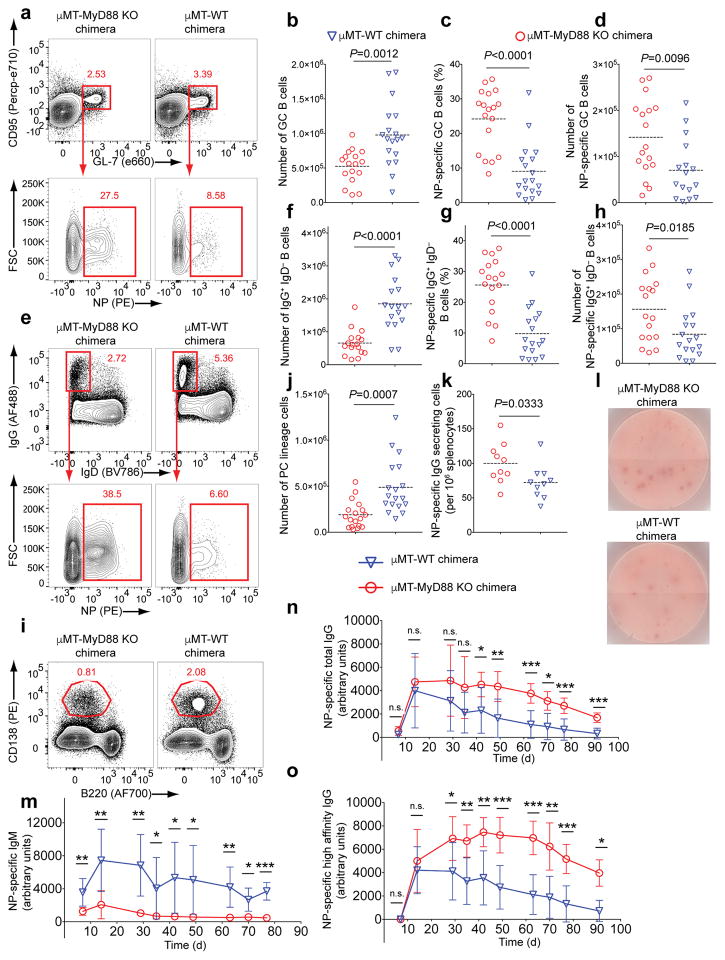
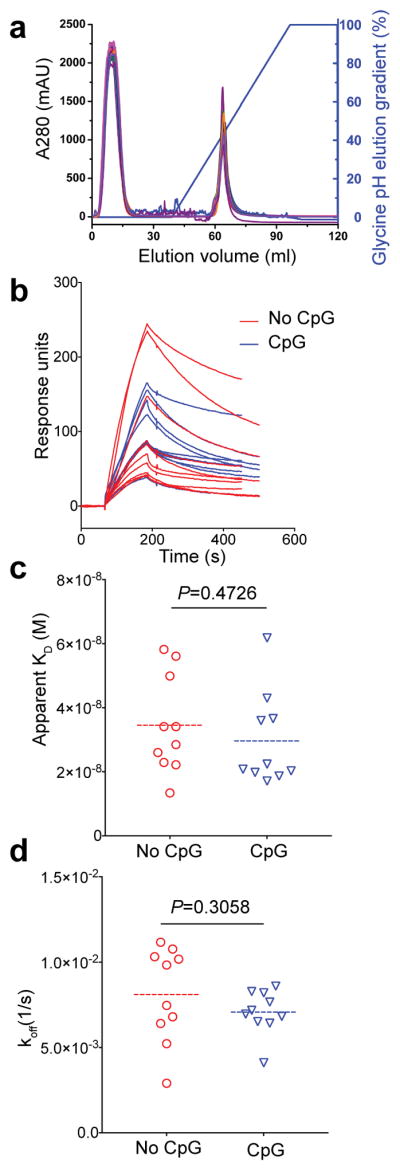
Key events in T cell-dependent antibody responses, including affinity maturation, are dependent on the B cell's presentation of antigen to helper T cells at critical checkpoints in germinal-center formation in secondary lymphoid organs. Here we found that signaling via Toll-like receptor 9 (TLR9) blocked the ability of antigen-specific B cells to capture, process and present antigen and to activate antigen-specific helper T cells in vitro. In a mouse model in vivo and in a human clinical trial, the TLR9 agonist CpG enhanced the magnitude of the antibody response to a protein vaccine but failed to promote affinity maturation. Thus, TLR9 signaling might enhance antibody titers at the expense of the ability of B cells to engage in germinal-center events that are highly dependent on B cells' capture and presentation of antigen.


Figures

Figure 1
Figure 1. The effect of TLR9 signaling on the outcome of B cell responses to antigen
In all cases purified mouse splenic B cells (WT or TRL9 KO) were stimulated in vitro with Anti-IgM (2–5μg/ml) or CpG (1μM) alone or in combination. (a–d) Individual B cell samples were fixed and barcoded using combinations of B220-specific antibodies, pooled, permeabilized and stained with mAbs specific for the phospho-kinases: p-Syk (a), p-Btk (b), p-p38 (c) and p-Akt (d). The fold changes in abundance of phosphorylated kinases in stimulated as compared to unstimulated B cells are shown. (e) Calcium flux measured by flow cytometry in B cells loaded with the Ca2+ sensor dyes Furo-red and Fluo-4 and stimulated. (f) Fold changes in the mRNA expression for various cytokines of B cells stimulated for 4h as compared to unstimulated B cells. (g) ELISA measurements of cytokine proteins in the culture supernatants of WT or TLR9 KO B cells stimulated in vitro for 18 h (for IL-6) or 24 h (for TNF, IL-2 and IL-10). (h) Proliferation of WT or TLR9 KO B cells stimulated with a sub-optimal concentration of Anti-IgM (1μg/ml) and increasing concentrations of CpG (0 to 3 μM). Shown are the percentage of cells that proliferated after 46 h of culture. (i,j) Antibody production by stimulated B cells for a duration of seven days. ELISA measurement of IgM (i) and IgG from the IgG+ deplated B cells (Fig.S1g) (j). (k–m) Kinetic analysis of in vitro mRNA expression of GC B cell- or PC-specific genes in stimulated WT B cells for 4 days. Expression of Bcl6 (k), Prdm1 (l) and Aicda (m) is shown as fold changes over that observed in unstimulated B cells at time 0. Data are representative of three independent experiments performed with duplicate (a–d), or triplicate samples (e–n). Data points and error bars indicate mean and standard deviation, respectively. Statistical significance was measured using two sided unpaired t-test (**= 0.001<P≤0.01; ***=0.0001<P≤0.001; ****=P≤0.0001).
Figure 2
Figure 2. TLR-9 signaling antagonizes the trafficking of BCR-bound antigen into late endosomal compartments
(a) HEL-specific MD4 B cells incubated with pHrodo-conjugated HEL at 37°C in the presence or absence of CpG. The FI of pHrodo was measured over time by flow cytometry. Fold changes in MFI values over the pHrodo MFI prior to incubation are shown. (b) Fold changes in pHrodo MFI values for WT MD4 and TLR9-KO MD4 B cells. (c–e) MD4 B cells were immobilized on coverslips and incubated with rhodamine-conjugated HEL in the presence or absence of CpG (1μM). Cells were fixed, permeabilized and stained with mAbs specific for CD71, LAMP1 or H2M. Confocal microscopy images of representative cells (left panels) and the 3D colocalization indices of 25 cells per group (right panels) are shown. (c) Colocalization of HEL with CD71 at 10 min. (d) Colocalization of HEL with LAMP-1 at 60 min (e) Colocalization of HEL with H2M at 60 min. Data are representative of three independent experiments. Lines indicate mean values. Lines and error bars represent mean of duplicates and standard deviation of the mean. Statistical significance was measured by two sided Mann-Whitney U test.
Figure 3
Figure 3. The effect of TLR-9 signaling on B cell responses to membrane bound antigen
(a–d) HEL-specific MD4 B cells untreated or pretreated with CpG (1μM) for 20 or 60 min, labeled with DyLight 649-Fab Anti-IgM and placed on Alexa Fluor 488-HEL-containing PLB. (a) Representative time lapse TIRF images of B cell (supplementary Videos, S1a, S1b and S1c). (b) Quantification of the contact areas of the B cell with the HEL-containing PLB with time. The accumulation of the BCR (c) and HEL(d) in the area of contact of the B cell with the PLB. (e–f) Untreated or CpG (1μM) treated HEL-specific MD4 B cells labeled with DyLight 649-Fab Anti-IgM and placed on CM-DiI-labeled PMS containing Alexa Fluor 488-HEL for 30 min at 37°C. (e) Confocal z-stack images reconstituted as an x and z sideview using maximal projection along the y axis are shown, HEL (magenta), PMS (green) and internalized HEL (cyan). (f) The percent of the HEL in the bilayer that was internalized (left); the total internalized HEL taken as the total fluorescence intensity (TFI) (right). (g) A 3D-reconstructed image of confocal z-stacks showing BCR (cyan), HEL (magenta) and PMS (yellow) (supplementary Videos S2a and S2b). (h,i) Quantification of the colocalization of the BCR and HEL (h) and HEL and PMS (i). Data represent three independent experiments. Lines indicate mean values. Statistical significance was measured by two sided Quadratic Regression (c,d), two sided Mann-Whitney U test (f,h,i).
Figure 4
Figure 4. The effect of TLR9 and BCR signaling on B cells transcription and the expression of B cell surface proteins
(a–c) Purified B cells were unstimulated or stimulated with CpG (1 μM) or Anti-IgM (5 μg/ml) or a combination of the two, in triplicate for 4 h in vitro and analyzed by RNA seq. (a) Venn Diagram and (b) principle component analysis showing differentially affected genes. (c) Ingeniuty Pathway analysis showing the log2 scale enhanced and diminished transcriptional regulation in various pathways in response to different stimulations relative to unstimulated B cells. Purified B cells were cultured as in (a) for 24h, barcoded, and analyzed for the expression of surface proteins using a BioLegend LegendScreen kit. Proteins that showed an increase of three fold or more or decreased 30% or more as compared to untreated B cells are shown in a log2 scale heat map (d). (e,f) HEL-specific MD4 B cells stimulated with HEL (1 μg/ml), CpG (1 μM) or both for 24 h and MHC class II I-Ak-HEL peptide complexes quantified by flow cytometry using the mAb, AW3.18, specific for I-Ak-HEL. Representative flow cytometry plots (e) and fold MFI values (MFI of AW3.18 stained cells divided by the MFI of isotype control mAb) (f) are shown. (g,h) B cells were stimulated with CpG (1 μM) or Anti-IgM (5 μg/ml) in the presence or absence of the following inhibitors: 50 μM PD98059 (MEK 1&2 inhibitor), 10 μM SB202198 (p38 inhibitor), 30 μM SP600125 (JNK inhibitor), 5 μM Akt IV (Akt inhibitor), 10 μM MHY1485 (mTOR activator, autophagy inhibitor), 20 μM Perifosine (Akt inhibitor), 100 nM Rapamycine (mTOR inhibitor), 50 nM Wortmannin (PI3K inhibitor). Surface expression of MHC class II (g) and CD86 (h) are shown. Values that are significantly decreased compared to no inhibitor condition are shown with asterisks. Data shown in (d,g,h) are epresentative of two independent experiment performed in triplicates. Statistical significance was measured using a two sided unpaired t-test (n.s.= P>0.05; *=0.01< P ≤0.05; **= 0.001< P ≤0.01; ***=0.0001< P ≤0.001; ****= P ≤0.0001).
Figure 5
Figure 5. TLR9 signaling decreases the ability of antigen-specific B cells to interact with and activate antigen-specific helper T cells in response to soluble antigen
(a–c) HEL-specific MD4 B cells stained with CMFDA (green) were cultured with 3A9 T cells stained with CMTMR (red) in a 1:1 ratio in the presence or absence of CpG (1μM) and/or HEL (1μg/ml). Interactions of B and T cells were imaged for 24 at rate of 1 frame per 10–20 min. Duration of B and T cell colocalization (a), T cell track speed (b) and T cell track length (c). Doted lines indicate the mean values. (d,e) CD44 expression (d) and profiferation (e) of HEL-specific 3A9 T cells stimulated with HEL (0.5 or 2.0 μg/ml), CpG (0.2 or 2.0 μM) and HEL-specific MD4 B cells for 72h. (f,g) Proliferation (f) and CD44 expression (g) of 3A9 CD4+ HEL-specific T cells (WT or TLR9 KO) cultured with HEL-specific MD4 B cells (WT or TLR9 KO) in the presence of HEL (1μg/ml) with or without CpG (1μM) for 72 h. Data represent two independent experiments performed in triplicates. (h,i) CD44 expression (h) and profireration (i) of CD4+ T cells stimulated with antibodies specific for either CD3 or CD28 for 72 h in the presence or absence of CpG (1μM). Data are representative of three independent experiments carried out in triplicates. Statistical significance was measured using a two sided Welch’s t-test.
Figure 6
Figure 6. TLR9 signaling decreases the ability of antigen-specific B cells to activate antigen-specific helper T cells in response to membrane bound antigen
NIH3T3 cells were transduced with retroviral vectors containing sequences encoding an HEL-CD4 chimeric membrane protein (NIH3T3-HEL) or a mock vector (NIH3T3-mock). Cell surface expression of the chimeric proteins was quantified using (a) a AF647-labeled CD4-specific mAb or (b) a APC-labeled HEL-specific mAb. (c) Flowcytomerty plots of HEL-specific MD4 B cells or nonspecific B cells incubated with NIH3T3- Mock or NIH3T3-HEL cells for 20 or 40 min, fixed, permeabilized and stained with a HEL-specific mAb. (d) Fold changes in the expression of CD86, MHC-II and CD69 for HEL-specific MD4 B cells or nonspecific B cells incubated with NIH3T3-Mock or NIH3T3-HEL cells for 24 h in the presence or absence of CpG (1μM). (e–g) T cell proliferation (e) and CD44 expression (f,g) for HEL-specific 3A9 CD4+ T cells cultured with HEL-specific MD4 B cells and either NIH3T3-Mock or NIH3T3-HEL cells in the presence or absence of CpG (1uM) for 72 h. All data are representatives of three independent experiments performed in triplicates. Bars in graphs indicate means. Statistical significance was measured using two sided unpaired t-tests
Figure 7
Figure 7. The B cell intrinsic expression of the TLR9 adaptor MyD88 impacts the outcome of T cell dependent Ab response in vivo
Bone marrow chimeras generated as shown (Fig.S5a) were immunized with NP-CGG (100 μg/mouse) adsorbed on Alum (100 μl/mouse) and CpG (65 μg/mouse) and spleens were analyzed on day 14 post immunization. Spleen cells were analyzed by flowcytometry using the gating strategy shown (Fig.S5c). (a–d) Representative flow plots (a), total number of GC B cells (b), percent of all GC B cells that were NP-specific (c) and the total number of NP- specific GC B cells (d). (e–h) Representative flow plots (e), total number of IgG+ IgD cells (f), percent of all IgG+ IgD B cells that were NP-specific (g) and total number of NP-specific IgG+ IgD B cells (h). (i–l) Representative flow plots (i) and total number of PC-lineage cells (j). NP-specific IgG Ab secreting cells (k) and visualized by ELISPOT (l). Data were pooled from two independent experiments. Each symbol represents an individual mouse. Dotted lines indicate mean values. Statistical significance was calculated using a two sided Welch’s t test. (m–o) NP-specific IgM (n), NP-specific IgG (o) and high affinity NP-specific IgG (p) given in arbitrary units calculated from serial dilutions of pooled sera from NP-CGG immunized WT mice. Data represent two independent experiments. Lines and error bars represent the mean of 8 individual mice and SD respectively. A two sided Welch’s t test was used to determine the statistical significance. Values that are significantly different between each group for each collection day are shown with asterisks (n.s.= P>0.05; *=0.01< P ≤0.05; **= 0.001< P ≤0.01; ***=0.0001< P ≤0.001; ****= P ≤0.0001)
Figure 8
Figure 8. CpG does not induce high affinity antibodies in human
Human subjects were immunized with AMA1-C1, formulated on Alhydrogel with or without 564 μg of CpG 7909. Sera were collected on day 70 post immunization and IgG antibodies were purified using protein G columns. Representative chromatography profiles (a) are shown. (b) BIAcore binding analysis between PfAMA1 and serum IgGs (70nM). The binding sensorgrams of IgG samples from CpG and Non-CpG immunized subjects are shown in blue and red, respectively. (c,d) Apparent KD binding affinities (c) and koff values (d) measured by surface plasmon resonance analysis of serially diluted purified antibodies are graphed. Each symbol represents an individual. Statistical significance was measured using a two sided Welch’s t-test

References

    1. De Silva NS, Klein U. Dynamics of B cells in germinal centres. Nat Rev Immunol. 2015;15:137–148. - PMC - PubMed
    1. Kurosaki T, Kometani K, Ise W. Memory B cells. Nat Rev Immunol. 2015;15:149–159. - PubMed
    1. Mesin L, Ersching J, Victora GD. Germinal Center B Cell Dynamics. Immunity. 2016;45:471–482. - PMC - PubMed
    1. Bannard O, Cyster JG. Germinal centers: programmed for affinity maturation and antibody diversification. Curr Opin Immunol. 2017;45:21–30. - PubMed
    1. DeFranco AL, Rookhuizen DC, Hou B. Contribution of Toll-like receptor signaling to germinal center antibody responses. Immunol Rev. 2012;247:64–72. - PMC - PubMed

Publication types

LinkOut - more resources