. 2018 Jun;251(3):419-430.
doi: 10.1007/s00232-018-0022-2. Epub 2018 Feb 23.

Exploring the Viral Channel KcvPBCV-1 Function via Computation

Affiliations

Exploring the Viral Channel KcvPBCV-1 Function via Computation

Alma E V Andersson et al. J Membr Biol. 2018 Jun.

Abstract

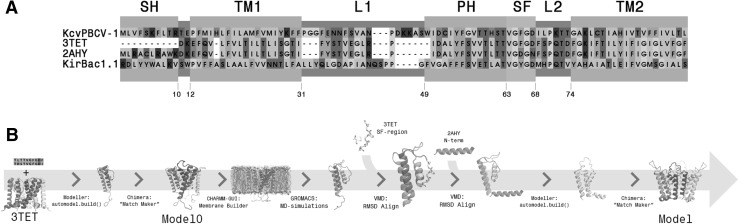
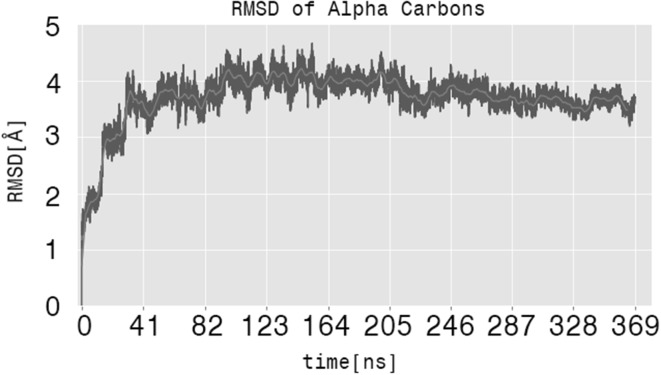
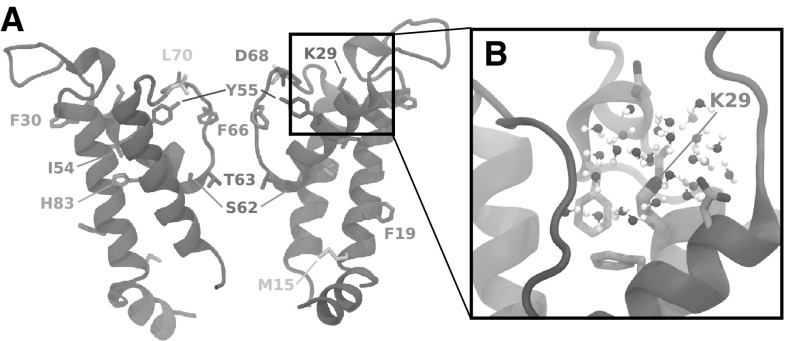
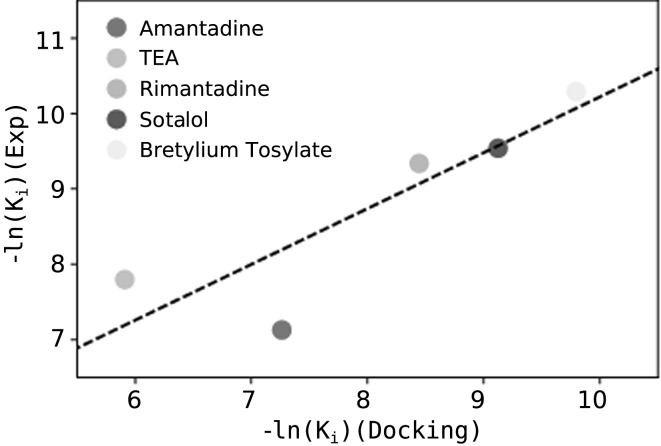
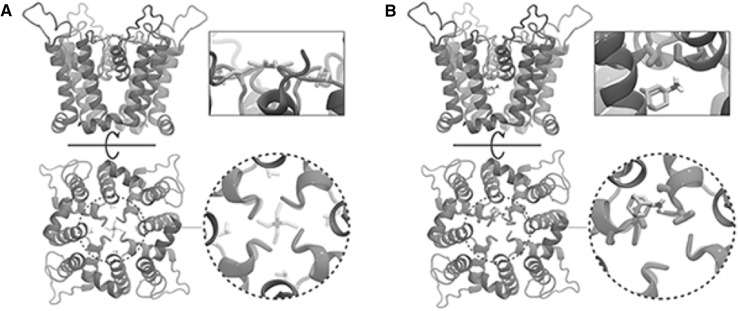
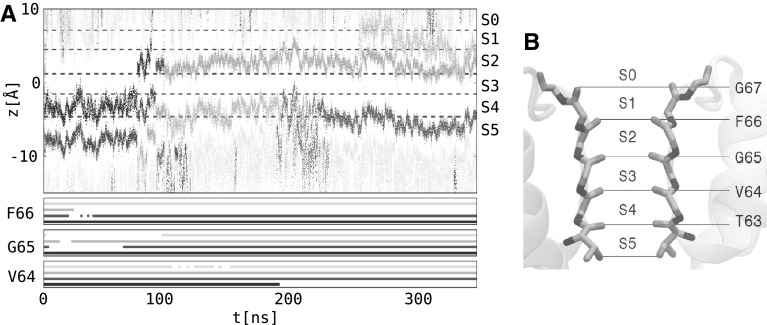
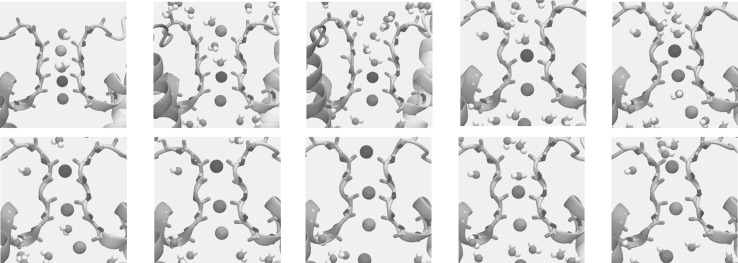
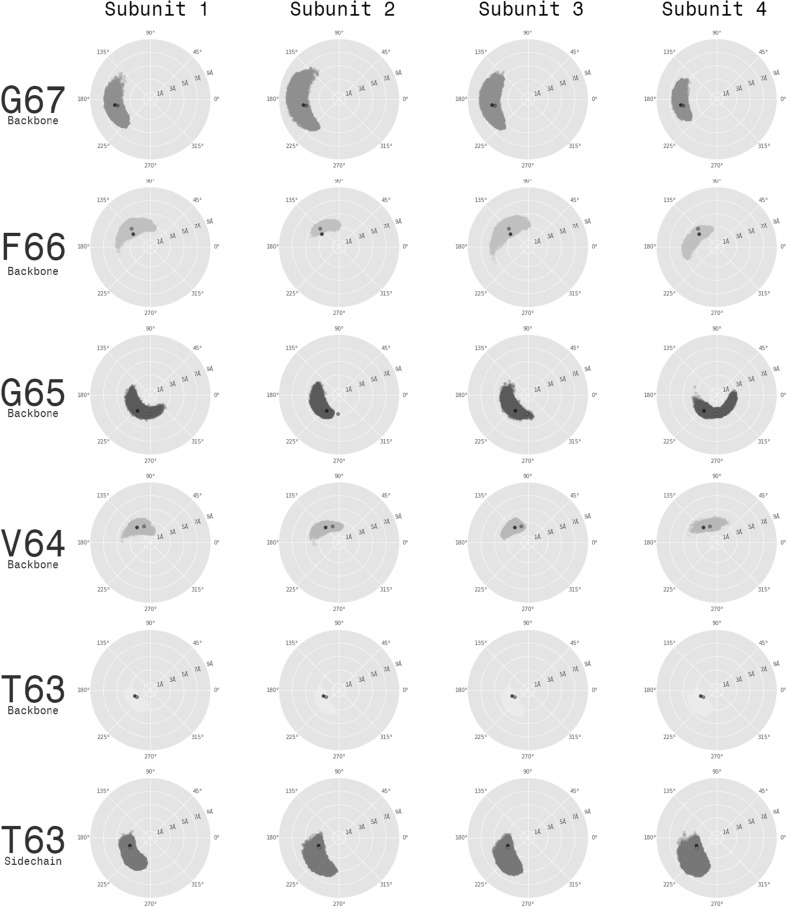
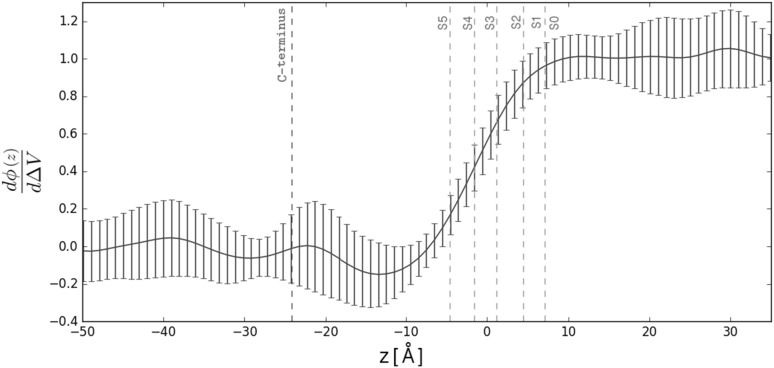
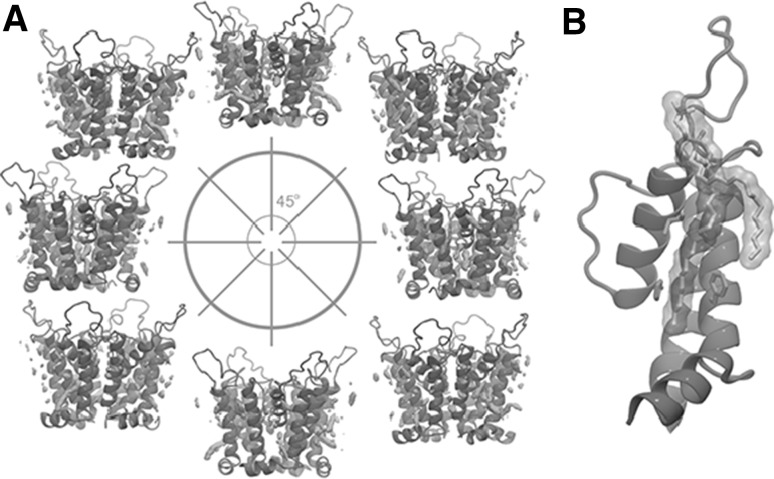
Viral potassium channels (Kcv) are homologous to the pore module of complex [Formula: see text]-selective ion channels of cellular organisms. Due to their relative simplicity, they have attracted interest towards understanding the principles of [Formula: see text] conduction and channel gating. In this work, we construct a homology model of the [Formula: see text] open state, which we validate by studying the binding of known blockers and by monitoring ion conduction through the channel. Molecular dynamics simulations of this model reveal that the re-orientation of selectivity filter carbonyl groups coincides with the transport of potassium ions, suggesting a possible mechanism for fast gating. In addition, we show that the voltage sensitivity of this mechanism can originate from the relocation of potassium ions inside the selectivity filter. We also explore the interaction of [Formula: see text] with the surrounding bilayer and observe the binding of lipids in the area between two adjacent subunits. The model is available to the scientific community to further explore the structure/function relationship of Kcv channels.

Keywords: Conduction; Gating; Homology modeling; Molecular dynamics simulations; Protein–lipid interaction; Viral ion channel.


Conflict of interest statement

A. E. V. Andersson, M. A. Kasimova, and L. Delemotte declare that they have no conflict of interest.

Figures

Fig. 1
Fig. 1
Homology modeling. a Sequence alignment between KcvPBCV-1 , the wild-type (2AHY) and potassium-selective mutant (3TET) of the NaK channel, and the KirBac1.1 template used to build an earlier model (Tayefeh et al. 2009). b Overview of the homology modeling protocol. The various modeling steps, starting from the template and ending with the final open KcvPBCV-1 model, used for molecular dynamics simulations, are shown
Fig. 2
Fig. 2
Root mean square deviation (RMSD) of all KcvPBCV-1 conformations sampled along the 369 ns MD simulation under no applied voltage. For the analysis, the Cα atoms of the protein were considered. The initial configuration was used as a reference
Fig. 3
Fig. 3
Location of the KcvPBCV-1 residues, whose role in the function of this channel has been previously suggested based on the mutagenesis experiments (Table 2). A. KcvPBCV-1 side view; two subunits (in gray) out of four are shown for clarity. The residues explored in the previous studies are represented as sticks and are shown in different colors. B. Environment of K29 in the homology model. The protein residues and the water molecules located within 5 Å of K29 are shown. Both the protein residues and the water molecules are colored by the atom name: oxygen—red, hydrogen—white, and carbon—cyan
Fig. 4
Fig. 4
Correlation between the binding affinities predicted from docking and those estimated experimentally. The R value is 0.87
Fig. 5
Fig. 5
Highest ranked docking poses for TEA (a) and amantadine (b). The side (top panel) and bottom (bottom panel) views are shown. The rectangular and circular insets correspond to the zoomed-in views on the blockers. TEA and amantadine are colored by the atom name: nitrogen—blue, hydrogen—white, and carbon—cyan. L70 and T63 are shown in light-green and dark-green, respectively
Fig. 6
Fig. 6
a Conduction events and conformational changes of the backbone of the selectivity filter. The top panel shows the position of ions along the KcvPBCV-1 principal axis. Ions, entering the selectivity filter, are represented in different colors; those located in the KcvPBCV-1 cavity and the extracellular solution are shown in light gray. The dashed lines separate the binding sites of the selectivity filter (S0–S5). The bottom panel shows the conformational changes of the backbone of V64, G65, and F66. The carbonyl groups of these residues fluctuate between two alternative states, facing either the pore (continuous lines) or the pore helices (interruptions in the continuous lines). The four lines per residue correspond to different subunits of the channel. b Selectivity filter binding sites: S0–S5. The backbone of the selectivity filter is shown as sticks. The binding sites S0–S5 are located between the planes, which are defined by the backbone carbonyl groups (or side chain hydroxyl in the case of T63) of the T63-G67 residues
Fig. 7
Fig. 7
Conduction events shown in several representative snapshots. The ions passing through the selectivity filter are colored according to Fig. 6. The backbone of the selectivity filter is shown as sticks. For the details of the translocation events, see text
Fig. 8
Fig. 8
Conformations of the selectivity filter carbonyl groups. The orientation of the T63-G67 carbonyl groups with respect to the conduction pathway was explored. The 2D plots show the (C,Cα,N,O) dihedral and the distance of the carbonyl oxygen to the pore axis. Each point corresponds to a single conformation of KcvPBCV-1 . The rows represent the T63-G67 residues, and the columns—the four channel subunits. On each plot, the two reference points, corresponding to the structures of the NaK2K (red) and hERG channels (black), are shown
Fig. 9
Fig. 9
Electrical distance estimated along the KcvPBCV-1 pore axis. A cylinder with a radius of 5 Å centered on the KcvPBCV-1 pore axis was considered for the analysis. The S0–S5 denote the ionic binding sites at the selectivity filter, and the C-termini. The electrical distance was estimated for different ionic configurations of the selectivity filter; the average and the standard deviation are shown
Fig. 10
Fig. 10
Interactions between KcvPBCV-1 and the lipid bilayer. a Average occupancy of the lipids surrounding KcvPBCV-1. The areas with an occupancy higher than 0.15 are shown in orange. KcvPBCV-1 is colored in gray. Each snapshot shows the channel conformation rotated by 45o with respect to the previous one. b A lipid molecule interacting with F19, I54 (blue) and H61 (red)

References

    1. Abenavoli A, DiFrancesco ML, Schroeder I, Epimashko S, Gazzarrini S, Hansen UP, Thiel G, Moroni A. Fast and slow gating are inherent properties of the pore module of the k+ channel kcv. J Gen Physiol. 2009;134(3):219–229. doi: 10.1085/jgp.200910266. - DOI - PMC - PubMed
    1. Abraham MJ, Murtola T, Schulz R, Páll S, Smith JC, Hess B, Lindahl E. Gromacs: High performance molecular simulations through multi-level parallelism from laptops to supercomputers. SoftwareX. 2015;12:19–25. doi: 10.1016/j.softx.2015.06.001. - DOI
    1. Aksimentiev A, Schulten K. Imaging α-hemolysin with molecular dynamics: Ionic conductance, osmotic permeability, and the electrostatic potential map. Biophys J. 2005;88(6):3745–3761. doi: 10.1529/biophysj.104.058727. - DOI - PMC - PubMed
    1. Altschul SF, Gish W, Miller W, Myers EW, Lipman DJ. Basic local alignment search tool. J Mol Biol. 1990;215(3):403–410. doi: 10.1016/S0022-2836(05)80360-2. - DOI - PubMed
    1. Arrigoni C, Schroeder I, Romani G, Van Etten JL, Thiel G, Moroni A. The voltage-sensing domain of a phosphatase gates the pore of a potassium channel. J Gen Physiol. 2013;141(3):389–395. doi: 10.1085/jgp.201210940. - DOI - PMC - PubMed

MeSH terms

LinkOut - more resources