

Allostatic load and subsequent all-cause mortality: which biological markers drive the relationship? Findings from a UK birth cohort
- PMID: 29476357
- PMCID: PMC5968064
- DOI: 10.1007/s10654-018-0364-1
Allostatic load and subsequent all-cause mortality: which biological markers drive the relationship? Findings from a UK birth cohort
Abstract
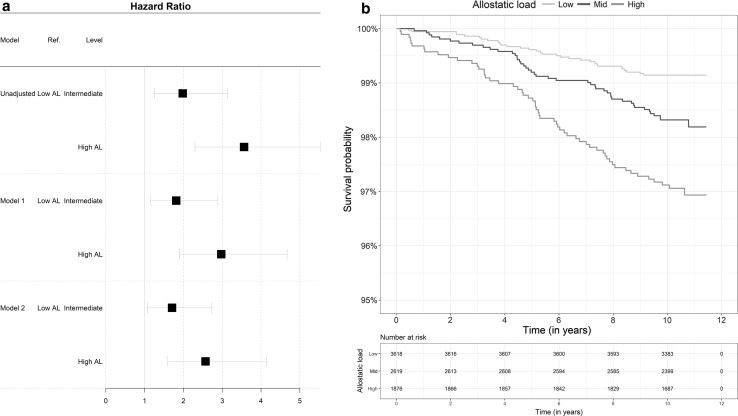
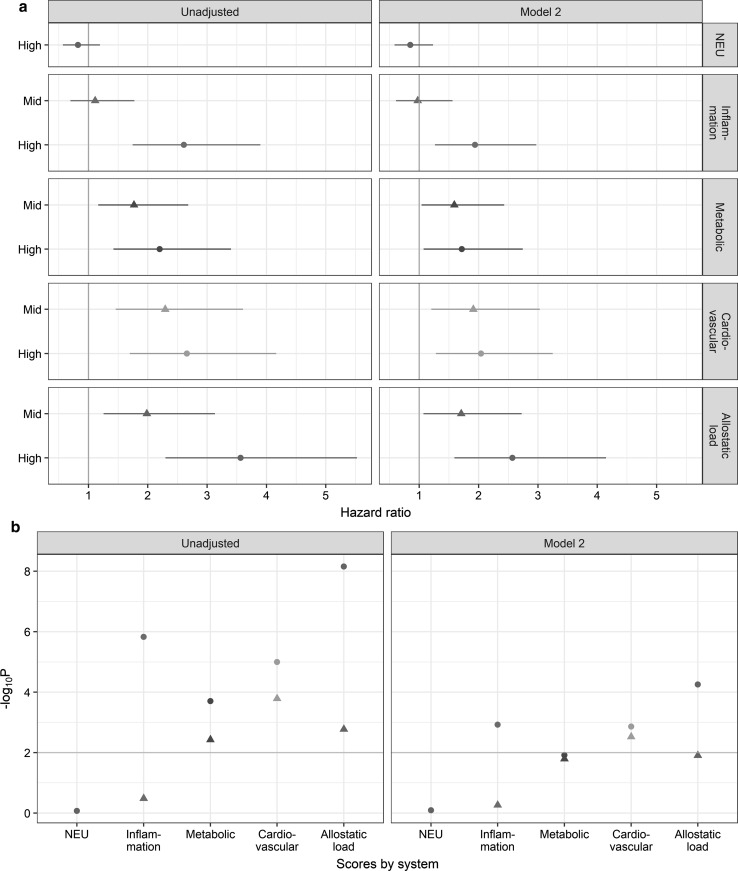
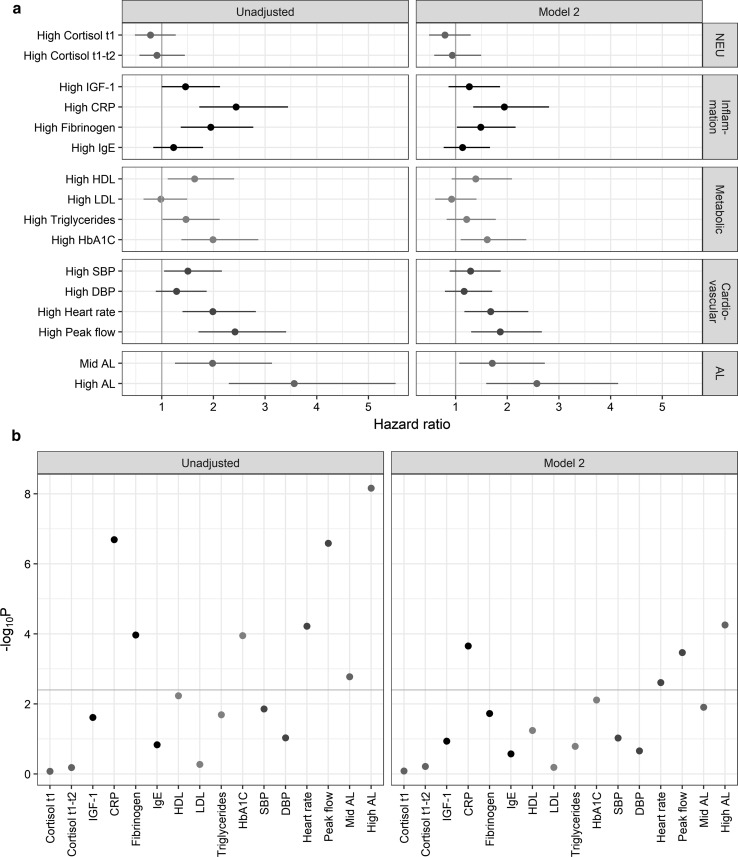
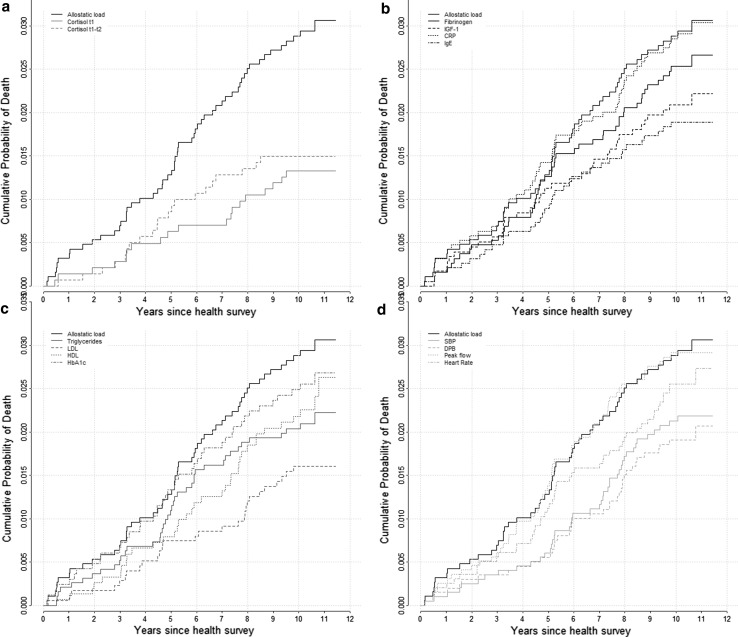
The concept of allostatic load (AL) refers to the idea of a global physiological 'wear and tear' resulting from the adaptation to the environment through the stress response systems over the life span. The link between socioeconomic position (SEP) and mortality has now been established, and there is evidence that AL may capture the link between SEP and mortality. In order to quantitatively assess the role of AL on mortality, we use data from the 1958 British birth cohort including eleven year mortality in 8,113 adults. Specifically, we interrogate the hypothesis of a cumulative biological risk (allostatic load) reflecting 4 physiological systems potentially predicting future risk of death (N = 132). AL was defined using 14 biomarkers assayed in blood from a biosample collected at 44 years of age. Cox proportional hazard regression analysis revealed that higher allostatic load at 44 years old was a significant predictor of mortality 11 years later [HR = 3.56 (2.3 to 5.53)]. We found that this relationship was not solely related to early-life SEP, adverse childhood experiences and young adulthood health status, behaviours and SEP [HR = 2.57 (1.59 to 4.15)]. Regarding the ability of each physiological system and biomarkers to predict future death, our results suggest that the cumulative measure was advantageous compared to evaluating each physiological system sub-score and biomarker separately. Our findings add some evidence of a biological embodiment in response to stress which ultimately affects mortality.
Keywords: Allostatic load; Cohort study; Health behaviours; Mortality; Social environment.
Conflict of interest statement
Conflict of interest
The authors declare that they have no conflict of interest.
Ethical approval
Written informed consent was obtained from the parents for childhood measurements and ethical approval for the adult data collection was obtained from the National Research Ethics Advisory Panel. Ethical approval for the age 45 years survey was given by the South East Multicentre Research Ethics Committee.
Data access
NCDS data are open access datasets available to non-profit research organisations.
Figures
References
-
- Mackenbach JP. Health inequalities: Europe in profile [Internet]. Produced by COI for the Department of Health; 2006 [cited 2013 Nov 19]. Available from: http://www.who.int/entity/social_determinants/resources/european_inequal....
MeSH terms
Substances
Grants and funding
LinkOut - more resources
Full Text Sources
Other Literature Sources
Medical
