. 2018 Apr;9(4):333-350.
doi: 10.1007/s13238-018-0517-8. Epub 2018 Feb 23.

Differential stem cell aging kinetics in Hutchinson-Gilford progeria syndrome and Werner syndrome

Affiliations

Differential stem cell aging kinetics in Hutchinson-Gilford progeria syndrome and Werner syndrome

Zeming Wu et al. Protein Cell. 2018 Apr.

Abstract

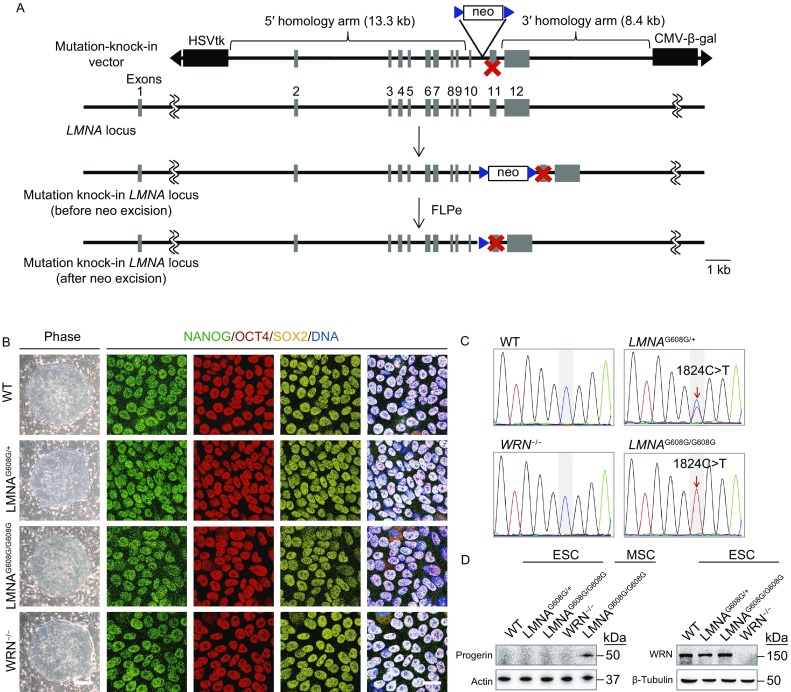
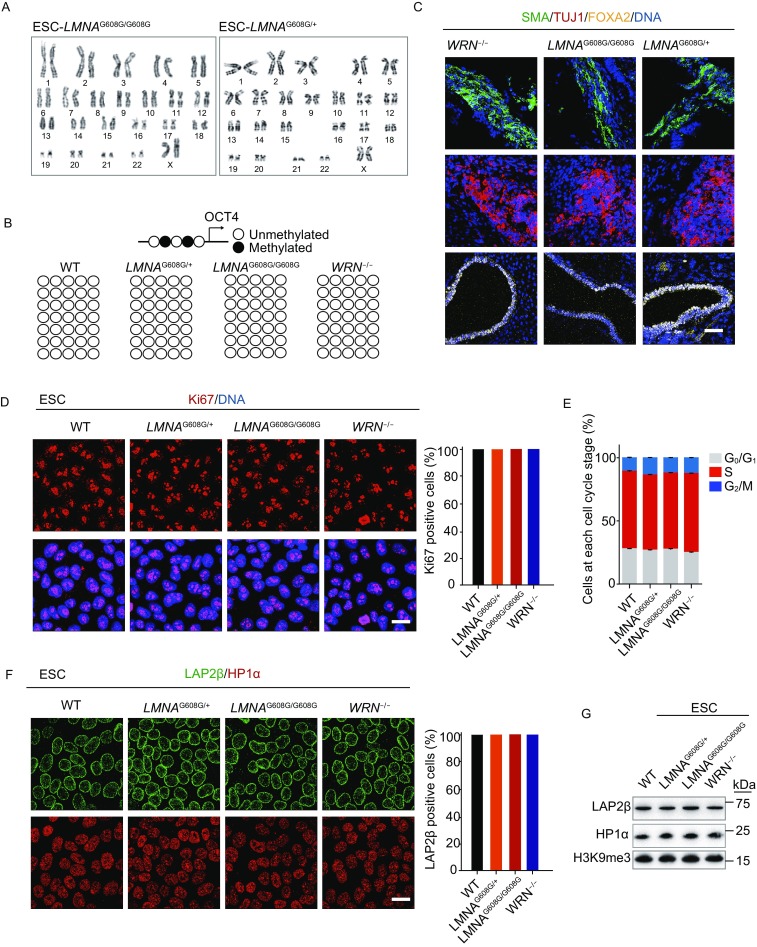
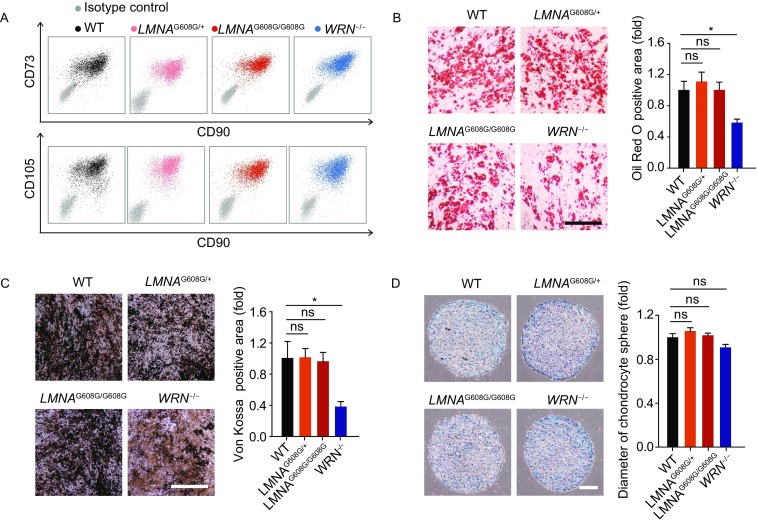
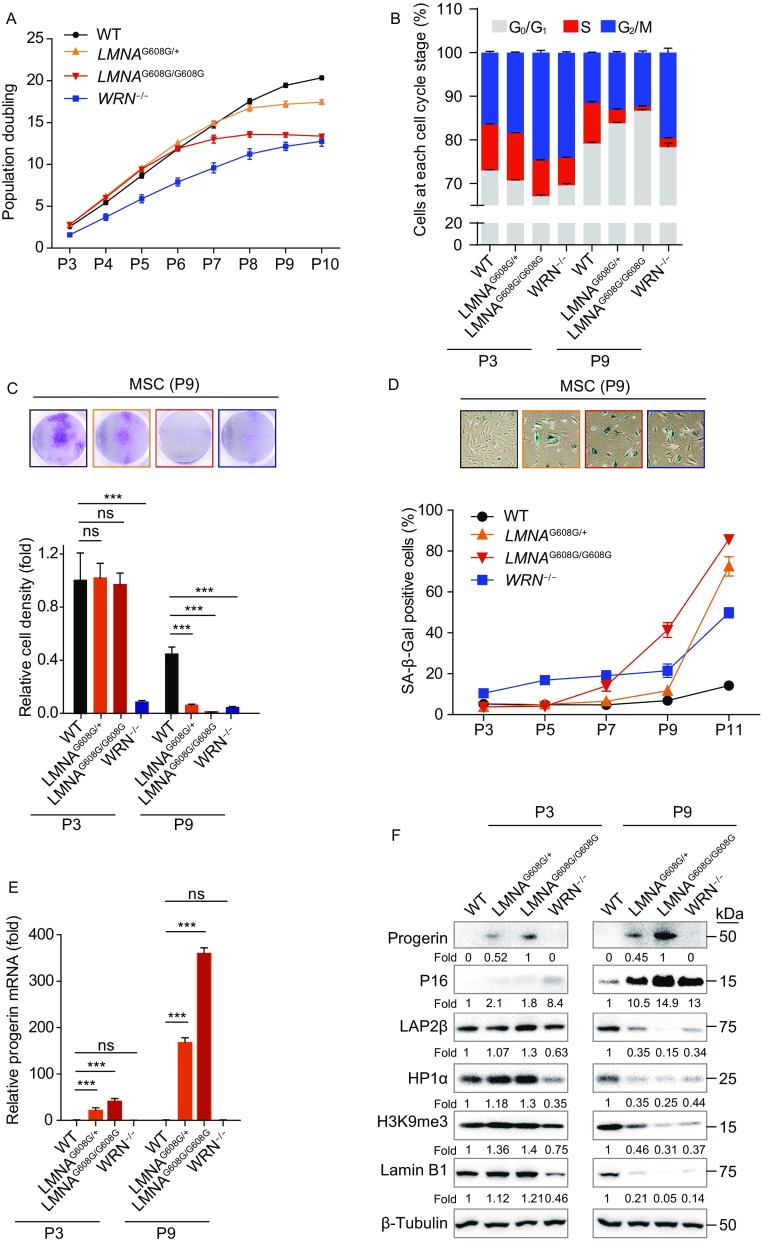
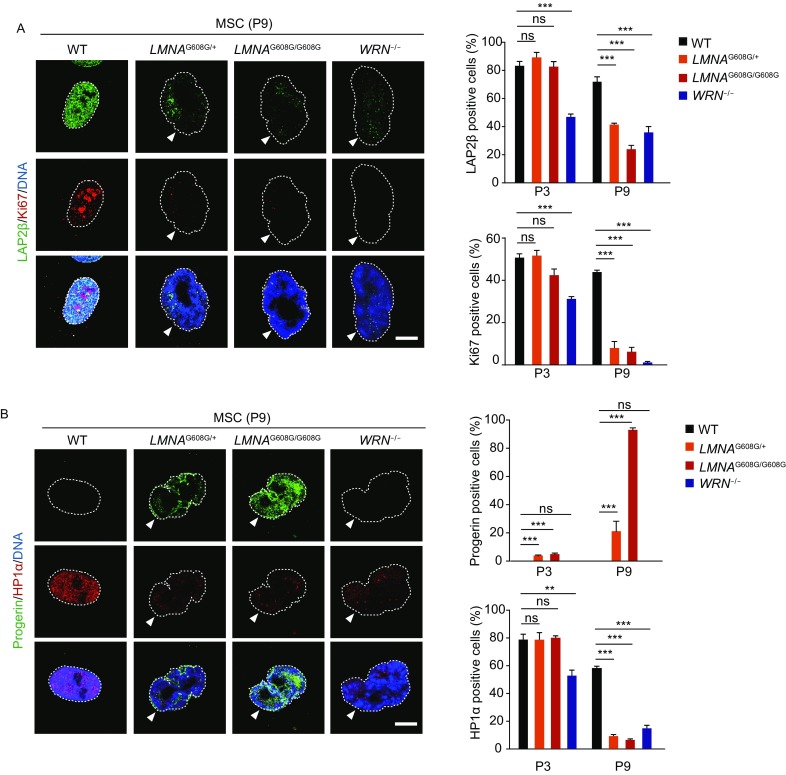
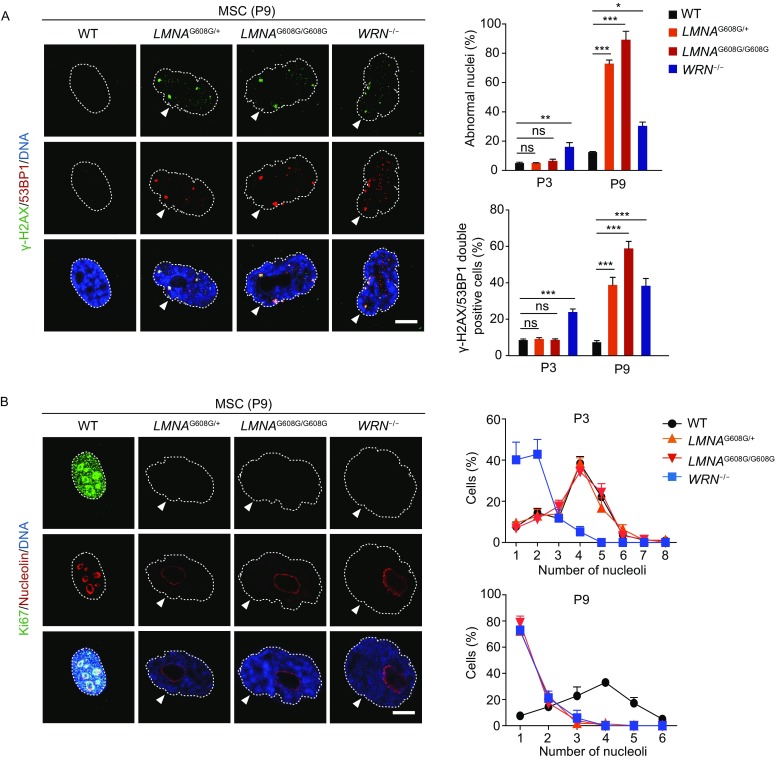
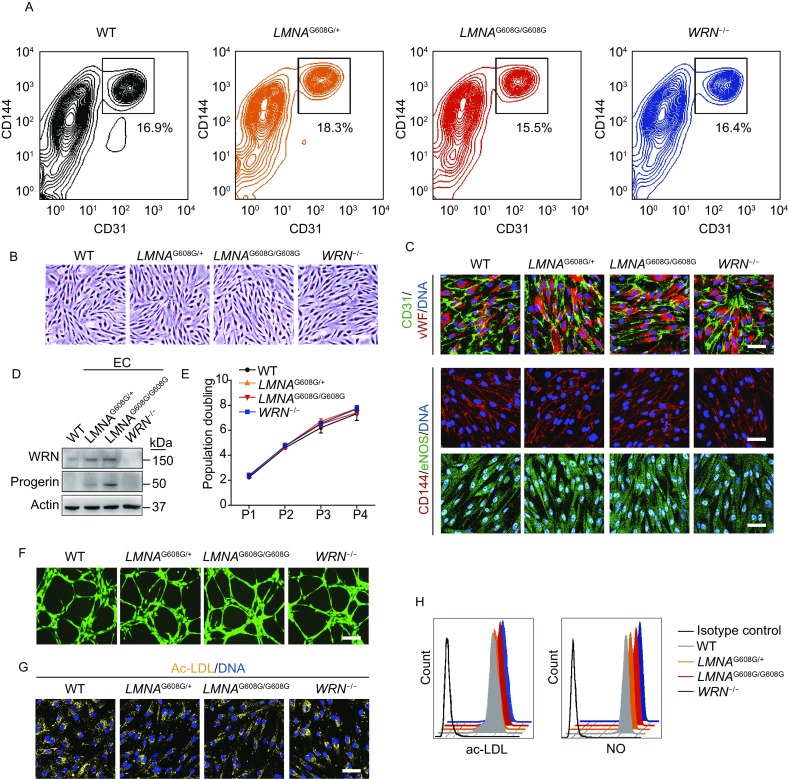
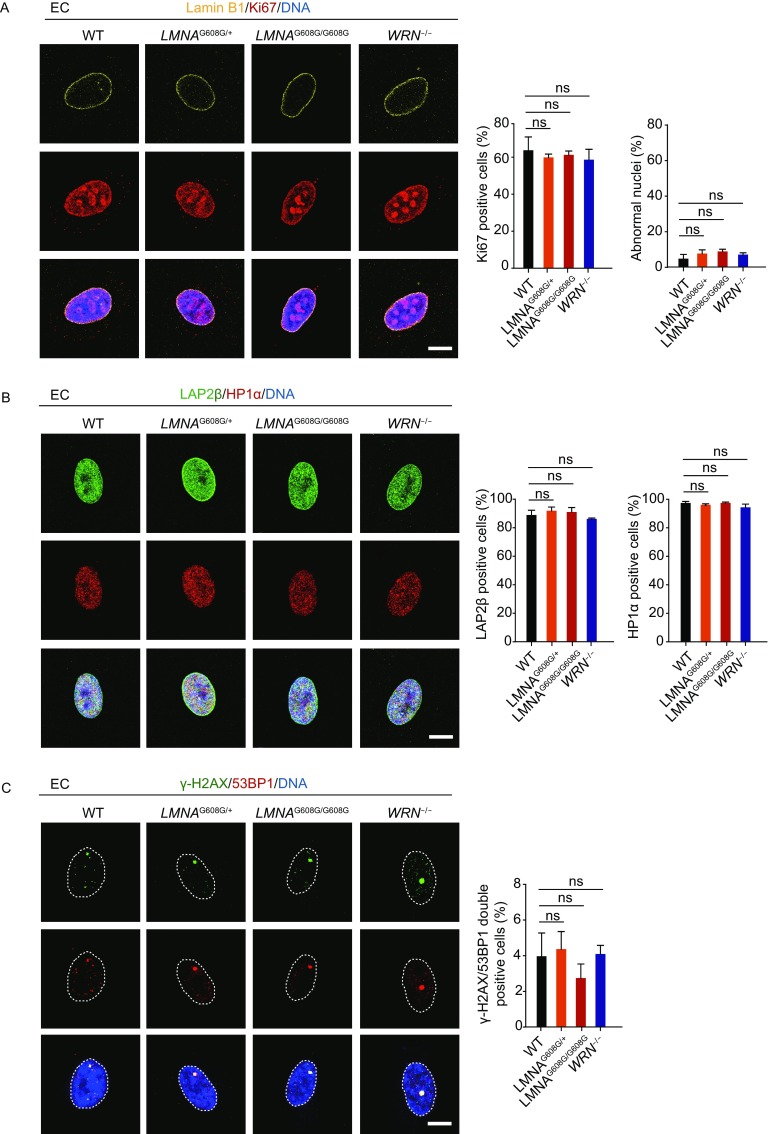
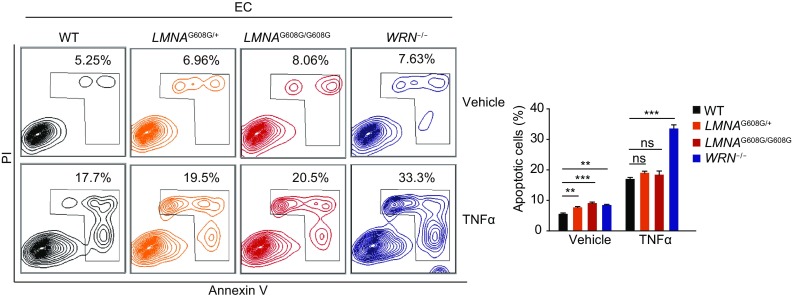
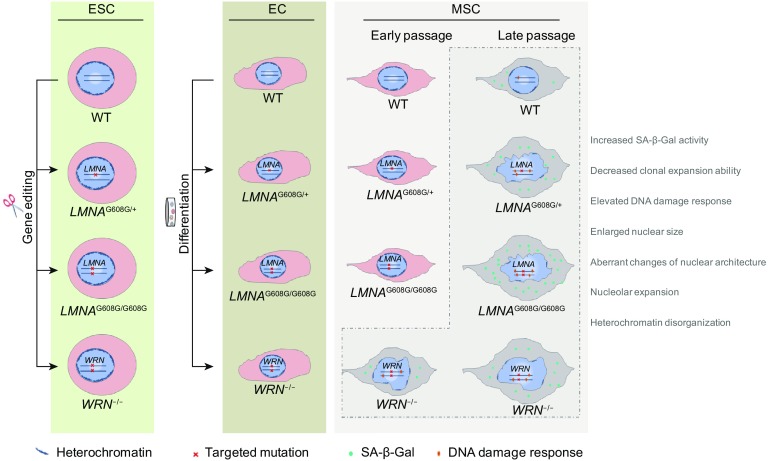
Hutchinson-Gilford progeria syndrome (HGPS) and Werner syndrome (WS) are two of the best characterized human progeroid syndromes. HGPS is caused by a point mutation in lamin A (LMNA) gene, resulting in the production of a truncated protein product-progerin. WS is caused by mutations in WRN gene, encoding a loss-of-function RecQ DNA helicase. Here, by gene editing we created isogenic human embryonic stem cells (ESCs) with heterozygous (G608G/+) or homozygous (G608G/G608G) LMNA mutation and biallelic WRN knockout, for modeling HGPS and WS pathogenesis, respectively. While ESCs and endothelial cells (ECs) did not present any features of premature senescence, HGPS- and WS-mesenchymal stem cells (MSCs) showed aging-associated phenotypes with different kinetics. WS-MSCs had early-onset mild premature aging phenotypes while HGPS-MSCs exhibited late-onset acute premature aging characterisitcs. Taken together, our study compares and contrasts the distinct pathologies underpinning the two premature aging disorders, and provides reliable stem-cell based models to identify new therapeutic strategies for pathological and physiological aging.

Keywords: HGPS; WRN; Werner syndrome; aging; lamin; stem cell.


Figures

Figure 1
Figure 1
Generation of the heterozygous (LMNAG608G/+) and homozygous (LMNAG608G/G608G) ESCs. (A) Schematic representation of LMNA gene editing strategy by HDAdV-mediated homologous recombination. Blue triangles, FRT sites. (B) Morphology and immunofluorescence analysis of the pluripotency markers in WT, heterozygous (LMNAG608G/+), homozygous (LMNAG608G/G608G) and WRN−/− ESCs. Scale bar, 100 μm (left); 25 μm (right). (C) Confirmation of the heterozygous and homozygous mutation of LMNA by DNA sequencing. (D) Immunoblotting analysis of progerin and WRN expression in WT, heterozygous (LMNAG608G/+), homozygous (LMNAG608G/G608G) and WRN−/− ESCs. Progerin expression in homozygous (LMNAG608G/G608G) MSCs was carried out as a positive control
Figure 2
Figure 2
Characterization of HGPS-ESCs and WS-ESCs. (A) Karyotyping analysis of heterozygous (LMNAG608G/+) and homozygous (LMNAG608G/G608G) ESCs. (B) DNA methylation analysis of the OCT4 promoter region. (C) Immunostaining of representative markers of three germ layers in teratomas derived from heterozygous (LMNAG608G/+), homozygous (LMNAG608G/G608G) and WRN−/− ESCs. Scale bar, 50 μm. (D) Ki67 immunostaining analysis of WT, heterozygous (LMNAG608G/+), homozygous (LMNAG608G/G608G) and WRN−/− ESCs. Scale bar, 25 μm. All cells were Ki67 positive. (E) Cell cycle analysis of ESCs. Data were presented as mean ± SEM, n = 3. (F) Representative immunofluorescence staining of LAP2β and HP1α in ESCs. Scale bar, 25 μm. All cells were LAP2β and HP1α positive. (G) Western blot analysis of LAP2β, HP1α and H3K9me3 expression in ESCs
Figure 3
Figure 3
Acquisition and characterization of HGPS-MSCs and WS-MSCs. (A) FACS analysis of MSC-specific markers (CD73, CD90, CD105) in WT, heterozygous (LMNAG608G/+), homozygous (LMNAG608G/G608G) and WRN−/− MSCs. (B) Left: characterization of adipogenesis potential of MSCs by Oil Red O staining. Right: Oil Red O positive areas were calculated by Image J. Data were presented as mean ± SEM, n = 3. *P < 0.05; ns, not significant. Scale bar, 100 μm. (C) Left: characterization of osteogenesis potential of MSCs by Von Kossa staining. Right: Von Kossa positive areas were calculated by Image J. Data were presented as mean ± SEM, n = 3. *P < 0.05; ns, not significant. Scale bar, 100 μm. (D) Left: characterization of chondrogenesis potential of MSCs by Toluidine Blue O staining. Right: the diameters of chondrocyte spheres were measured. Data were presented as mean ± SEM, n = 11. ns, not significant. Scale bar, 100 μm
Figure 4
Figure 4
Phenotypic analyses of HGPS-MSCs and WS-MSCs indicate different kinetics between cell models of two different progeroid syndromes. (A) Growth curve showing the population doubling of MSCs, n = 3. (B) Cell cycle analysis of MSCs at passage 3 and passage 9. Data were presented as mean ± SEM, n = 3. (C) Analysis of clonal expansion abilities of WT, heterozygous (LMNAG608G/+), homozygous (LMNAG608G/G608G) and WRN−/− MSCs. Upper: representative images of crystal violet staining at passage 9. Lower: relative clonal expansion abilities at passage 3 and passage 9. Data were shown as mean ± SEM, n = 3. ***P < 0.001; ns, not significant. (D) Analysis of SA-β-Gal activity in WT, heterozygous (LMNAG608G/+), homozygous (LMNAG608G/G608G) and WRN−/− MSCs. Upper: representative images of SA-β-Gal staining at passage 9. Lower: frequency of SA-β-Gal positive cells. n = 3. (E) RT-qPCR analysis of progerin expression in WT, heterozygous (LMNAG608G/+), homozygous (LMNAG608G/G608G) and WRN−/− MSCs at passage 3 and passage 9. Data were shown as mean ± SEM, n = 3. ***P < 0.001; ns, not significant. (F) Western blot analysis of aging-related markers in WT, heterozygous (LMNAG608G/+), homozygous (LMNAG608G/G608G) and WRN−/− MSCs at passage 3 and passage 9. β-Tubulin were used as loading controls
Figure 5
Figure 5
Immunostaining of aging-related markers in HGPS-MSCs and WS-MSCs demonstrates different aging kinetics. (A) Left: representative immunostaining of LAP2β and Ki67 in WT, heterozygous (LMNAG608G/+), homozygous (LMNAG608G/G608G) and WRN−/− MSCs. Dashed lines indicate the nuclear boundaries and white arrows indicate abnormal nuclei. Scale bar, 10 μm. Right: percentages of LAP2β positive cells (upper) and Ki67 positive cells (lower) were shown as mean ± SEM, number of cells ≥ 300. ***P < 0.001; ns, not significant. (B) Left: representative immunostaining of progerin and HP1α in WT, heterozygous (LMNAG608G/+), homozygous (LMNAG608G/G608G) and WRN−/− MSCs. Dashed lines indicate the nuclear boundaries and white arrows indicate abnormal nuclei. Scale bar, 10 μm. Right: percentages of progerin positive cells (upper) and HP1α positive cells (lower) were shown as mean ± SEM, number of cells ≥ 300. ***P < 0.001; **P < 0.01; ns, not significant
Figure 6
Figure 6
Immunofluorescence analysis of DNA damage response and nucleolar changes in HGPS-MSCs and WS-MSCs. (A) Left: representative immunostaining of γ-H2AX and 53BP1 in WT, heterozygous (LMNAG608G/+), homozygous (LMNAG608G/G608G) and WRN−/− MSCs. Dashed lines indicate the nuclear boundaries and white arrows indicate abnormal nuclei. Scale bar, 10 μm. Right: percentages of cells with aberrant nuclear architecture (upper) and γ-H2AX/53BP1 double-positive cells (lower) were shown as mean ± SEM, number of cells ≥ 300. ***P < 0.001; **P < 0.01; *P < 0.05; ns, not significant. (B) Left: representative immunostaining of Ki67 and nucleolin in WT, heterozygous (LMNAG608G/+), homozygous (LMNAG608G/G608G) and WRN−/− MSCs. Dashed lines indicate the nuclear boundaries and white arrows indicate abnormal nuclei. Scale bar, 10 μm. Right: percentages of cells with different numbers of nucleoli were shown as mean ± SEM, number of cells ≥ 300. Upper, passage 3; lower, passage 9
Figure 7
Figure 7
Acquisition and characterization of HGPS-ECs and WS-ECs. (A) CD31/CD144 positive cells were sorted as ECs by FACS. (B) Representative morphology of WT, heterozygous (LMNAG608G/+), homozygous (LMNAG608G/G608G) and WRN−/− ECs. Scale bar, 50 μm. (C) Immunostaining of EC-specific markers (CD31/vWF/CD144/eNOS) in WT, heterozygous (LMNAG608G/+), homozygous (LMNAG608G/G608G) and WRN−/− ECs. Scale bar, 50 μm. (D) Western blot analysis of WRN and progerin expression in WT, heterozygous (LMNAG608G/+), homozygous (LMNAG608G/G608G) and WRN−/− ECs. Actin was used as loading control. (E) Growth curve analysis showing the population doubling of ECs, n = 3. (F) The abilities of in vitro tube formation in WT, heterozygous (LMNAG608G/+), homozygous (LMNAG608G/G608G) and WRN−/− ECs. Cells were stained by Calcein-AM. (G) The uptake abilities of Dil-Ac-LDL in WT, heterozygous (LMNAG608G/+), homozygous (LMNAG608G/G608G) and WRN−/− ECs. Scale bar, 50 μm.(H) Measurement of Dil-Ac-LDL and nitric oxide (NO) by FACS in WT, heterozygous (LMNAG608G/+), homozygous (LMNAG608G/G608G) and WRN−/− ECs
Figure 8
Figure 8
HGPS-ECs and WS-ECs do not exhibit phenotypes of accelerated senescence. (A) Left: representative immunostaining of Lamin B1 and Ki67 in WT, heterozygous (LMNAG608G/+), homozygous (LMNAG608G/G608G) and WRN−/− ECs. Scale bar, 10 μm. Right: percentages of Ki67 positive cells and abnormal nuclei were shown as mean ± SEM, number of cells ≥ 300. ns, not significant. (B) Left: representative immunostaining of LAP2β and HP1α in WT, heterozygous (LMNAG608G/+), homozygous (LMNAG608G/G608G) and WRN−/− ECs. Scale bar, 10 μm. Right: percentages of LAP2β positive cells and HP1α positive cells were shown as mean ± SEM, number of cells ≥ 300. ns, not significant. (C) Left: representative immunostaining of γ-H2AX and 53BP1 in WT, heterozygous (LMNAG608G/+), homozygous (LMNAG608G/G608G) and WRN−/− ECs. Dashed lines indicate the nuclear boundaries. Scale bar, 10 μm. Right: percentages of γ-H2AX/53BP1 double-positive cells were shown as mean ± SEM, number of cells ≥ 300. ns, not significant
Figure 9
Figure 9
Cellular apoptosis analysis in HGPS-ECs and WS-ECs. Left: cellular apoptosis analysis by FACS after treatment with vehicle or TNFα in WT, heterozygous (LMNAG608G/+), homozygous (LMNAG608G/G608G) and WRN−/− ECs. Right: percentages of apoptotic cells were presented as mean ± SEM, n = 3. ***P < 0.001; **P < 0.01; ns, not significant
Figure 10
Figure 10
Schematic drawing of the major cellular phenotypes observed in HGPS- and WS-specific ESCs, ECs and MSCs. HGPS-ESCs and WS-ESCs were generated by gene editing under the same genetic background, and further differentiated to ECs and MSCs. LMNA-mutant and WRN-deficient ESCs or ECs show no accelerated senescence related defects, while HGPS-MSCs and WS-MSCs exhibited aging-associated phenotypes with different kinetics, including self-renewal ability, DNA damage response, nucleolar expansion, as well as nuclear architecture and heterochromatin alterations. WS-MSCs had early-onset mild premature aging phenotypes while HGPS-MSCs exhibited late-onset acute premature aging characterisitics

References

    1. Adelfalk C, Scherthan H, Hirsch-Kauffmann M, Schweiger M. Nuclear deformation characterizes Werner syndrome cells. Cell Bbiol Int. 2005;29:1032–1037. doi: 10.1016/j.cellbi.2005.10.011. - DOI - PubMed
    1. Atchison L, Zhang H, Cao K, Truskey GA. A tissue engineered blood vessel model of Hutchinson-Gilford progeria syndrome using human iPSC-derived smooth muscle cells. Sci Rep. 2017;7:8168. doi: 10.1038/s41598-017-08632-4. - DOI - PMC - PubMed
    1. Bochenek ML, Schutz E, Schafer K. Endothelial cell senescence and thrombosis: ageing clots. Thromb Res. 2016;147:36–45. doi: 10.1016/j.thromres.2016.09.019. - DOI - PubMed
    1. Brunauer R, Kennedy BK. Medicine. Progeria accelerates adult stem cell aging. Science. 2015;348:1093–1094. doi: 10.1126/science.aac4214. - DOI - PubMed
    1. Buchwalter A, Hetzer MW. Nucleolar expansion and elevated protein translation in premature aging. Nat Commun. 2017;8:328. doi: 10.1038/s41467-017-00322-z. - DOI - PMC - PubMed

Publication types