. 2018:1745:47-63.
doi: 10.1007/978-1-4939-7680-5_3.

Image-Based Tracking of Heterogeneous Single-Cell Phenotypes

Affiliations

Image-Based Tracking of Heterogeneous Single-Cell Phenotypes

Katherin Patsch et al. Methods Mol Biol. 2018.

Abstract

Cells display broad heterogeneity across multiple phenotypic features, including motility, morphology, and cell signaling. Live-cell imaging techniques are beginning to capture the importance and interdependence of these phenomena. However, existing image analysis pipelines often fail to capture the intricate changes that occur in small subpopulations, either due to poor segmentation protocols or cell tracking errors. Here we report a pipeline designed to image and track single-cell dynamic phenotypes in heterogeneous cell populations. We provide step-by-step instructions for three phenotypically different cell lines across two time scales as well as recommendations for adaptation to custom data sets. Our protocols include steps for quality control that can be used to filter out erroneous tracks and improve assessment of heterogeneity. We demonstrate possible phenotypic readouts including motility, nuclear receptor translocation, and mitosis.

Keywords: Heterogeneity; Live-cell imaging; Mitosis; Motility; Phenotypes; Receptor translocation; Tracking.


Figures
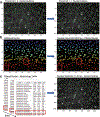
Fig. 1
Fig. 1
Step-by-step fine-tuning of nuclear segmentation. Example Test Mode images of PC3 cells to adjust (a) threshold, (b) nuclear area, and (c) nuclear diameter to custom data sets. (a) Outlines in yellow represent border objects; outlines in magenta represent objects outside of nuclear diameter range. Green outlines are retained nuclei. (b) Boxes demonstrate objects rejected due to below threshold nuclear area. (c) Morphology table contains feature values to adjust nuclear diameter. Outlines in magenta represent objects outside of diameter range. Green outlines are retained nuclei
Fig. 2
Fig. 2
Computation of the track quality metric TrAM. Top: snapshot of TrackQC module and associated settings. Middle: press button to select measurements opens a new window with check boxes to select features for computation of TrAM. Bottom: TrAM histogram visualizes distribution across filtered nuclei. Low TrAM values represent higher-quality tracks
Fig. 3
Fig. 3
Overview of TrAM filtering to measure heterogeneity. (a) TrAM histogram to determine cutoff (red line). (b) Verification of TrAM cutoff. Cell not rejected due to low TrAM value (TrAM = 3.1) vs. cell filtered out due to high TrAM value (TrAM = 7.1). Nuclear segmentation images are shown after 3 min and 6 min imaging. (c) Speed distribution of PC3 cells before and after TrAM filtering

References

    1. Purvis JE, Lahav G (2013) Encoding and decoding cellular information through signaling dynamics. Cell 152:945–956. 10.1016/j.cell.2013.02.005 - DOI - PMC - PubMed
    1. Altschuler SJ, L FW (2010) Cellular heterogeneity: do differences make a difference? Cell 141:559–563. 10.1016/j.cell.2010.04.033 - DOI - PMC - PubMed
    1. Snijder B, Pelkmans L (2011) Origins of regulated cell-to-cell variability. Nat Rev Mol Cell Biol 12:119–125. 10.1038/nrm3044 - DOI - PubMed
    1. Patsch K, Chiu C-L, Engeln M et al. (2016) Single cell dynamic phenotyping. Sci Rep 6:34785. 10.1038/srep34785 - DOI - PMC - PubMed
    1. Aw Yong KM, Zeng Y, Vindivich D et al. (2014) Morphological effects on expression of growth differentiation factor 15 (GDF15), a marker of metastasis. J Cell Physiol 229:362–373. 10.1002/jcp.24458 - DOI - PMC - PubMed

LinkOut - more resources