. 2018 May;108(4):361-378.
doi: 10.1111/mmi.13941. Epub 2018 Mar 23.

The evolutionary impact of intragenic FliA promoters in proteobacteria

Affiliations

The evolutionary impact of intragenic FliA promoters in proteobacteria

Devon M Fitzgerald et al. Mol Microbiol. 2018 May.

Abstract

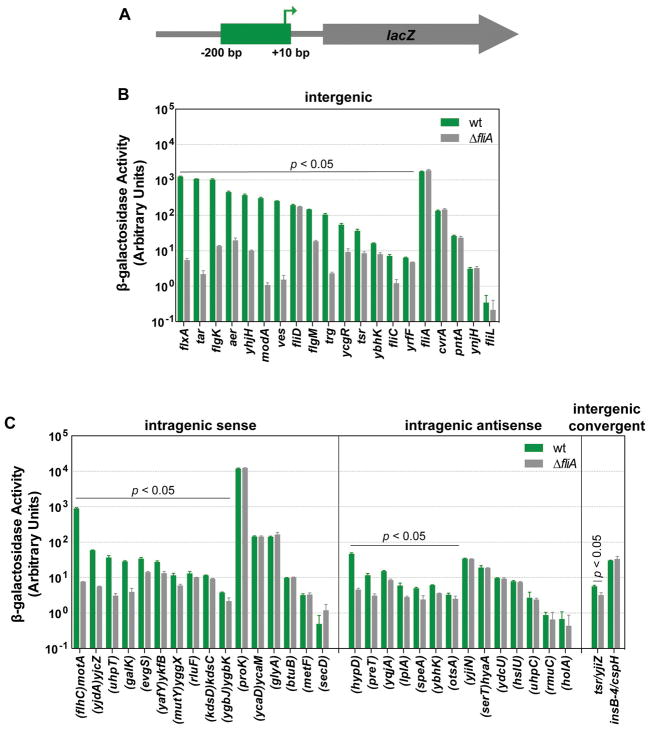
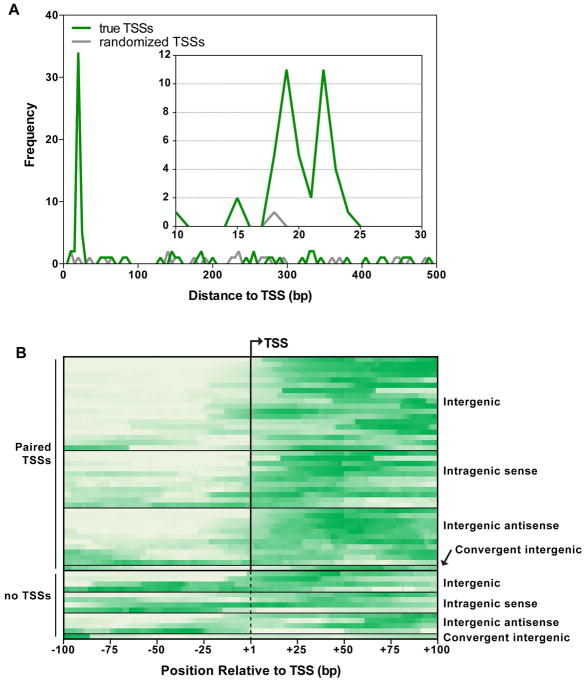
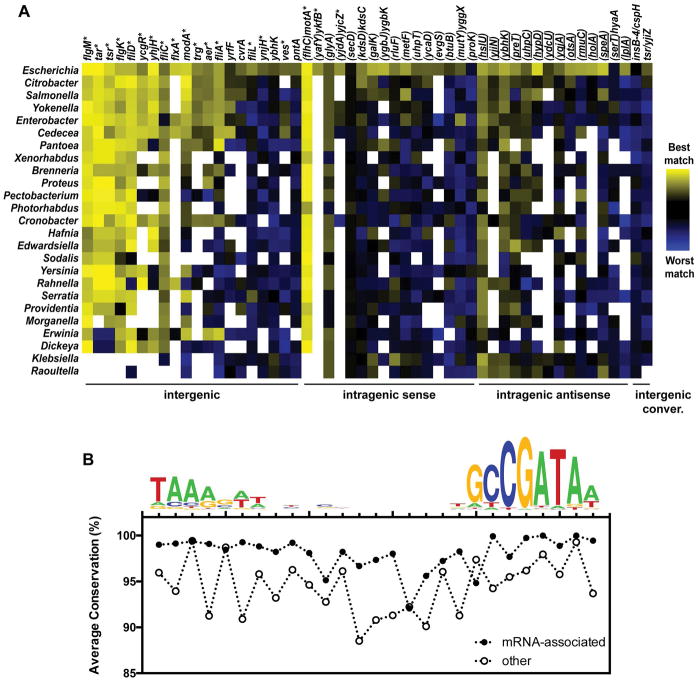
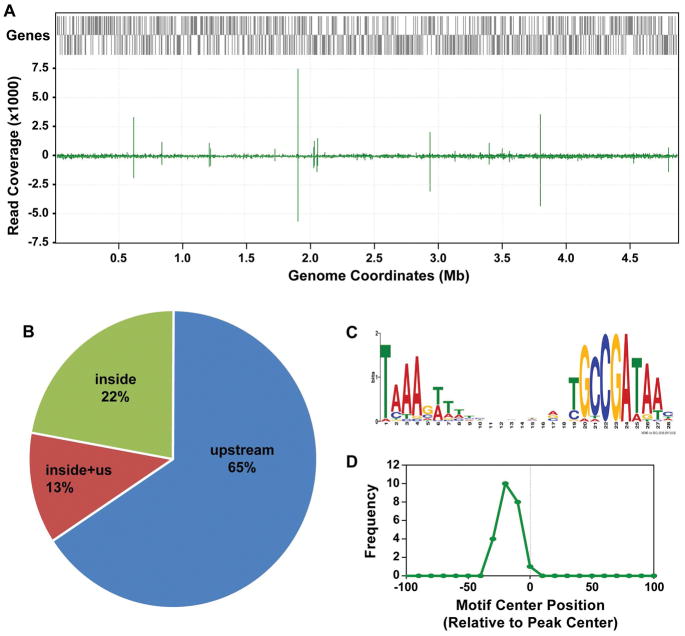
In Escherichia coli, one sigma factor recognizes the majority of promoters, and six 'alternative' sigma factors recognize specific subsets of promoters. The alternative sigma factor FliA (σ28 ) recognizes promoters upstream of many flagellar genes. We previously showed that most E. coli FliA binding sites are located inside genes. However, it was unclear whether these intragenic binding sites represent active promoters. Here, we construct and assay transcriptional promoter-lacZ fusions for all 52 putative FliA promoters previously identified by ChIP-seq. These experiments, coupled with integrative analysis of published genome-scale transcriptional datasets, strongly suggest that most intragenic FliA binding sites are active promoters that transcribe highly unstable RNAs. Additionally, we show that widespread intragenic FliA-dependent transcription may be a conserved phenomenon, but that specific promoters are not themselves conserved. We conclude that intragenic FliA-dependent promoters and the resulting RNAs are unlikely to have important regulatory functions. Nonetheless, one intragenic FliA promoter is broadly conserved and constrains evolution of the overlapping protein-coding gene. Thus, our data indicate that intragenic regulatory elements can influence bacterial protein evolution and suggest that the impact of intragenic regulatory sequences on genome evolution should be considered more broadly.


Figures

Figure 1
Figure 1. Identification of transcriptionally active FliA binding sites using reporter gene fusions
(A) Schematic of transcriptional fusions of potential FliA promoters to the lacZ reporter gene. For all FliA binding sites identified in a previous study, transcriptional fusions to lacZ were constructed using positions −200 to +10 relative to the predicted TSS based on the previously identified FliA binding motif (Fitzgerald et al., 2014). (B) β-galactosidase activity for transcriptional fusions for FliA binding sites in intergenic regions upstream of genes, for wild-type (wt; DMF122; green bars) and ΔfliA (DMF123; gray bars) cells. Reporter fusions that showed significantly lower β-galactosidase activity in ΔfliA cells than wild-type cells (t-test p < 0.05) are indicated. The genes downstream of the FliA binding sites are listed on the x-axis. (C) As above, but for FliA binding sites within genes or between convergently transcribed genes. Genes containing FliA binding sites are listed on the x-axis in parentheses. Genes not in parentheses are downstream of the corresponding FliA binding site. Error bars indicate one standard deviation from the mean (n = 3).
Figure 2
Figure 2. Identification of transcriptionally active FliA binding sites by mining genome-scale transcriptome datasets
(A) For each FliA binding site identified previously (Fitzgerald et al., 2014), we determined the distance to each downstream TSS identified previously (Thomason et al., 2015) within a 500 bp range. The frequencies of these distances are plotted in 10 bp bins (green line), with the inset showing the frequency of binding sites 10–30 bp upstream of TSSs with a bin size of 1 bp. The gray line shows the frequency of distances from FliA binding sites to a control, randomized TSS dataset (see Methods). (B) Normalized sequence read coverage from published NET-seq data (Larson et al., 2014) (see Methods) for each previously identified FliA binding site (Fitzgerald et al., 2014), plotted 100 bp upstream and downstream of the known/predicted TSS. Predicted TSSs are indicated by the dashed vertical line. Darker green indicates higher sequence read density.
Figure 3
Figure 3. Sequence conservation of FliA binding sites between E. coli and related bacterial species
(A) Heat-map depicting the match to the FliA consensus binding site for regions in the genomes of a range of bacterial species, where the region analyzed is homologous to a region surrounding a FliA binding site in E. coli. Genera are listed on the left. E. coli genes associated with the binding sites are listed across the top of the heat-map. FliA binding sites are grouped by location/orientation category, as indicated by category labels across the bottom of the heat-map. Genes containing FliA binding sites are listed in parentheses. Genes not in parentheses are downstream of the corresponding FliA binding site. The color scale indicating the strength of the sequence match is shown next to the heat-map. Empty squares in the heat-map indicate that the corresponding genomic region in E. coli is not sufficiently conserved in the species being analyzed. (B) Conservation of FliA sites across 9,432 E. coli strains. For each site from E. coli K-12, conservation was determined at each position within the site for all strains of E. coli where the surrounding sequence is conserved. Thus, the fraction of genomes in which each base is conserved was calculated. Values plotted represent the average (mean) level of conservation for (i) 18 FliA sites that represent promoters for mRNAs (filled circles; Table 1), and (ii) the remaining 34 FliA sites (empty circles). The FliA binding motif is shown above the graph as a reference point for each of the site positions.
Figure 4
Figure 4. Identification of FliA binding sites in Salmonella Typhimurium using ChIP-seq
(A) Sequence read coverage across the S. Typhiumurium genome for a FliA ChIP-seq dataset. Annotated genes are indicated by gray bars. The green graph shows relative sequence read coverage, with “spikes” corresponding to sites of FliA association. (B) Pie-chart showing the distribution of identified FliA binding sites relative to genes. “Inside” = FliA binding within a gene. “Upstream” = FliA binding upstream of a gene. “Inside + us” = FliA binding within a gene but within 300 bp of a downstream gene start. (C) Enriched sequence motif associated with FliA binding sites identified by ChIP-seq. (D) Distribution of motifs relative to ChIP-seq peak centers for all FliA binding sites identified by ChIP-seq. Motifs are enriched in the region ~25 bp upstream of the peak center, relative to the motif orientation.
Figure 5
Figure 5. Transcriptome analysis of the FliA regulon in Salmonella Typhimurium
The scatter-plot shows normalized expression (see Methods) for each gene in S. Typhimurium for wild-type cells (14028s; x-axis) or ΔfliA cells (DMF088; y-axis). Gray dots represent genes that are not associated with a FliA binding site and are not significantly differentially expressed between wild-type and ΔfliA cells. Black dots represent genes that are not associated with a FliA binding site and are significantly differentially expressed between wild-type and ΔfliA cells. Green circles represent genes that are associated with an upstream FliA binding site. Green triangles represent genes that are associated with an internal FliA binding site. Filled green circles/triangles indicate genes that are significantly differentially expressed between wild-type and ΔfliA cells. Empty green circles/triangles represent genes that are not differentially expressed between wild-type and ΔfliA cells.
Figure 6
Figure 6. The FliA promoter within flhC constrains evolution of FlhC amino acid sequence
(A) Sequence conservation of FlhC amino acid sequence between E. coli and 51 other γ-proteobacterial species. The graph indicates the level of identity across all species analyzed for each amino acid in FlhC; data for Ala177 and Asp178 are highlighted in red. The nucleotide sequence of flhC in the motA promoter region is indicated, aligned with the previously reported FliA binding motif logo (Fitzgerald et al., 2014). Codons 177 and 178 are shown in red. (B) Motility assay for ΔflhC::thyA E. coli (CDS105) containing either empty vector (pBAD30), or plasmid expressing wild-type FlhC (pCDS043) or D178A mutant FlhC (pCDS044). Dashed red circles indicate the inoculation sites. Plates were incubated for 7 hours. The schematic to the left of the plate image shows how the strain was constructed. (C) Enriched sequence motif found in the flhC-motA intergenic regions of species in which FlhC Asp178 is not conserved. This motif is a close match to the known FliA binding site consensus.

References

    1. Altschul SF, Gish W, Miller W, Myers EW, Lipman DJ. Basic local alignment search tool. J Mol Biol. 1990;215:403–410. - PubMed
    1. Altschul SF, Madden TL, Schaffer AA, Zhang J, Zhang Z, Miller W, Lipman DJ. Gapped BLAST and PSI-BLAST: a new generation of protein database search programs. Nucleic Acids Res. 1997;25:3389–3402. - PMC - PubMed
    1. Bailey TL, Elkan C. Fitting a mixture model by expectation maximization to discover motifs in biopolymers. Proc Int Conf Intell Syst Mol Biol. 1994;2:28–36. - PubMed
    1. Beauregard A, Smith EA, Petrone BL, Singh N, Karch C, McDonough KA, Wade JT. Identification and characterization of small RNAs in Yersinia pestis. RNA Biol. 2013;10:397–405. - PMC - PubMed
    1. Bono AC, Hartman CE, Solaimanpour S, Tong H, Porwollik S, McClelland M, et al. Novel DNA Binding and Regulatory Activities for σ(54) (RpoN) in Salmonella enterica Serovar Typhimurium 14028s. J Bacteriol. 2017:199. - PMC - PubMed

Publication types

LinkOut - more resources