. 2018 Nov;28(6):902-919.
doi: 10.1111/bpa.12595. Epub 2018 Apr 10.

Epigenomic signature of adrenoleukodystrophy predicts compromised oligodendrocyte differentiation

Affiliations

Epigenomic signature of adrenoleukodystrophy predicts compromised oligodendrocyte differentiation

Agatha Schlüter et al. Brain Pathol. 2018 Nov.

Abstract

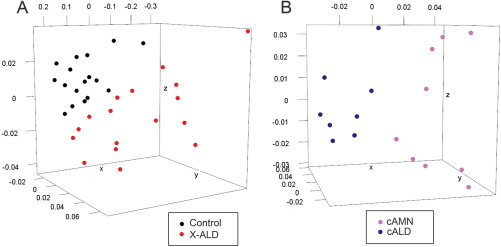
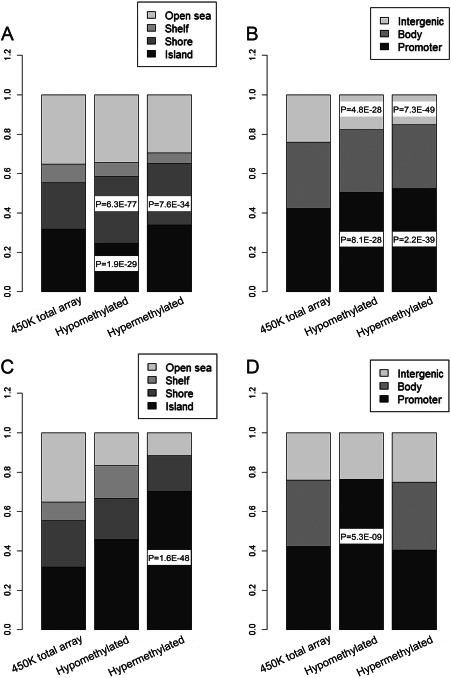
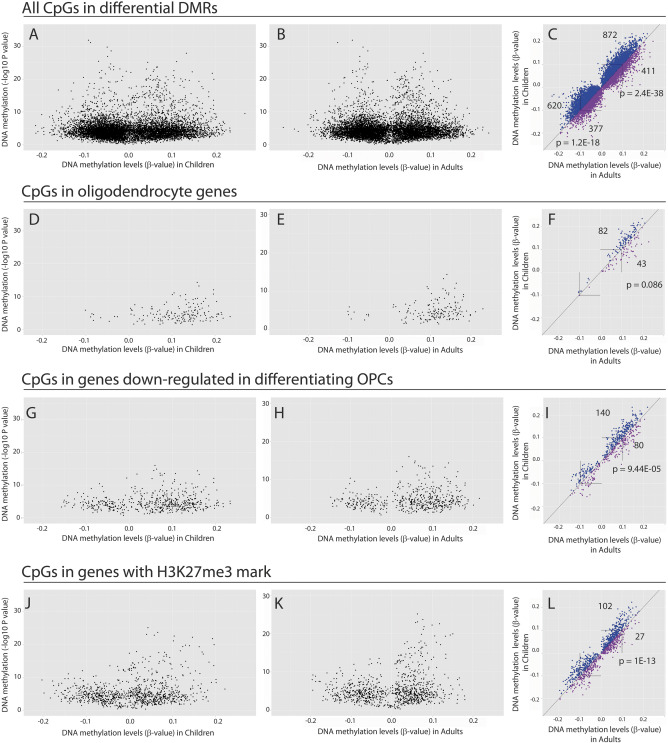
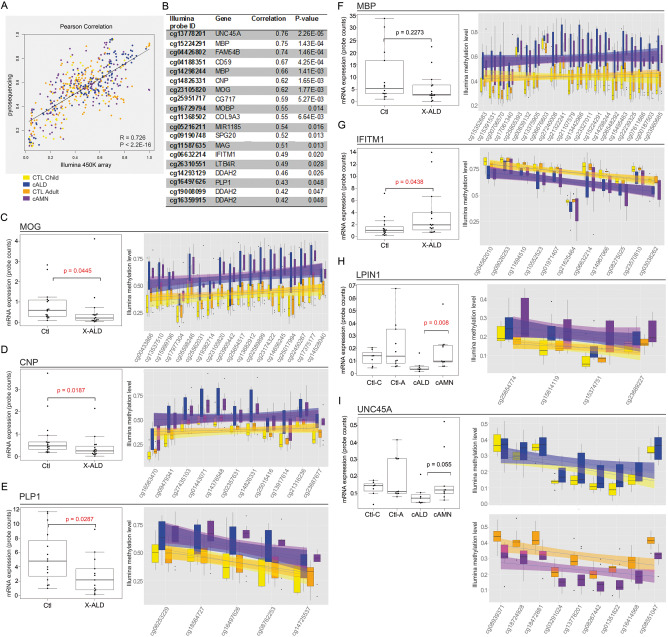
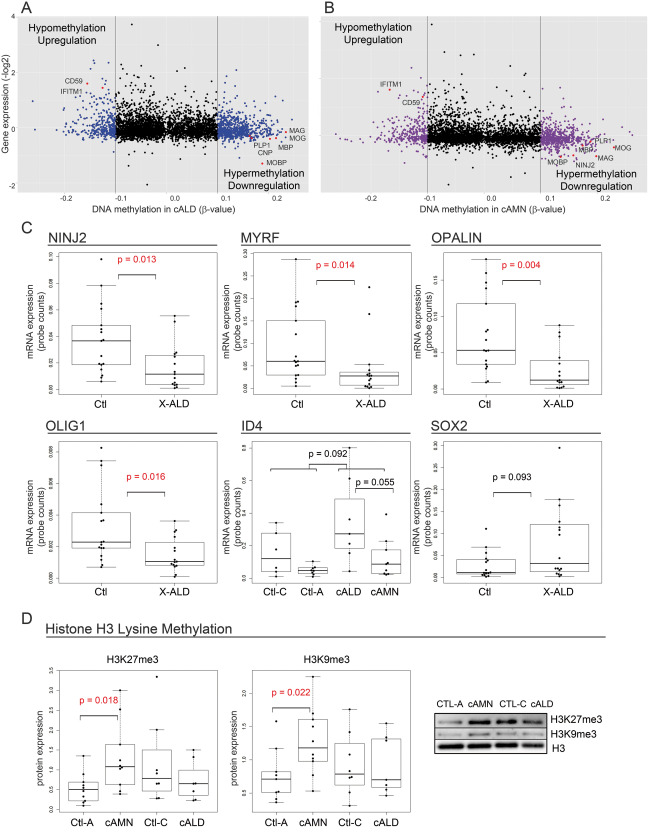
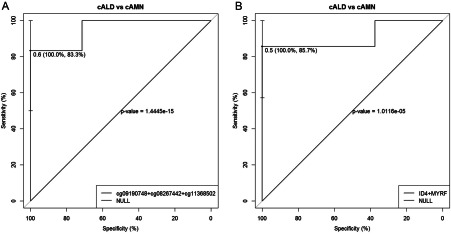
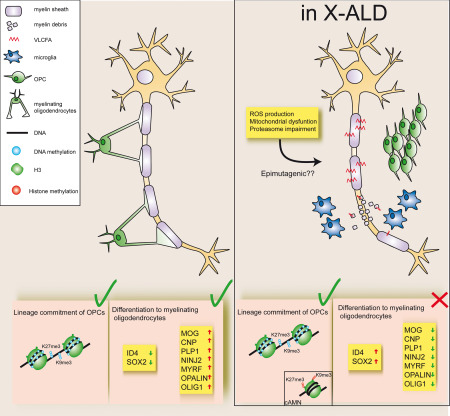
Epigenomic changes may either cause disease or modulate its expressivity, adding a layer of complexity to mendelian diseases. X-linked adrenoleukodystrophy (X-ALD) is a rare neurometabolic condition exhibiting discordant phenotypes, ranging from a childhood cerebral inflammatory demyelination (cALD) to an adult-onset mild axonopathy in spinal cords (AMN). The AMN form may occur with superimposed inflammatory brain demyelination (cAMN). All patients harbor loss of function mutations in the ABCD1 peroxisomal transporter of very-long chain fatty acids. The factors that account for the lack of genotype-phenotype correlation, even within the same family, remain largely unknown. To gain insight into this matter, here we compared the genome-wide DNA methylation profiles of morphologically intact frontal white matter areas of children affected by cALD with adult cAMN patients, including male controls in the same age group. We identified a common methylomic signature between the two phenotypes, comprising (i) hypermethylation of genes harboring the H3K27me3 mark at promoter regions, (ii) hypermethylation of genes with major roles in oligodendrocyte differentiation such as MBP, CNP, MOG and PLP1 and (iii) hypomethylation of immune-associated genes such as IFITM1 and CD59. Moreover, we found increased hypermethylation in CpGs of genes involved in oligodendrocyte differentiation, and also in genes with H3K27me3 marks in their promoter regions in cALD compared with cAMN, correlating with transcriptional and translational changes. Further, using a penalized logistic regression model, we identified the combined methylation levels of SPG20, UNC45A and COL9A3 and also, the combined expression levels of ID4 and MYRF to be good markers capable of discriminating childhood from adult inflammatory phenotypes. We thus propose the hypothesis that an epigenetically controlled, altered transcriptional program may drive an impaired oligodendrocyte differentiation and aberrant immune activation in X-ALD patients. These results shed light into disease pathomechanisms and uncover putative biomarkers of interest for prognosis and phenotypic stratification.

Keywords: adrenoleukodystrophy; epigenetics; myelin; neurodegeneration; oligodendrocytes; peroxisome.


Conflict of interest statement

None declared

Figures

Figure 1
Figure 1
Three‐dimensional multidimensional scaling (MDS) plot of methylation levels in β‐values, which is a method measuring the intensities of the methylation, ranging from 0 to 1, from differential CpGs. In (A), common methylation differences in 17 child and adult X‐ALD samples with respect to those in 17 controls, and in (B), methylation differences between 8 cALD and 9 cAMN samples. We used the RGL package for 3D visualization.
Figure 2
Figure 2
Circos plot of common genome‐wide DNA methylation changes in cALD and cAMN brains of X‐ALD patients with respect to methylation in controls. The outermost ring shows the RefSeq genes associated with differentially methylated DMRs: genes associated with hypomethylated and hypermethylated DMRs are shown in purple and blue, respectively. The second circle represents genome positions according to chromosome (black lines are cytobands). The third and fourth circles represent the β‐value difference between X‐ALD and controls in the same age group for significant DMRs in cALD and cAMN samples, respectively. Blue lines signify hypermethylated regions, and purple lines signify hypomethylated regions, with the length of each line representing the difference level. Each line also marks the location of the Illumina 450K probe distribution along the genome. The innermost red line represents the best Fisher's method −log10(P value) per 1‐kb window analyzed within the merged DMR represented. For a clear representation, only gene names with an FDR P value <1 E – 10 are shown. Circular plots were drawn with the software application OmicCircos 29.
Figure 3
Figure 3
Circos plot of genome‐wide DNA methylation differences between cALD and cAMN brains of X‐ALD patients. The outermost ring shows the RefSeq genes associated with differentially methylated DMRs: genes associated with hypomethylated and hypermethylated DMRs are shown in purple and blue, respectively. The second circle represents genome positions by chromosomes (black lines are cytobands). The third and fourth circles represent the β‐value difference between cALD and cAMN after age correction for significant DMRs, respectively. Blue lines signify hypermethylated regions, and purple lines signify hypomethylated regions, with the length of each line representing the difference level. Each line also marks the location of the Illumina 450K probe distribution along the genome. The innermost red line represents the best Fisher's method −log10(P value) per 1‐kb window analyzed within the merged DMR represented. Circular plots were drawn with the software application OmicCircos 29.
Figure 4
Figure 4
CpG distribution in X‐ALD patients. Distribution of CpG in islands, shores, shelves and open sea (A, C) relative to RefSeq gene promoters, gene bodies and intergenic regions (B, D) in X‐ALD samples with respect to that in controls (A, B) and in cALD samples with respect to that in cAMN (C, D). CpGs in hypomethylated and hypermethylated DMRs are compared with CpGs on the total Illumina array using Fisher's exact test.
Figure 5
Figure 5
Volcano plot of DNA methylation levels for all CpGs and X‐ALD signature CpGs‐associated genes within DMRs identified by sliding window analysis in brains of X‐ALD and controls. The dot marks the CpG mean β‐value difference between childhood (A, D, G and J) and adult (B, E, H and K) X‐ALD with controls for significant windows. Each dot also represents the Fisher's method −log10(P value) for each 1‐kb window analyzed. A, B and C, plots display all CpGs within differential DMRs. D, E and F, plots display CpG‐associated genes enriched in oligodendrocytes in the adult mouse. G, H and I, plots display CpG‐associated genes downregulated during differentiation of Oli‐Neu cells (oligodendroglial precursor, OPCs) in response to PD174265. J, K and L plots display CpG‐associated genes with the trimethyl H3K27 (H3K27me3) mark. In C, F, I and L, plots represent the CpG mean β‐value in cALD with respect to that in cAMN. A blue dot indicates a CpG more methylated in cALD, and a red dot indicates a CpG more methylated in cAMN. The number of CpGs more methylated with a β‐value above 0.1 or below −0.1 with respect to that in the other phenotype is also indicated. The P value was computed using a paired t‐test between the CpG mean β‐value over 0.1 or below −0.1 in cALD and cAMN for each CpG within a differential DMR after age correction.
Figure 6
Figure 6
Concordant methylation changes with gene expression. Pearson's correlation between methylation measured by the Illumina array and pyrosequencing assays. Plot shows methylation data in 30 DNA brain samples in 22 different CpGs (A). Summary of Pearson's correlations of CpG methylation at sites measured by both Illumina array and pyrosequencing assays (B). Box‐and‐whisker plot of quantitative PCR normalized log2 expression in brain samples concordant with differential methylated CpGs within a DMR in associated genes (CI). Concordant hypermethylation and downregulated expression in the oligodendrocyte markers MOG, CNP, PLP1 and MBP (C–F), hypomethylated DMR and upregulation of the immune‐related gene IFITM1 (G), hypermethylation in X‐ALD and differential expression between cALD and cAMN for LPIN1 (H) and concordant methylation‐expression levels with differential expression between cALD and cAMN for UNC45A (I). Methylation levels for X‐ALD and controls are plotted in the box plot, with lines connecting each consecutive CpG assayed fitting a linear model. Whiskers indicate 1.5 times the interquartile range; bottom and top of the boxes, first and third quartiles, respectively; center lines, second quartile. Significant differences were determined by Student's t‐test or Wilcoxon rank sum test, and Kruskall–Wallis or Anova for more than two levels, according to the Shapiro–Wilk normality test.
Figure 7
Figure 7
Coordinated changes in DNA methylation and expression of associated genes for all overlapping genes between Illumina arrays and Affymetrix expression arrays. On the x‐axis, the β‐value for the differentially methylated regions between X‐ALD patients and controls in the same age group for significant windows is shown; on the y‐axis, the log2 expression in cALD and cAMN samples (A and B) are shown, respectively. Box‐and‐whisker plot of quantitative PCR for NINJ2, MYRF, OPALIN, OLIG1, ID4 and SOX2 (C) and WB for H3K27me3 and H3K9me3 (D) in X‐ALD patients. Gene expression was normalized to that of the reference control gene human RPLP0. A representative immunoblot is shown. Protein levels are normalized relative to those of histone 3, and quantification is represented as intensities. Whiskers indicate 1.5 times the interquartile range; bottom and top of the boxes, first and third quartiles, respectively; center lines, second quartiles. Significant differences were determined by Student's t‐test or Wilcoxon rank sum test for pairwise comparisons, and Kruskall–Wallis or Anova for more than two levels, according to the Shapiro–Wilk normality test.
Figure 8
Figure 8
Penalized logistic regression models in X‐ALD. Best ROC curves for penalized logistic regression models using methylation data from 22 CpGs in 23 brain samples. In (A), the combination of the CpGs cg09190748 (SPG20 promoter), cg08267442 (UNC45A promoter) and cg11368502 (COL9A3 promoter) discriminate 100% of the cALD cases and 83.3% of the cAMN cases (AUC = 0.95). In (B), the gene expression of ID4 and MYRF discriminate 100% of the cALD cases and 85.7% of the cAMN cases (AUC = 0.91). The DeLong test was used to compare the areas under two different correlated ROC curves.
Figure 9
Figure 9
Working model of the impaired remyelination process in X‐ALD. VLCFA accumulation in X‐ALD changes the membrane lipid composition in the ganglioside, phosphatidylcholine, proteolipid and cholesterol ester fractions of brain myelin. In response to this demyelinating insult, microglial cells are recruited to the demyelinated area, where they release mediators that mobilize oligodendrocyte precursor cells (OPCs). These precursors are continuously generated from neural stem cells, to the detriment of neuronal precursor cells, and further differentiate into mature myelinating oligodendrocytes and form a thinner myelin sheath around the demyelinated axon. In X‐ALD, however, the oligodendrocyte‐lineage cells fail to differentiate into remyelinating oligodendrocytes. There is a lineage commitment of OPCs in X‐ALD characterized by DNA methylation in genes implicated in the restriction of multipotentiality and heterochromatin formation with histone marks H3K9me3 and H3K27me3 at their promoters (blue circles) and histone modifications H3K9me3 and H3K27me3 of histone H3 (red circles), particularly in cAMN. Nevertheless, the downregulation of oligodendrocyte differentiation inhibitors such as ID4 and SOX2, followed by increased transcript levels of myelin genes such as OLIG1, MOG, CNP, PLP1, MYRF, OPALIN and NINJ2 preceding the differentiation of myelinating oligodendrocytes, is impaired in X‐ALD.

Similar articles

Cited by

References

    1. Altorok N, Coit P, Hughes T, Koelsch KA, Stone DU, Rasmussen A et al (2014) Genome‐wide DNA methylation patterns in naive CD4+ T cells from patients with primary Sjogren's syndrome. Arthritis Rheumatol 66:731–739. - PMC - PubMed
    1. Anlar B, Waye JS, Eng B, Oguz KK (2006) Atypical clinical course in juvenile metachromatic leukodystrophy involving novel arylsulfatase A gene mutations. Dev Med Child Neurol 48:383–387. - PubMed
    1. Armada‐Moreira A, Ribeiro FF, Sebastião AM, Xapelli S (2015) Neuroinflammatory modulators of oligodendrogenesis. Neuroimmunol Neuroinflamm 2:263–273.
    1. Asheuer M, Bieche I, Laurendeau I, Moser A, Hainque B, Vidaud M, Aubourg P (2005) Decreased expression of ABCD4 and BG1 genes early in the pathogenesis of X‐linked adrenoleukodystrophy. Hum Mol Genet 14:1293–1303. - PubMed
    1. Bannister AJ, Kouzarides T (2011) Regulation of chromatin by histone modifications. Cell Res 21:381–395. - PMC - PubMed

Publication types

MeSH terms

Substances