

Morphological and functional analyses of skeletal muscles from an immunodeficient animal model of limb-girdle muscular dystrophy type 2E
- PMID: 29476695
- PMCID: PMC6099247
- DOI: 10.1002/mus.26112
Morphological and functional analyses of skeletal muscles from an immunodeficient animal model of limb-girdle muscular dystrophy type 2E
Abstract
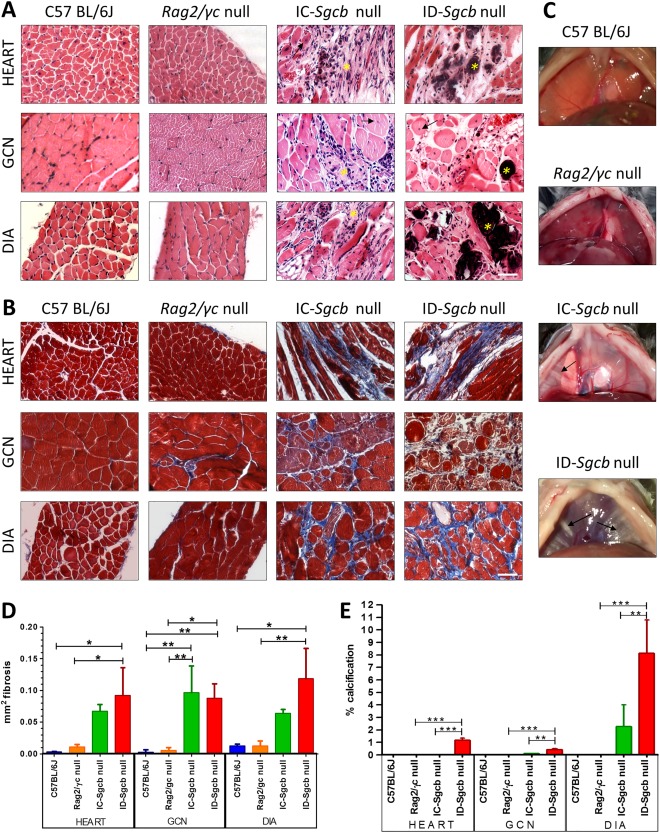
Introduction: Limb-girdle muscular dystrophy type 2E (LGMD2E) is caused by mutations in the β-sarcoglycan gene, which is expressed in skeletal, cardiac, and smooth muscles. β-Sarcoglycan-deficient (Sgcb-null) mice develop severe muscular dystrophy and cardiomyopathy with focal areas of necrosis.
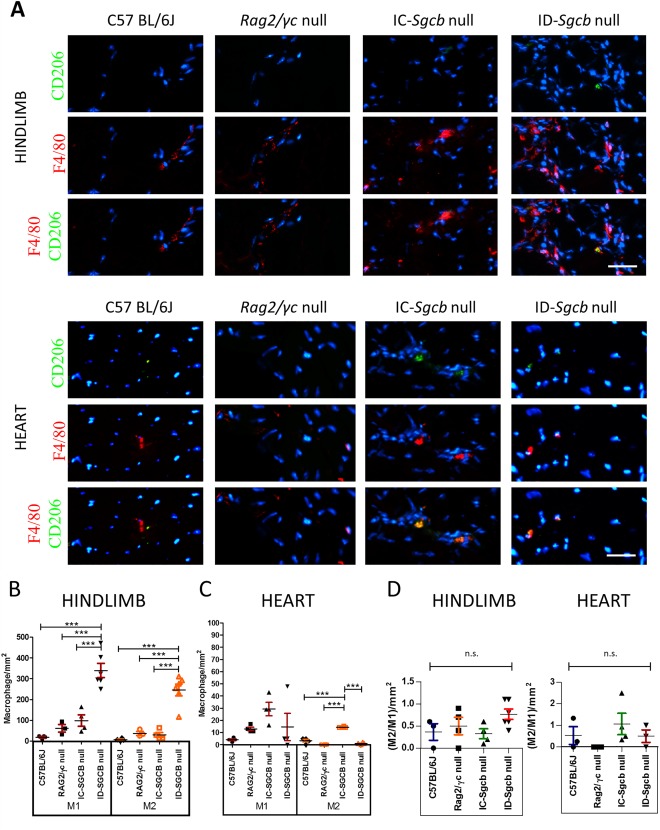
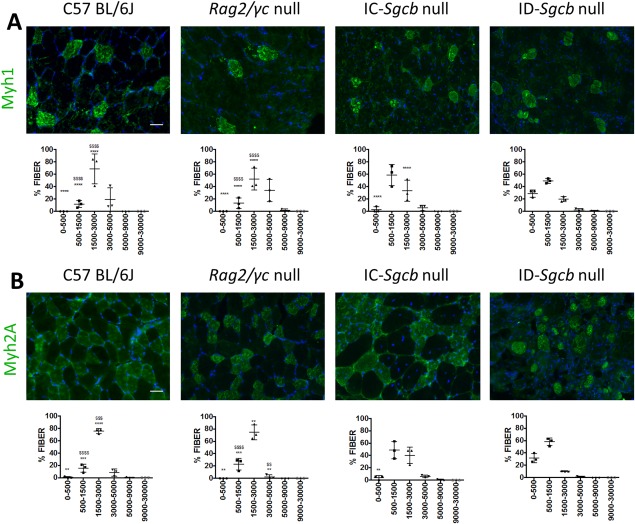
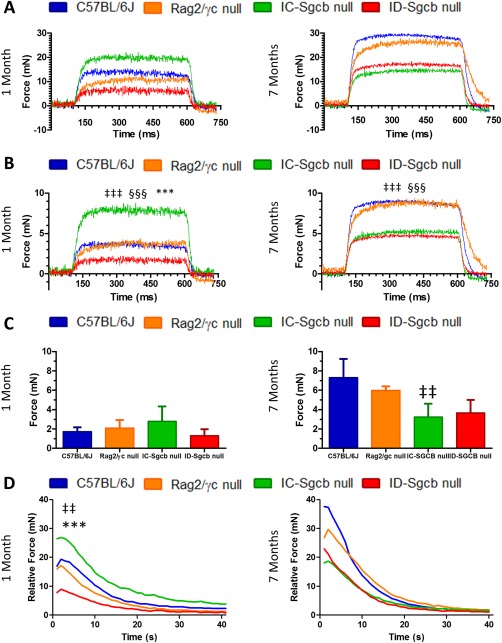
Methods: In this study we performed morphological (histological and cellular characterization) and functional (isometric tetanic force and fatigue) analyses in dystrophic mice. Comparison studies were carried out in 1-month-old (clinical onset of the disease) and 7-month-old control mice (C57Bl/6J, Rag2/γc-null) and immunocompetent and immunodeficient dystrophic mice (Sgcb-null and Sgcb/Rag2/γc-null, respectively).
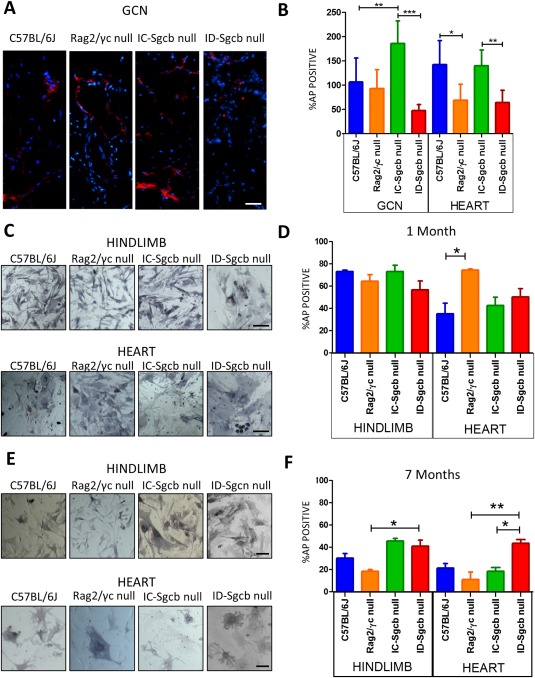
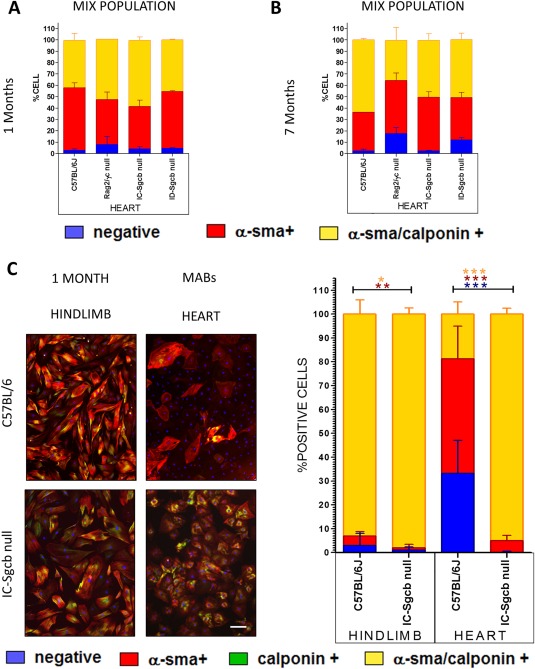
Results: We found that the lack of an immunological system resulted in an increase of calcification in striated muscles without impairing extensor digitorum longus muscle performance. Sgcb/Rag2/γc-null muscles showed a significant reduction of alkaline phosphate-positive mesoangioblasts.
Discussion: The immunological system counteracts skeletal muscle degeneration in the murine model of LGMD2E. Muscle Nerve, 2018.
Keywords: EDL; immunodeficient dystrophic mice; mesoangioblasts; smooth muscle; β-sarcoglycan.
© 2018 The Authors. Muscle & Nerve Published by Wiley Periodicals, Inc.
Figures
Similar articles
-
Disruption of the beta-sarcoglycan gene reveals pathogenetic complexity of limb-girdle muscular dystrophy type 2E.Mol Cell. 2000 Jan;5(1):141-51. doi: 10.1016/s1097-2765(00)80410-4. Mol Cell. 2000. PMID: 10678176
-
Systemic AAV-Mediated β-Sarcoglycan Delivery Targeting Cardiac and Skeletal Muscle Ameliorates Histological and Functional Deficits in LGMD2E Mice.Mol Ther. 2017 Apr 5;25(4):855-869. doi: 10.1016/j.ymthe.2017.02.013. Epub 2017 Mar 9. Mol Ther. 2017. PMID: 28284983 Free PMC article.
-
Fibrosis and inflammation are greater in muscles of beta-sarcoglycan-null mouse than mdx mouse.Cell Tissue Res. 2014 May;356(2):427-43. doi: 10.1007/s00441-014-1854-4. Epub 2014 Apr 11. Cell Tissue Res. 2014. PMID: 24723230
-
Autonomic, locomotor and cardiac abnormalities in a mouse model of muscular dystrophy: targeting the renin-angiotensin system.Exp Physiol. 2014 Apr;99(4):627-31. doi: 10.1113/expphysiol.2013.074336. Epub 2013 Dec 13. Exp Physiol. 2014. PMID: 24334334 Free PMC article. Review.
-
Functional characteristics of dystrophic skeletal muscle: insights from animal models.J Appl Physiol (1985). 2002 Aug;93(2):407-17. doi: 10.1152/japplphysiol.01242.2001. J Appl Physiol (1985). 2002. PMID: 12133845 Review.
Cited by
-
Whole-genome SNP allele frequency differences between Tibetan and Large white pigs reveal genes associated with skeletal muscle growth.BMC Genomics. 2024 Jun 12;25(1):588. doi: 10.1186/s12864-024-10508-7. BMC Genomics. 2024. PMID: 38862895 Free PMC article.
-
Preying dangerously: black widow spider venom resistance in sympatric lizards.R Soc Open Sci. 2022 Oct 19;9(10):221012. doi: 10.1098/rsos.221012. eCollection 2022 Oct. R Soc Open Sci. 2022. PMID: 36277837 Free PMC article.
-
Pericytes in Muscular Dystrophies.Adv Exp Med Biol. 2019;1147:319-344. doi: 10.1007/978-3-030-16908-4_15. Adv Exp Med Biol. 2019. PMID: 31147885 Free PMC article.
-
Intramuscular adipocyte and fatty acid differences between high-fat and control rabbit groups subject to a restricted diet.Vet Med Sci. 2021 Sep;7(5):2051-2060. doi: 10.1002/vms3.576. Epub 2021 Jul 17. Vet Med Sci. 2021. PMID: 34273256 Free PMC article.
-
Cross-sectional study into age-related pathology of mouse models for limb girdle muscular dystrophy types 2D and 2F.PLoS One. 2019 Aug 20;14(8):e0220665. doi: 10.1371/journal.pone.0220665. eCollection 2019. PLoS One. 2019. PMID: 31430305 Free PMC article.
References
-
- Ozawa E, Noguchi S, Mizuno Y, Hagiwara Y, Yoshida M. From dystrophinopathy to sarcoglycanopathy: evolution of a concept of muscular dystrophy. Muscle Nerve 1998;21:421–438. - PubMed
-
- Durbeej M, Cohn RD, Hrstka RF, Moore SA, Allamand V, Davidson BL, et al Disruption of the β‐sarcoglycan gene reveals pathogenetic complexity of limb‐girdle muscular dystrophy type 2E. Mol Cell 2000;5:141–151. - PubMed
-
- Wheeler MT, McNally EM. Sarcoglycans in vascular smooth and striated muscle. Trends Cardiovasc Med 2003;13:238–243. - PubMed
-
- Coral‐Vazquez R, et al Disruption of the sarcoglycan–sarcospan complex in vascular smooth muscle: a novel mechanism for cardiomyopathy and muscular dystrophy. Cell 1999;98:465–474. - PubMed
LinkOut - more resources
Full Text Sources
Other Literature Sources
Molecular Biology Databases
