. 2019 Nov:165:106817.
doi: 10.1016/j.nlm.2018.02.025. Epub 2018 Feb 21.

Assessing complex movement behaviors in rodent models of neurological disorders

Affiliations

Assessing complex movement behaviors in rodent models of neurological disorders

Kenneth E McCarson et al. Neurobiol Learn Mem. 2019 Nov.

Abstract

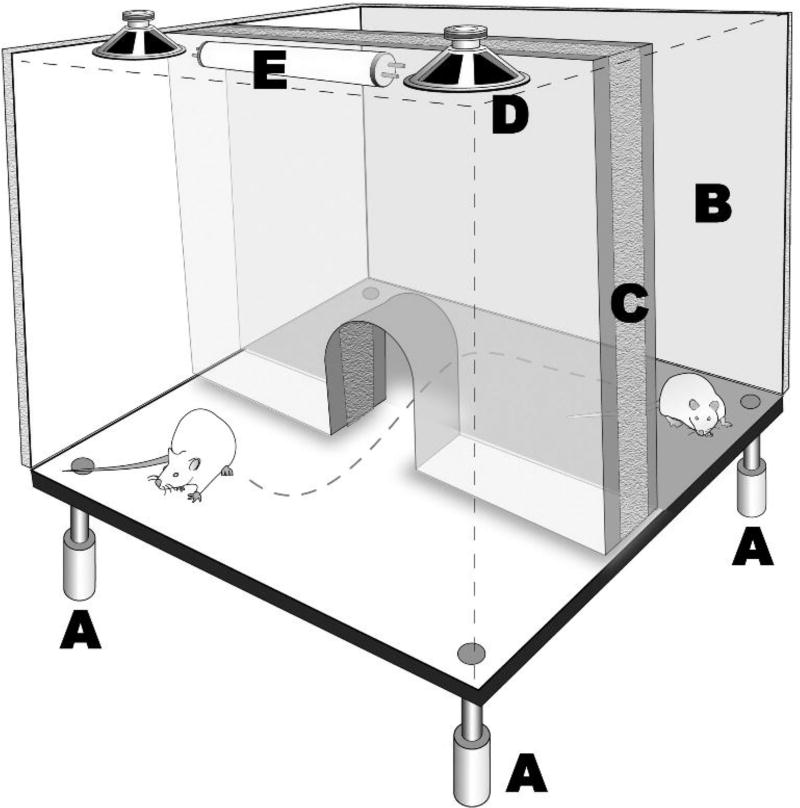
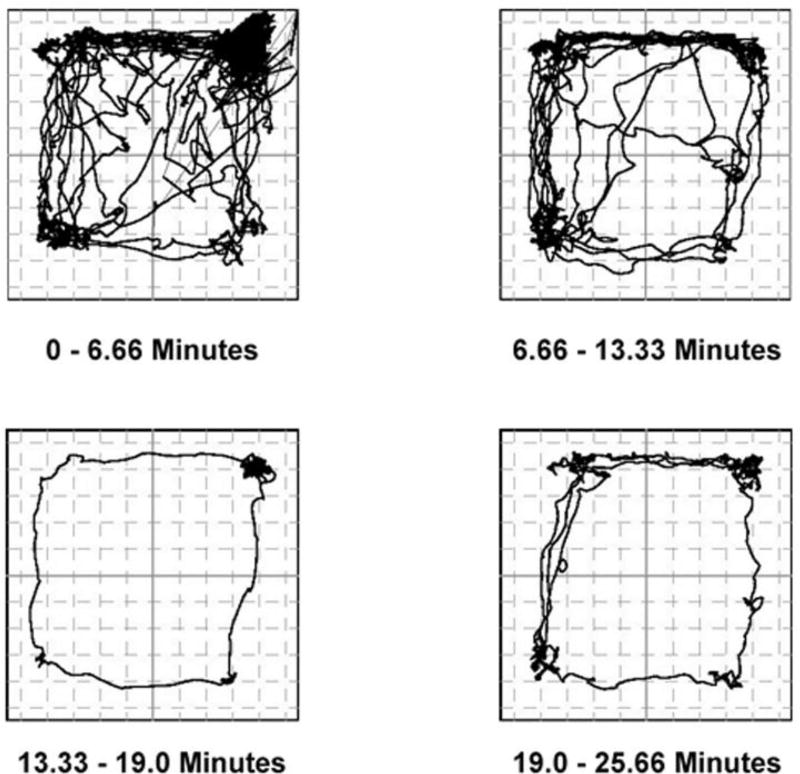
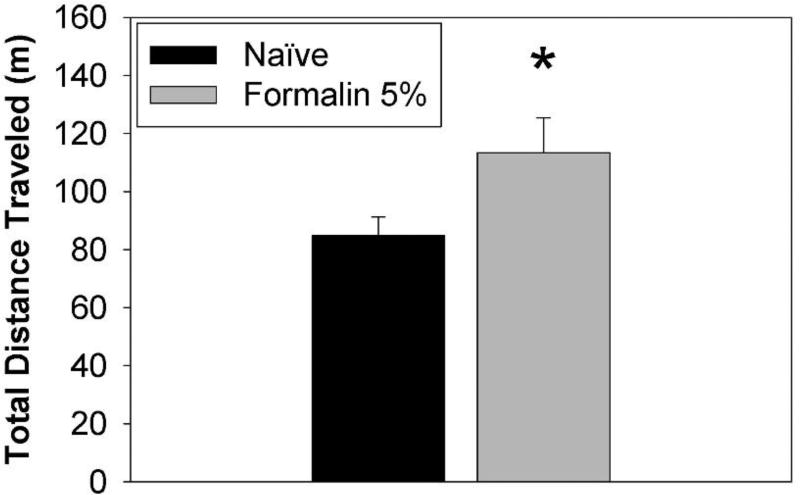
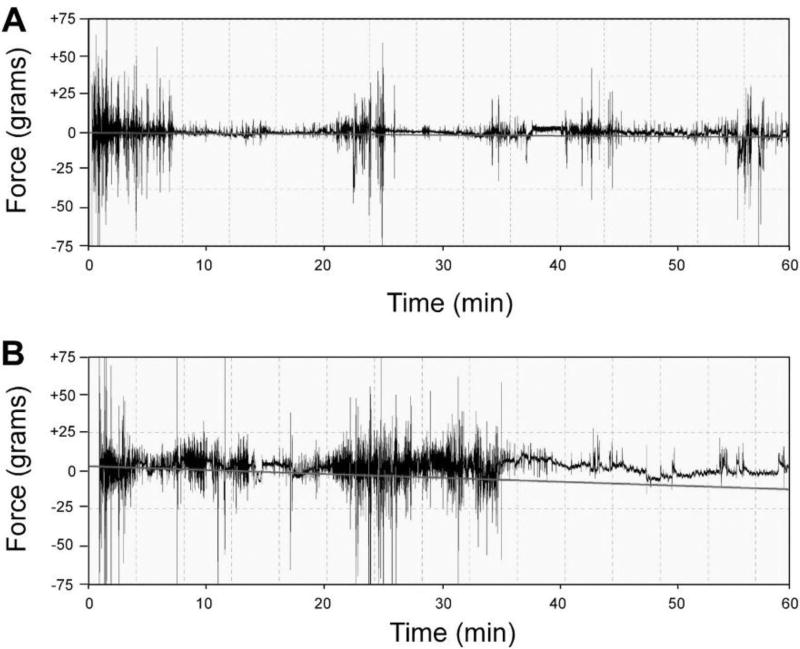
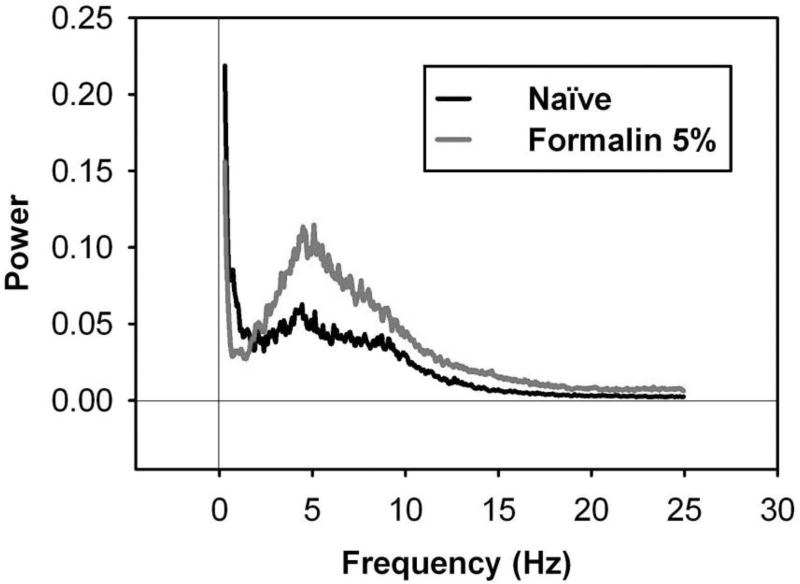
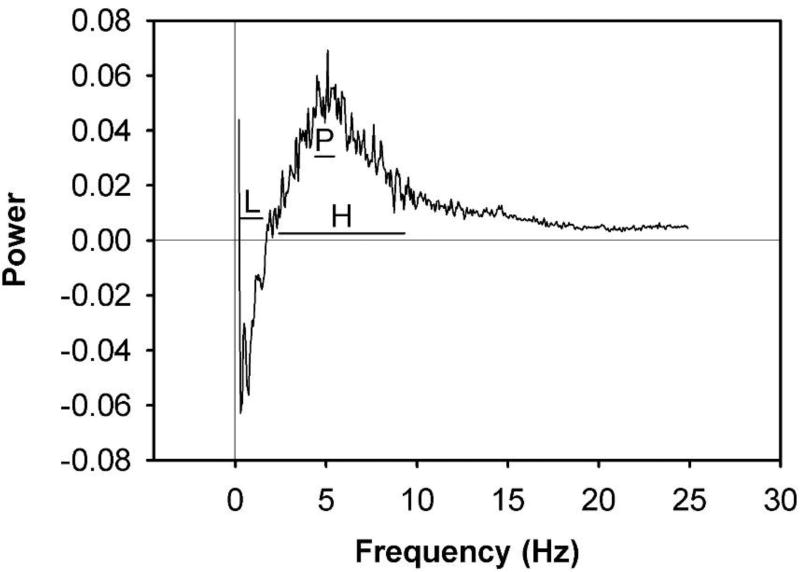
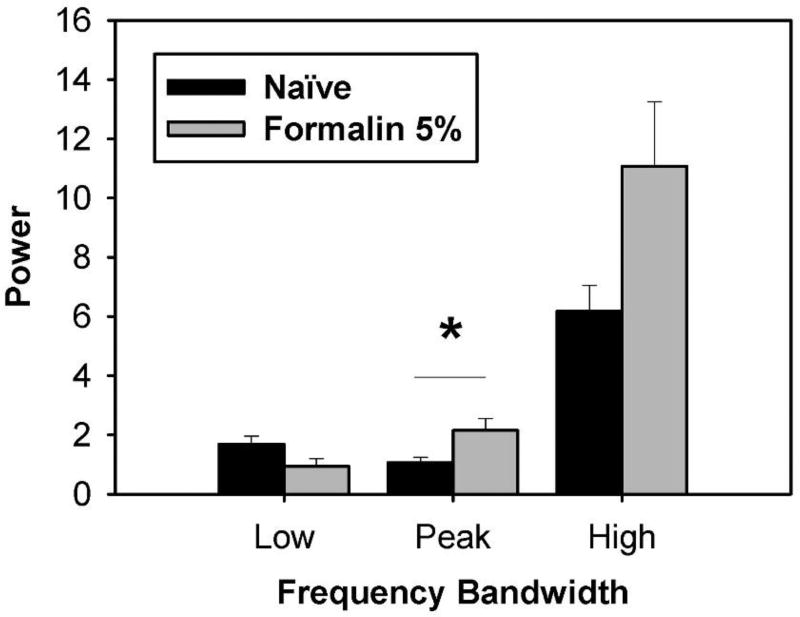
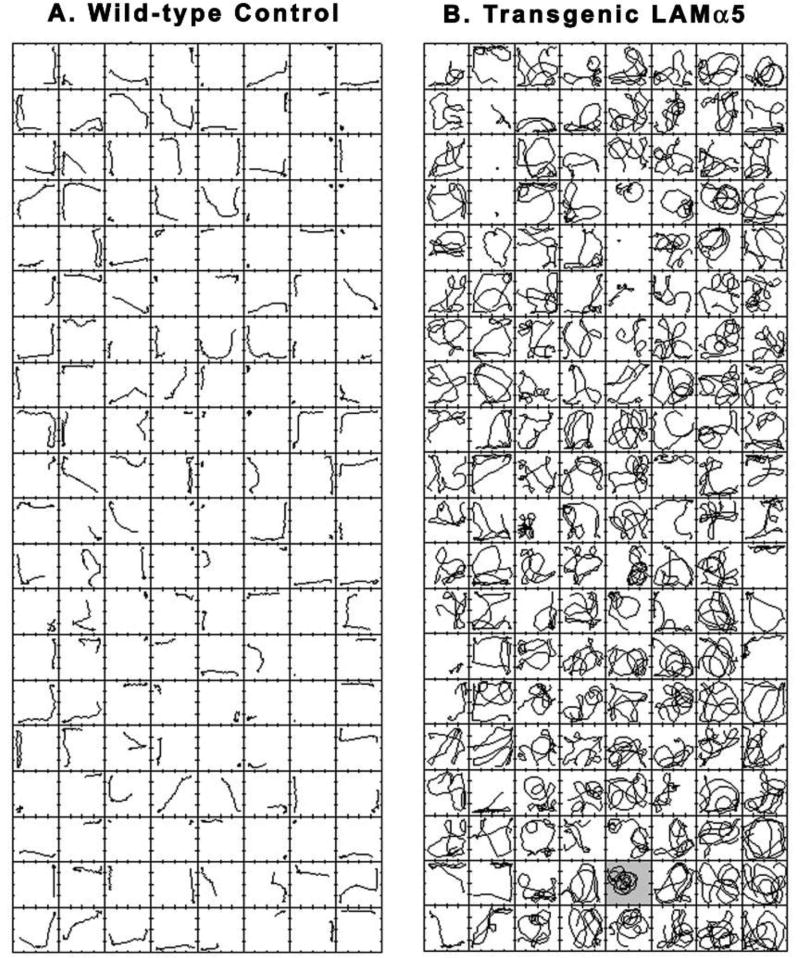
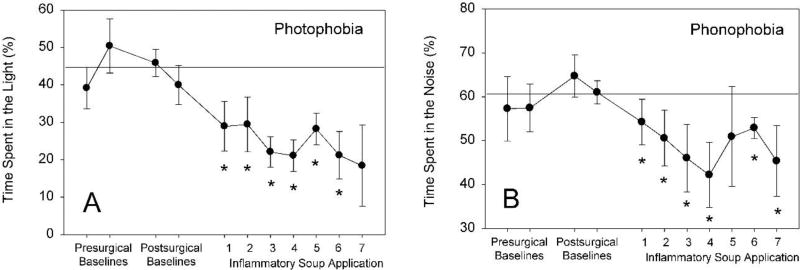
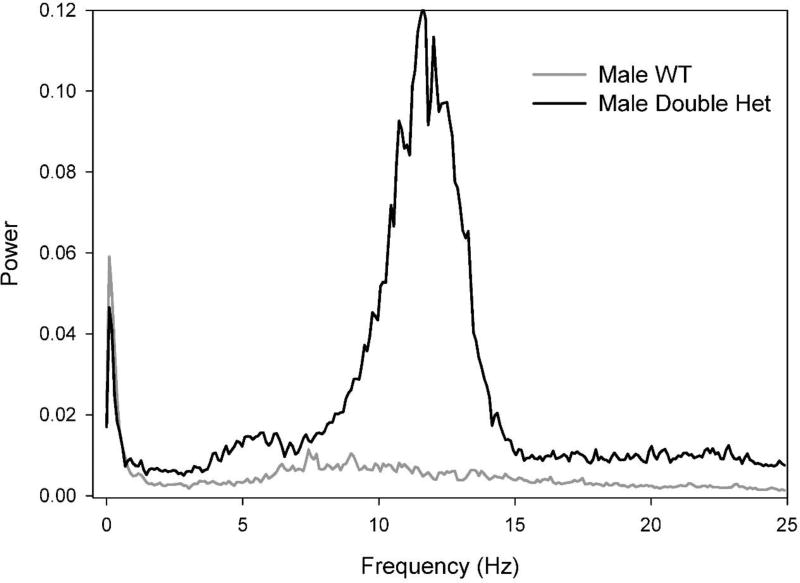
Behavioral phenotyping is a crucial step in validating animal models of human disease. Most traditional behavioral analyses rely on investigator observation of animal subjects, which can be confounded by inter-observer variability, scoring consistency, and the ability to observe extremely rapid, small, or repetitive movements. Force-Plate Actimeter (FPA)-based assessments can quantify locomotor activity and detailed motor activity with an incredibly rich data stream that can reveal details of movement unobservable by the naked eye. This report describes four specific examples of FPA analysis of behavior that have been useful in specific rat or mouse models of human neurological disease, which show how FPA analysis can be used to capture and quantify specific features of the complex behavioral phenotypes of these animal models. The first example quantifies nociceptive behavior of the rat following injection of formalin into the footpad as a common model of persistent inflammatory pain. The second uses actimetry to quantify intense, rapid circling behaviors in a transgenic mouse that overexpresses human laminin α5, a basement membrane protein. The third example assesses place preference behaviors in a rat model of migraine headache modeling phonophobia and photophobia. In the fourth example, FPA analysis revealed a unique movement signature emerged with age in a digenic mutant mouse model of Tourette Syndrome. Taken together, these approaches demonstrate the power and usefulness of the FPA in the examination and quantification of minute details of motor behaviors, greatly expanding the scope and detail of behavioral phenotyping of preclinical models of human disease.

Keywords: Force-plate Actimeter; Laminin; Locomotion; Migraine; Open field; Tremor.


Conflict of interest statement

Author Disclosure Statement

No competing financial interests exist for any of the authors of this manuscript.

Figures

Figure 1
Figure 1
The BASi Force-Plate Actimeter modified for simultaneous video capture. In this modification, three sides of the Actimeter have been modified with mirrors to facilitate an unimpeded view of the behavioral area by a CCD camera that captures video of the subject. Force transducers capture high resolution information about the center of force and its magnitude and movement (noted in Figure 2).
Figure 2
Figure 2
Behavioral testing arena for assessment of photophobia and phonophobia. Apparatus is a modified Force-Plate Actimeter (BASi) fitted with a light/dark place preference enclosure. The “dark” side features opaque walls and sound attenuation; the “light” side has lamps and speakers that provide computer-controlled delivery of stimuli. The actimeter floor allows precise measurement of locomotor activity and movement patterns of the rat to avoid intense light or sound. In the migraine model, after infusion of the dural stimulus (while the subject is in the behavioral chamber) conditions in the behavioral arena were modified in five-minute periods with 1) no external light or sound, 2) illumination of one side of the chamber to 250 lux, 3) no external light or sound, and 4) 75 dB white noise delivered to one side of the chamber. A: Force transducers. B. Sound-attenuated, dark side of divided chamber. C. Opaque insulating material used to cover all sides of B. D. Speakers for delivery of audio stimuli. E. Lamp for illumination of one side of the arena.
Figure 3
Figure 3
Representative example of recordings of position/time data of a naïve female rat‥ Data were collected using a BASi force-plate actimeter. Analyses of total distance traveled was calculated based on the change in position of the center of force recordings over time. Note that the position traces reflect the initial exploratory behavior in the force-plate arena, which generally diminishes over time, with alternating periods of locomotion and rest.
Figure 4
Figure 4
Analysis of total distance traveled from FPA force/time recordings of female rats following hind paw injection of 5% formalin. Rats were either naïve or injected with 100 µL 5% formalin into the right hind paw, and were placed in the FPA for one hour. Results revealed 5% formalin-treated (n = 6) rats had higher total distance traveled compared to Naïve (n = 6) rats. Data represent the mean ± SEM (*Student’s t-test [t(10)=3.42, p = 0.038]). Subjects in the Naïve and Formalin groups were the same rats, which were monitored in the FPA first without formalin (Naïve) then after formalin injection (Formalin). Rats had not been previously acclimated to the FPA environment.
Figure 5
Figure 5
Representative FPA force/time recordings for rats without or with formalin injection. These are representative force/time recordings from rats that received either A) sham restraint or B) injection of 100 µL of 5% formalin into the left hind paw and then placed in the FPA for one hour. Movement of the formalin-injected subjects in panel B reflect the typical biphasic behavioral response of rats in the formalin test, with periods of brisk nociceptive behaviors in the 0 – 10 min and 20 – 40 min time windows.
Figure 6
Figure 6
Fourier-transformed power spectra of FPA force/time recordings of female rats following hind paw injection of 5% formalin. Fourier analysis assesses force/time data such as those displayed in Figure 5 and coverts them into a representation of the rhythmicity (Hz) of the movements captured by the FPA. Rats were either naïve or injected with 100 µL 5% formalin into the left hind paw, then were placed in the FPA for one hour. Results revealed `different power spectra for Naïve (n = 6) and formalin-treated (n = 6) rats. Data represent mean power spectra across the entire 60 min testing period.
Figure 7
Figure 7
Fourier-transformed difference power spectrum of FPA force/time recordings of female rats following hind paw injection of 5% formalin. Rats were either naïve or injected with 100 µL 5% formalin into the left hind paw, then were placed in the FPA for one hour. The mean power spectrum for Naïve (n = 6) rats was subtracted from that of formalin-treated (n = 6) rats. Results revealed a differential power spectrum with potentially significant magnitudes. Data represent the mean power spectrum. For more detailed analysis of this difference in movement power, frequency bands of the power spectra were designated and are superimposed on the difference power spectrum of 5% formalin. Horizontal lines represent frequency band (range) designations of the power spectrum. The frequency band designations are: Low (L): 0.3–1.5 Hz; Peak (P): 4.4–5.4 Hz; High (H): 2.4–9.3 Hz.
Figure 8
Figure 8
Analysis of movement power across frequency bands in rats following 5% formalin. Power spectra were summed over the frequency bands designated in Figure 7. Results revealed a difference in power for Sham (n = 6) vs. formalin-treated (n = 6) rats at the Peak (4.4–5.4 Hz) frequency band, but not at the Low (0.3–1.5 Hz) or High frequency (2.4–9.3 Hz) band. These data suggest 5% formalin induced an increase in movements that are represented by power in the Peak frequency band. Data represent the mean ± SEM (*p ≤ 0.05, unpaired Student’s t-test).
Figure 9
Figure 9
Comparison of a WT mouse (A) and a homozygous transgenic laminin α5 mouse (B). The mice were 12 weeks old at the time of this assay. The hyperactivity of the transgenic mouse was expressed as almost continuous high-speed locomotion characterized by both broader and tighter circular loops that could occur anywhere on the actimeter floor. The wild type mouse was normoactive, and its movement trajectories reflected runs and pauses with more movements along walls than across the center of the chamber and relatively few rapid reversals of direction. Each square represents the floor of a 42 × 42 cm actimeter and contains the center of force movement trajectory for 7.5 seconds. Time advances from top to bottom and from left to right (i.e., the top of column 2 picks up where the bottom of column 1 left off). Total recording session time was 20 minutes. Figure 10 is an enlarged image of frame 99 for the homozygous transgenic mouse (B, shaded frame).
Figure 10
Figure 10
This 7.5-second-long movement trajectory shows continuous locomotion by a homozygous transgenic laminin α5 mouse from frame 99 in Figure 9. The recording is divided into 5 color-coded segments, each lasting 1.5 seconds (see right side of graphic). The whole sequence of movements from t = 0 to t = 7.5 seconds can be described as “high speed nearly circular loops of oscillating diameters comprising a continuous spiral with variable centers.” It should be noted that all turns were to the left. The CNS mechanism responsible for this pattern of behavior remains to be elucidated, but may reflect behavior occurring at a rate of expression that is too high to be under feedback control of sensory stimuli.
Figure 11
Figure 11
Dural stimulation results in place-preference photo- and phonophobia. Baseline behaviors were assessed one and two days prior to surgery and 7 and 8 days post-surgery; the horizontal line represents the grand mean of pre- and post-surgical baseline behaviors with no dural stimulation. Dural stimulation with inflammatory soup occurred eight times over a sixteen-day period (every two or three days). Rats were introduced to the divided arena 15 minutes after inflammatory soup application, and were able to freely move in the arena for a total of 170 minutes. The first 5 min of exposure in the arena was in the absence of stimuli, the second 5 min period was in the presence of either light (250 lux), and then 5 min of noise (75 dB) present on only one side of the divided chamber, with a 2 min dark rest period between stimuli. Percentage of time in each side of the arena during the presentation of stimuli was calculated using fully automated BASi FPA Analysis software. Note subsequent applications of inflammatory soup to the dura decrease the amount of time spent in the light (A) or noisy (B) side of the chamber (* p<0.05 compared to baseline, ANOVA, Dunnett’s post-hoc; n=3–8).
Figure 12
Figure 12
Male double-het mutant mice have a repetitive movement signature. These preliminary data show frequency analysis of fine motor activity in two representative male mice at 40 weeks of age. The Ror1/Ngf double mutant mouse generated a consistent peak of additional movement power in the 8.5–14 Hz frequency range. Associated groups of mice showed similar results. This enticing finding generates numerous questions about the specific nature of the movements and their contribution to the clinical relevance of this model, but demonstrates the usefulness of FPA analysis in screening movement patterns.

Similar articles

Cited by

References

    1. The International Classification of Headache Disorders: 2nd edition. Cephalalgia. 2004;(24 Suppl 1):9–160. - PubMed
    1. Abbott FV, Ocvirk R, Najafee R, Franklin KB. Improving the efficiency of the formalin test. Pain. 1999;83(3):561–569. - PubMed
    1. Allen AL, McCarson KE. Estrogen increases nociception-evoked brain-derived neurotrophic factor gene expression in the female rat. Neuroendocrinology. 2005;81(3):193–199. - PubMed
    1. Burstein R, Jakubowski M. Analgesic triptan action in an animal model of intracranial pain: a race against the development of central sensitization. Ann Neurol. 2004;55(1):27–36. - PubMed
    1. Burstein R, Yamamura H, Malick A, Strassman AM. Chemical stimulation of the intracranial dura induces enhanced responses to facial stimulation in brain stem trigeminal neurons. J Neurophysiol. 1998;79(2):964–982. - PubMed

Publication types