. 2018 Jun:173:540-550.
doi: 10.1016/j.neuroimage.2018.01.053. Epub 2018 Feb 21.

Disambiguating brain functional connectivity

Affiliations

Disambiguating brain functional connectivity

Eugene P Duff et al. Neuroimage. 2018 Jun.

Abstract

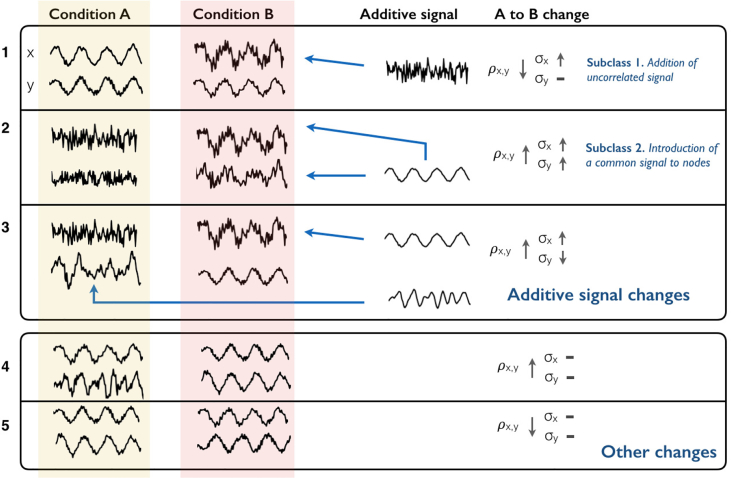
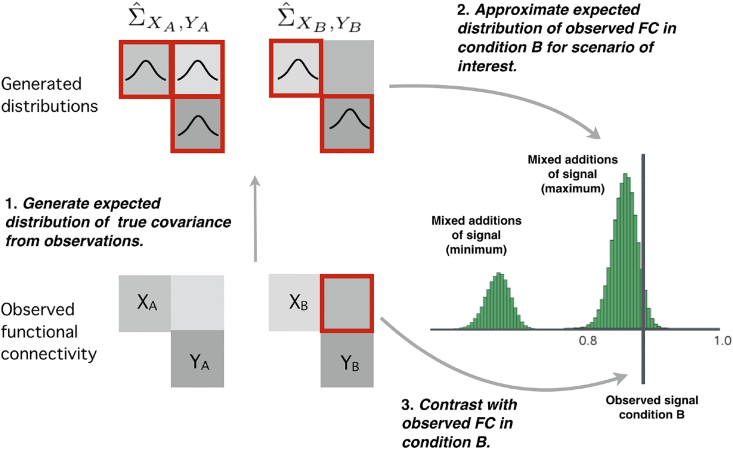
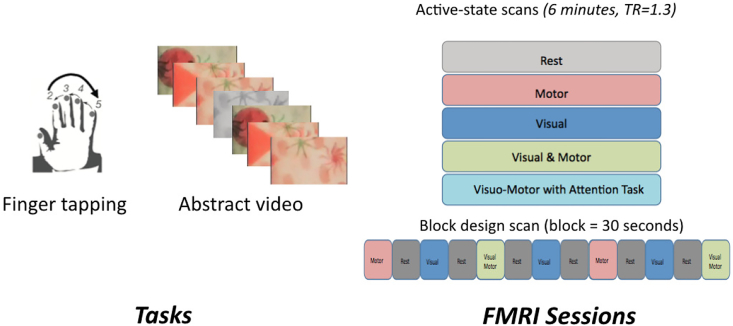
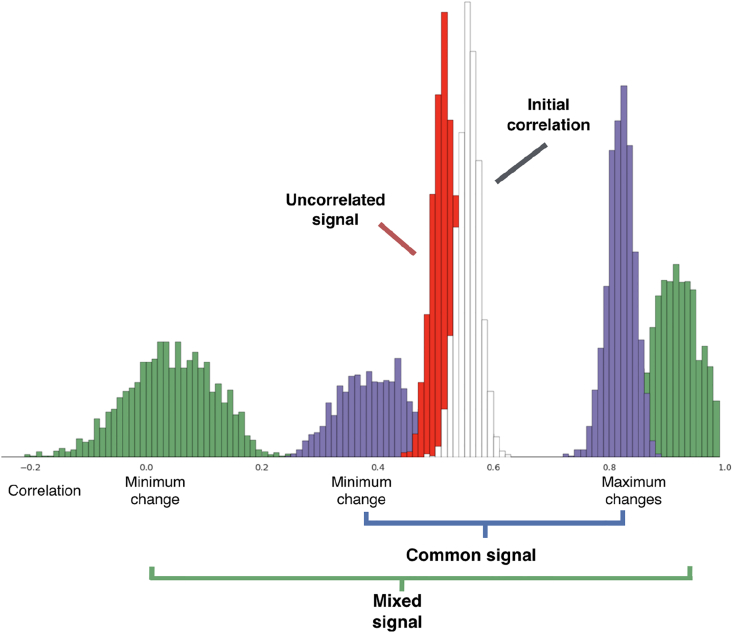
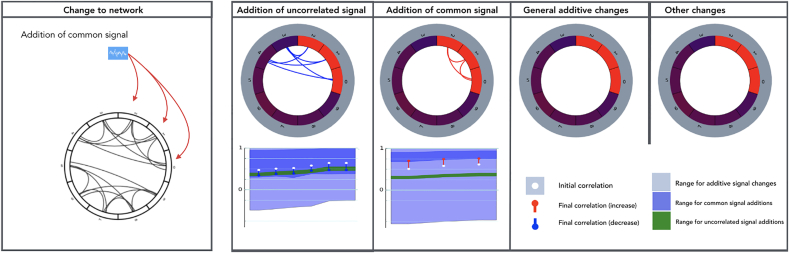
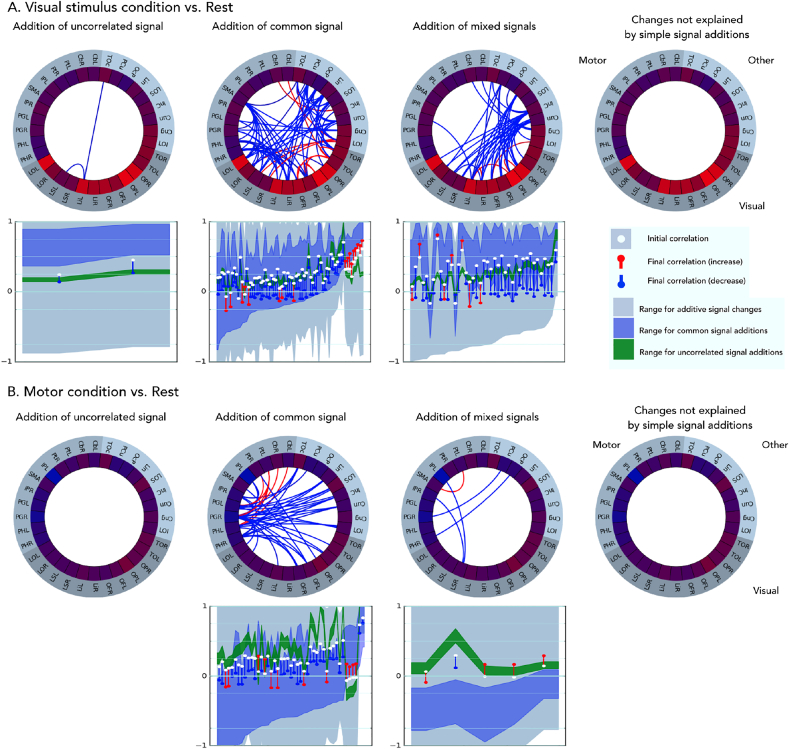
Functional connectivity (FC) analyses of correlations of neural activity are used extensively in neuroimaging and electrophysiology to gain insights into neural interactions. However, analyses assessing changes in correlation fail to distinguish effects produced by sources as different as changes in neural signal amplitudes or noise levels. This ambiguity substantially diminishes the value of FC for inferring system properties and clinical states. Network modelling approaches may avoid ambiguities, but require specific assumptions. We present an enhancement to FC analysis with improved specificity of inferences, minimal assumptions and no reduction in flexibility. The Additive Signal Change (ASC) approach characterizes FC changes into certain prevalent classes of signal change that involve the input of additional signal to existing activity. With FMRI data, the approach reveals a rich diversity of signal changes underlying measured changes in FC, suggesting that it could clarify our current understanding of FC changes in many contexts. The ASC method can also be used to disambiguate other measures of dependency, such as regression and coherence, providing a flexible tool for the analysis of neural data.

Keywords: Correlation; Effective connectivity; FMRI; Functional connectivity; SNR.


Figures

Fig. 1
Fig. 1
Representation of effects of additive signal changes (ASC) on correlation. The upper box demonstrates three examples of additive signal changes to correlation. The blue arrows represent the addition of signal into a node in a certain state. The first example corresponds to the subclass of additions in uncorrelated signal. Here, signal uncorrelated with region Y is added to X in state B, reducing correlation and increasing variance. In the second, a common signal is added to both regions in state B, increasing correlation and variance. In the third example, region X receives an addition of signal already present in region Y. At the same time, some signal not shared by region X (e.g. some input from a third region) is removed from region Y in state B. The overall effect is an increase in correlation. The second box shows some scenarios that do not fall within the class of additive changes. The first example shows a synchronisation of signals whose temporal properties, including variance, otherwise do not substantially change. The final example shows two signals where their correlation flips from positive to negative. This could be explained by the addition of a great deal of negatively correlated signal, but falls outside our definition of additive signal.
Fig. 2
Fig. 2
The Monte Carlo procedure used for inference on changes in functional connectivity. 1. From the observed covariances a distribution of potential underlying true covariances is generated, using a Wishart distribution and rejection sampling. 2. From these samples, the expected distribution of observed correlation for different additive signal change scenarios can be calculated (green histogram). These distributions can be compared to the observed correlation in state B, which can be used to test the hypothesis that the observed data is explained by a given scenario. Note that the common and general additive signal classes cover a range of different putative additive signals, which can have a range of effects on correlation. We identify those signals from these classes that will produce the minimum and maximum correlation, and use these signals to generate distributions for minimum and maximum possible observed correlations for these classes. 3. The observed FC is compared to these distributions to test null hypotheses that additive signal changes can explain observations.
Fig. 3
Fig. 3
Validation experiment. A. Steady state tasks involved one or both of continuous fingertapping and viewing of a rapidly changing random images. The fingertapping had a consistent order, which was periodically reversed. B. Five 6-min steady state conditions were used. In the Visual & Motor condition subjects simply performed the motor task while viewing the video. In the attention task condition subjects were cued to change direction when specific visual cues were observed in the video.
Fig. 4
Fig. 4
The effects on correlation of additive signals producing a 20% variance change. The plot reflects a scenario where both regions increase in variance by 20%, with an initial correlation of 0.58. The white histogram reflects the distribution of observed correlations in state A. The red histogram represents the expected distribution of correlation in state B, if the observed 20% change in variance was associated with uncorrelated signals. The blue histograms reflect the distributions of maximum and minimum changes in correlation if variance changes were due to a common additive signal component. Finally, the green histograms reflect the distributions of maximum and minimum changes in correlation when variance changes are due to any additive additions of signal.
Fig. 5
Fig. 5
Example analysis of simulated changes in brain networks. Grey connections in the first column indicate nodes with a positive correlation (between 0.3 and 0.7) in the initial state, and red arrows point into nodes to indicate that additional signal was injected in the second state, producing an increase in variance of 20%. Here, a common stochastic process was added to nodes 1–3, uncorrelated with existing signal. The remaining columns represent connections that were detected as showing significant changes in correlation across states, FDR corrected (α = 0.2). Upper row Each circle plot represents connections determined to fall within a particular class of ASC change. Red connections indicate connections showing increases in correlation after the injection of signal, blue decreases. Node colors similarly represent change in variance. Note that, for clarity, connections falling within subclasses are not included in the more general ASC classes. The final (here, empty) column shows connections that cannot be explained by additive changes. Lower row The lower plots represent the distribution of absolute correlation changes for the shown connections. Note that it is not intended to be possible to identify specific connections. White dot - correlation in initial state. Blue/red dot - correlation in second state. Colour fill - range of correlation in second state that could be explained by the additive signal change class. The decreases in correlation between nodes are identified as potentially indicative of increases in uncorrelated signal, but could also be explained by common or other additive changes. The increased correlations between the three nodes receiving the introduced signal are identified as potentially indicative of increases in a common signal (but not a change in uncorrelated signal).
Fig. 6
Fig. 6
ASC analysis of FC changes between rest and visual stimulation (A), and rest and a motor condition (finger tapping) (B). Plot organisation is described in Fig. 5, region label key is in Table 1 (Supplementary Material). Red connections indicate connections showing increased in correlation in the non-rest conditions, blue decreases. The majority of significant changes in correlation can be explained by additive changes in signal. The visual condition produced increases in variance in visual regions relative to rest, and was associated with increases in correlation between visual nodes that could be explained by increases in common signal or other additive signal changes. Decorrelation with other regions could also be explained by additive changes. The motor condition produced modest reductions in variance in motor regions, which were nevertheless enough for additive changes (common signal) to explain the changes in correlation, including decreases between cortical motor regions, and increases in correlation of cortical motor regions with cerebellum.

References

    1. Baker A.P., Brookes M.J., Rezek I.A., Smith S.M., Behrens T., Probert Smith P.J., Woolrich M. Fast transient networks in spontaneous human brain activity. eLife. mar 2014;3:e01867. http://www.pubmedcentral.nih.gov/articlerender.fcgi?artid=PMC3965210 https://elifesciences.org/articles/01867 http://www.ncbi.nlm.nih.gov/pubmed/24668169. - PMC - PubMed
    1. Beckmann C.F., Smith S.M. Probabilistic independent component analysis for functional magnetic resonance imaging. IEEE Trans. Med. Imag. feb 2004;23(2):137–152. https://doi.org/10.1109/TMI.2003.822821 - DOI - PubMed
    1. Birn R.M., Molloy E.K., Patriat R., Parker T., Meier T.B., Kirk G.R., Nair V.A., Meyerand M.E., Prabhakaran V. The effect of scan length on the reliability of resting-state fMRI connectivity estimates. Neuroimage. dec 2013;83:550–558. http://www.ncbi.nlm.nih.gov/pubmed/23747458 http://www.pubmedcentral.nih.gov/articlerender.fcgi?artid=PMC4104183 http://linkinghub.elsevier.com/retrieve/pii/S1053811913006010 - PMC - PubMed
    1. Biswal B., Yetkin F.Z., Haughton V.M., Hyde J.S. Functional connectivity in the motor cortex of resting human brain using echo-planar MRI. Magn. Reson. Med. oct 1995;34(4):537–541. http://view.ncbi.nlm.nih.gov/pubmed/8524021 - PubMed
    1. Buchel C. Modulation of connectivity in visual pathways by attention: cortical interactions evaluated with structural equation modelling and fMRI. Cerebr. Cortex. dec 1997;7(8):768–778. http://cercor.oxfordjournals.org/content/7/8/768.short - PubMed

Publication types

LinkOut - more resources