. 2018 Apr:289:92-99.
doi: 10.1016/j.jmr.2018.02.011. Epub 2018 Feb 13.

3D hyperpolarized C-13 EPI with calibrationless parallel imaging

Affiliations

3D hyperpolarized C-13 EPI with calibrationless parallel imaging

Jeremy W Gordon et al. J Magn Reson. 2018 Apr.

Abstract

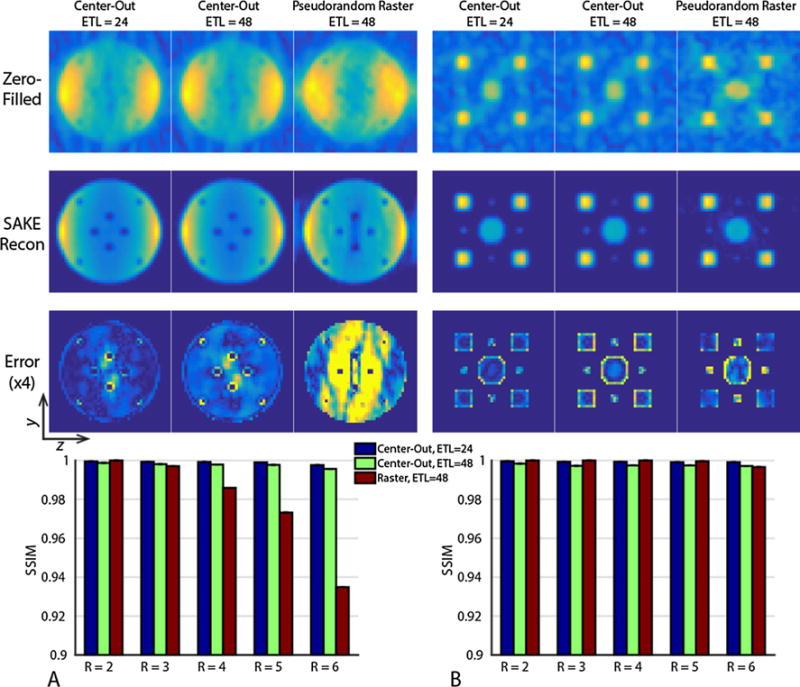
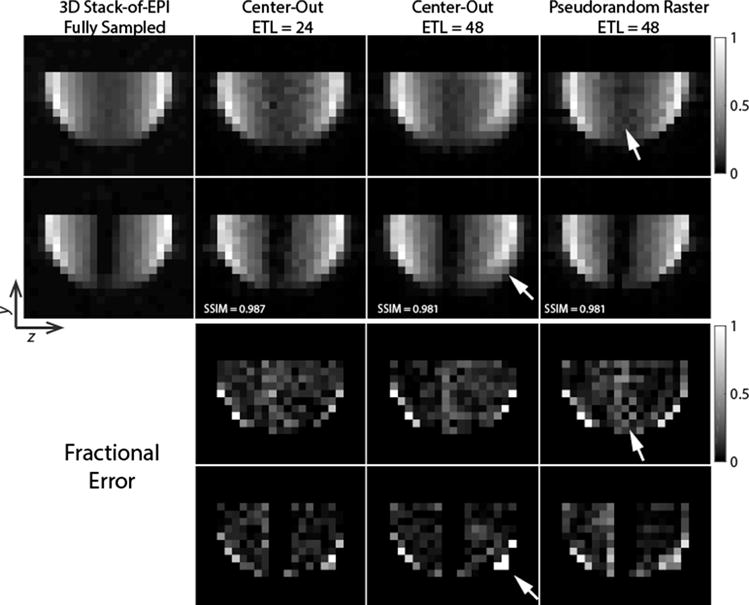
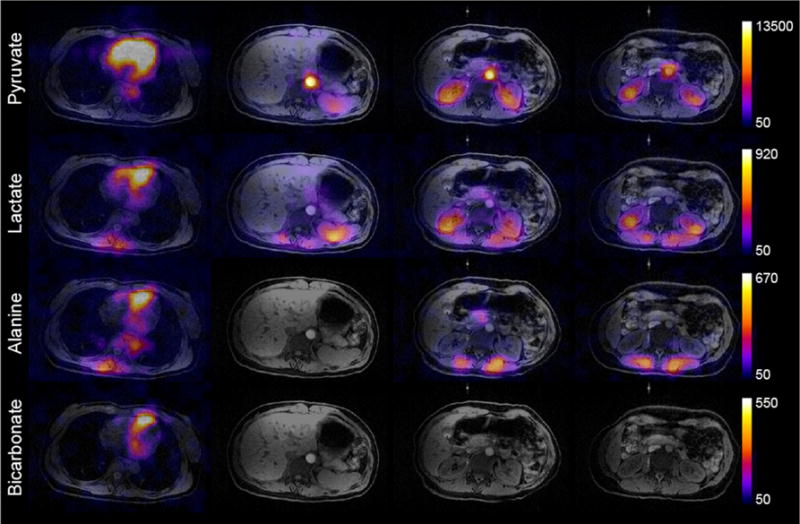
With the translation of metabolic MRI with hyperpolarized 13C agents into the clinic, imaging approaches will require large volumetric FOVs to support clinical applications. Parallel imaging techniques will be crucial to increasing volumetric scan coverage while minimizing RF requirements and temporal resolution. Calibrationless parallel imaging approaches are well-suited for this application because they eliminate the need to acquire coil profile maps or auto-calibration data. In this work, we explored the utility of a calibrationless parallel imaging method (SAKE) and corresponding sampling strategies to accelerate and undersample hyperpolarized 13C data using 3D blipped EPI acquisitions and multichannel receive coils, and demonstrated its application in a human study of [1-13C]pyruvate metabolism.

Keywords: C13; EPI; Hyperpolarization; Parallel imaging; Pyruvate; SAKE.


Figures

Fig. 1
Fig. 1
The 3D EPI pulse sequence used in this work. A singleband spectral-spatial RF pulse was used to selectively excite individual metabolites. Phase-encode gradients on the Y and Z-axis enable 3D imaging with an arbitrary blip pattern that is changed every TR.
Fig. 2
Fig. 2
Representative sampling patterns (undersampling factor R = 4) used with the 3D EPI pulse sequence in this work. The center-out sampling patterns started at the center of k-space and encoded a wedge in ky-kz within each TR using a variable density Poisson disc distribution. The two center-out sampling patterns were identical aside from the echo train length. The pseudorandom raster sampling pattern started at ky,max and acquired a rectangular portion in ky-kz within each TR. The white lines denote the region in ky-kz encoded within a single TR.
Fig. 3
Fig. 3
Numerical phantoms (A, B) and sensitivity profiles (C) of the eight channel receive array used in simulations, with the location of the elements of the receive array outlined in white. Undersampling was performed in-plane, with the through-plane direction being the fully encoded readout.
Fig. 4
Fig. 4
Point spread function (PSF) for the three sampling patterns explored in this work. A representative 2D PSF simulated with T2* = 30 ms and no off-resonance for each of the three sampling patterns (A) shows stark differences in symmetry. 1D line profiles in the y-dimension of the PSF as a function of T2* (B) shows that the two ETL = 48 sampling patterns are similarly sensitive to short T2* with respect to signal intensity. In contrast, the PSF as a function of off-resonance (C) highlights the robustness of the pseudorandom raster to bulk off-resonance, resulting in only a simple shift instead of blurring (broader PSF) for the center-out approach.
Fig. 5
Fig. 5
Numerical simulation results for a uniform object with multiple signal voids (A) and a sparse phantom with circles of varying radii (B) assuming T2* = 30 ms and acquired with R = 6 sampling patterns. While both the center-out and pseudorandom raster sampling patterns are able to reconstruct the sparse phantom (B), the raster approach breaks down when the object size approaches the FOV for higher undersampling factors (A). The two center-out sampling patterns have similar reconstruction fidelity as measured by SSIM. However, the center-out ETL = 48 sampling pattern has increased error at the object boundary, in agreement with the broader PSF. All images have been displayed with identical window and level.
Fig. 6
Fig. 6
Thermal 13C ethylene glycol phantom data acquired using the three sampling patterns described in this work. Data were acquired with a sagittal orientation but have been reformatted axially to highlight the artifacts arising from the different sampling schemes. Two slices from the volume are shown, with the second containing a water filled syringe used to provide negative space at the center of the object. While SAKE can reconstruct the data from all three approaches, the center-out ETL = 24 acquisition provides a beneficial tradeoff between deleterious blurring (highlighted in the center-out ETL = 48) and reduced signal loss at the center of the object (highlighted in the pseudorandom raster).
Fig. 7
Fig. 7
Area under the curve (sum through time) images demonstrate pyruvate uptake and metabolism in the heart and throughout the abdomen. Four representative slices (from the heart to the kidneys) within the active volume of the 13C abdominal array are shown. 13C data have been zero-filled fourfold for display. Colorbar scale is in arbitrary units.

References

    1. Ardenkjær-Larsen JH, Fridlund B, Gram A, Hansson G, Hansson L, Lerche MH, Servin R, Thaning M, Golman K. Increase in signal-to-noise ratio of > 10,000 times in liquid-state NMR. Proc Natl Acad Sci USA. 2003;100:10158–10163. - PMC - PubMed
    1. Albers MJ, Bok R, Chen AP, Cunningham CH, Zierhut ML, Zhang VY, Kohler SJ, Tropp J, Hurd RE, Yen YF, Nelson SJ, Vigneron DB, Kurhanewicz J. Hyperpolarized 13C lactate pyruvate, and alanine: noninvasive biomarkers for prostate cancer detection and grading. Cancer Res. 2008;68:8607–8615. - PMC - PubMed
    1. Nelson SJ, Kurhanewicz J, Vigneron DB, Larson PEZ, Harzstark AL, Ferrone M, van Criekinge M, Chang JW, Bok R, Park I, Reed G, Carvajal L, Small EJ, Munster P, Weinberg VK, Ardenkjaer-Larsen JH, Chen AP, Hurd RE, Odegardstuen LI, Robb FJ, Tropp J, Murray JA. Metabolic imaging of patients with prostate cancer using hyperpolarized [1-13C]pyruvate. Sci Translat Med. 2013;5:198ra108. - PMC - PubMed
    1. Cunningham CH, Lau JY, Chen AP, Geraghty BJ, Perks WJ, Roifman I, Wright GA, Connelly KA. Hyperpolarized 13C metabolic MRI of the human heart: initial experience. Circ Res. 2016 - PMC - PubMed
    1. Cunningham CH, Chen AP, Lustig M, Hargreaves BA, Lupo J, Xu D, Kurhanewicz J, Hurd RE, Pauly JM, Nelson SJ, Vigneron DB. Pulse sequence for dynamic volumetric imaging of hyperpolarized metabolic products. J Magn Reson. 2008;193:139–146. - PMC - PubMed

Publication types