

Prolonged high force high repetition pulling induces osteocyte apoptosis and trabecular bone loss in distal radius, while low force high repetition pulling induces bone anabolism
- PMID: 29476978
- PMCID: PMC5878749
- DOI: 10.1016/j.bone.2018.02.014
Prolonged high force high repetition pulling induces osteocyte apoptosis and trabecular bone loss in distal radius, while low force high repetition pulling induces bone anabolism
Abstract
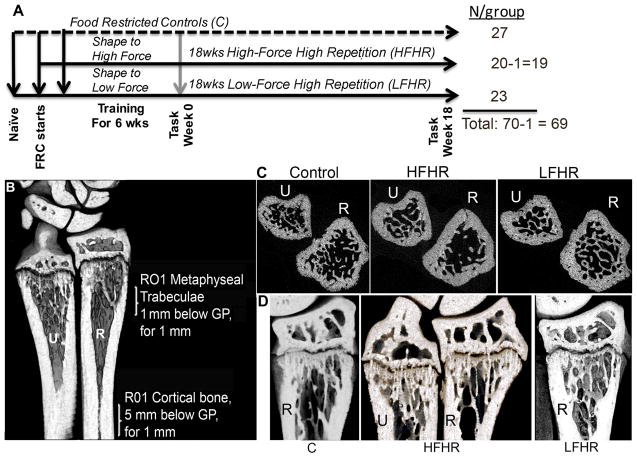
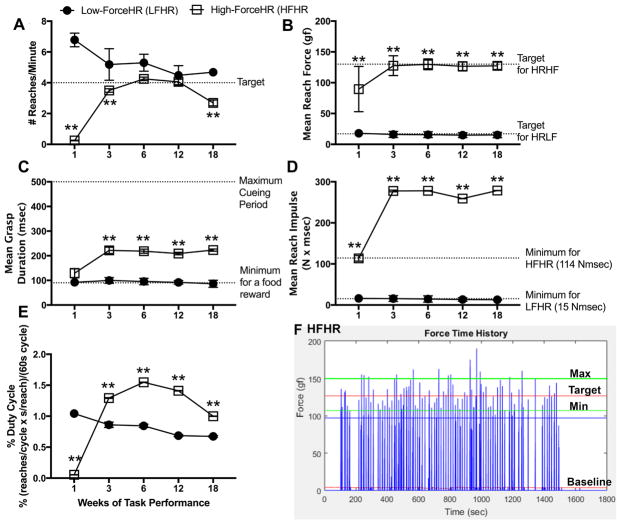
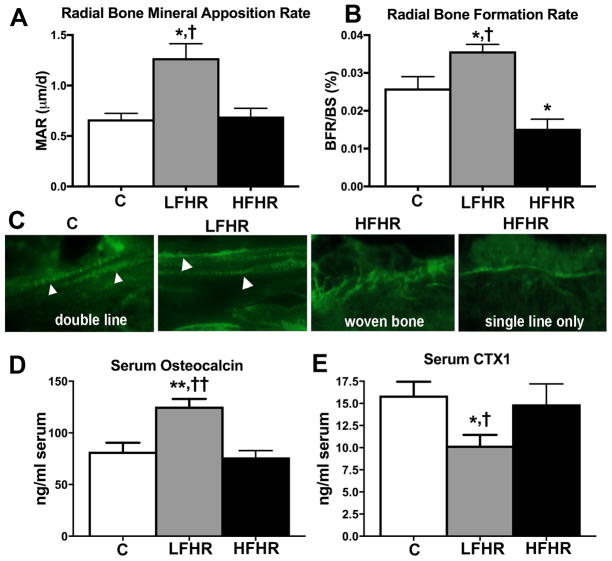
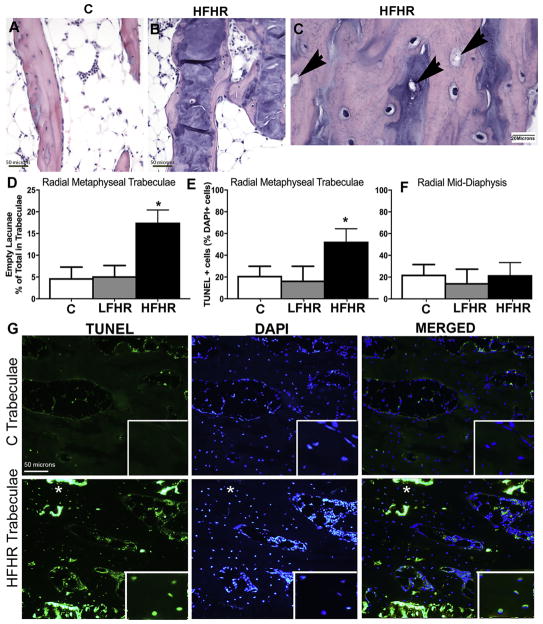
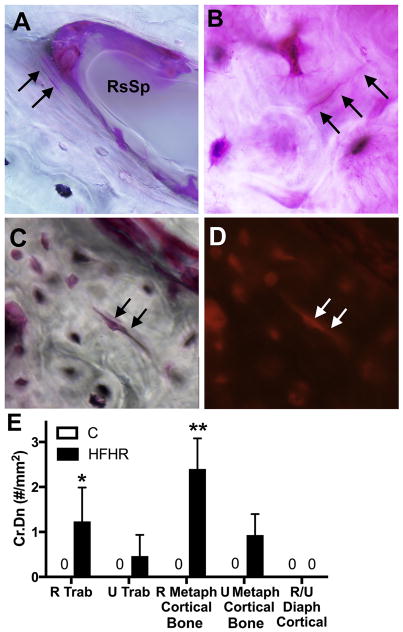
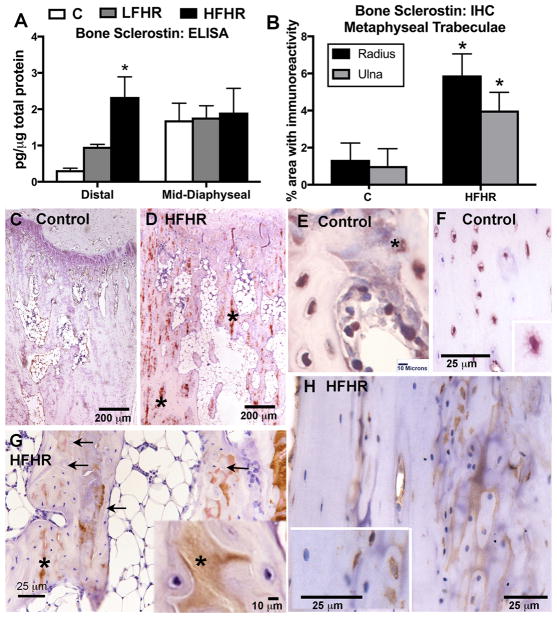
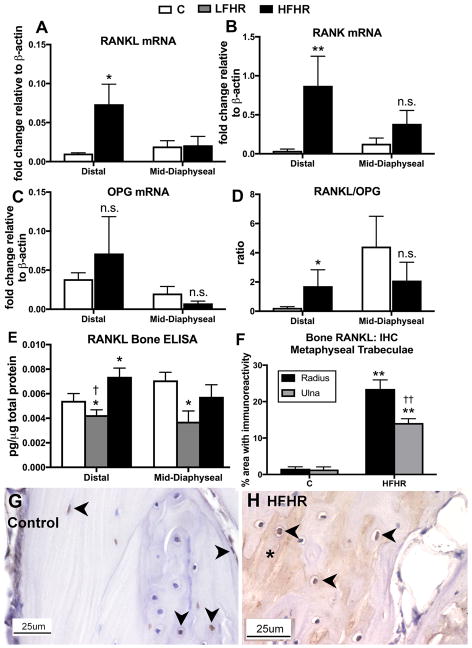
We have an operant rat model of upper extremity reaching and grasping in which we examined the impact of performing a high force high repetition (High-ForceHR) versus a low force low repetition (Low-ForceHR) task for 18weeks on the radius and ulna, compared to age-matched controls. High-ForceHR rats performed at 4 reaches/min and 50% of their maximum voluntary pulling force for 2h/day, 3days/week. Low-ForceHR rats performed at 6% maximum voluntary pulling force. High-ForceHR rats showed decreased trabecular bone volume in the distal metaphyseal radius, decreased anabolic indices in this same bone region (e.g., decreased osteoblasts and bone formation rate), and increased catabolic indices (e.g., microcracks, increased osteocyte apoptosis, secreted sclerostin, RANKL, and osteoclast numbers), compared to controls. Distal metaphyseal trabeculae in the ulna of High-ForceHR rats showed a non-significant decrease in bone volume, some catabolic indices (e.g., decreased trabecular numbers) yet also some anabolic indices (e.g., increased osteoblasts and trabecular thickness). In contrast, the mid-diaphyseal region of High-ForceHR rats' radial and ulnar bones showed few to no microarchitecture differences and no changes in apoptosis, sclerostin or RANKL levels, compared to controls. In further contrast, Low-ForceHR rats showed increased trabecular bone volume in the radius in the distal metaphysis and increased cortical bone area its mid-diaphysis. These changes were accompanied by increased anabolic indices, no microcracks or osteocyte apoptosis, and decreased RANKL in each region, compared to controls. Ulnar bones of Low-ForceHR rats also showed increased anabolic indices, although fewer than in the adjacent radius. Thus, prolonged performance of an upper extremity reaching and grasping task is loading-, region-, and bone-dependent, with high force loads at high repetition rates inducing region-specific increases in bone degradative changes that were most prominent in distal radial trabeculae, while low force task loads at high repetition rates induced adaptive bone responses.
Keywords: Mechanical loading; Osteoactivin; Osteoprotegerin; Overuse injury; RANK; RANKL; Sclerostin.
Copyright © 2018 Elsevier Inc. All rights reserved.
Conflict of interest statement
None of the authors have any competing interests to declare.
Figures
Similar articles
-
Prolonged performance of a high repetition low force task induces bone adaptation in young adult rats, but loss in mature rats.Exp Gerontol. 2015 Dec;72:204-17. doi: 10.1016/j.exger.2015.10.014. Epub 2015 Oct 27. Exp Gerontol. 2015. PMID: 26517953 Free PMC article.
-
Osteocyte Apoptosis Caused by Hindlimb Unloading is Required to Trigger Osteocyte RANKL Production and Subsequent Resorption of Cortical and Trabecular Bone in Mice Femurs.J Bone Miner Res. 2016 Jul;31(7):1356-65. doi: 10.1002/jbmr.2807. Epub 2016 Mar 22. J Bone Miner Res. 2016. PMID: 26852281 Free PMC article.
-
Inflammatory Bowel Disease in a Rodent Model Alters Osteocyte Protein Levels Controlling Bone Turnover.J Bone Miner Res. 2017 Apr;32(4):802-813. doi: 10.1002/jbmr.3027. Epub 2017 Feb 28. J Bone Miner Res. 2017. PMID: 27796050
-
Osteocyte control of bone remodeling: is sclerostin a key molecular coordinator of the balanced bone resorption-formation cycles?Osteoporos Int. 2014 Dec;25(12):2685-700. doi: 10.1007/s00198-014-2808-0. Epub 2014 Jul 17. Osteoporos Int. 2014. PMID: 25030653 Review.
-
The Role of Osteocytes in Age-Related Bone Loss.Curr Osteoporos Rep. 2016 Feb;14(1):16-25. doi: 10.1007/s11914-016-0297-0. Curr Osteoporos Rep. 2016. PMID: 26909563 Review.
Cited by
-
Blocking CTGF/CCN2 reduces established skeletal muscle fibrosis in a rat model of overuse injury.FASEB J. 2020 May;34(5):6554-6569. doi: 10.1096/fj.202000240RR. Epub 2020 Mar 29. FASEB J. 2020. PMID: 32227398 Free PMC article.
-
Manual Therapy Facilitates Homeostatic Adaptation to Bone Microstructural Declines Induced by a Rat Model of Repetitive Forceful Task.Int J Mol Sci. 2022 Jun 13;23(12):6586. doi: 10.3390/ijms23126586. Int J Mol Sci. 2022. PMID: 35743030 Free PMC article.
-
Osteocyte-specific dentin matrix protein 1 : the role of mineralization regulation in low-magnitude high-frequency vibration enhanced osteoporotic fracture healing.Bone Joint Res. 2022 Jul;11(7):465-476. doi: 10.1302/2046-3758.117.BJR-2021-0476.R2. Bone Joint Res. 2022. PMID: 35787000 Free PMC article.
-
Social Determinants of Mental, Physical, and Oral Health of Middle-Aged and Older African Americans in South Los Angeles.Int J Environ Res Public Health. 2022 Dec 14;19(24):16765. doi: 10.3390/ijerph192416765. Int J Environ Res Public Health. 2022. PMID: 36554645 Free PMC article.
-
Occupational Activities: Factors That Tip the Balance From Bone Accrual to Bone Loss.Exerc Sport Sci Rev. 2020 Apr;48(2):59-66. doi: 10.1249/JES.0000000000000217. Exerc Sport Sci Rev. 2020. PMID: 32004169 Free PMC article. Review.
References
-
- Abdelmagid SM, Barbe MF, Arango-Hisijara I, Owen TA, Popoff SN, Safadi FF. Osteoactivin acts as downstream mediator of BMP-2 effects on osteoblast function. J Cell Physiol. 2007;210(1):26–37. - PubMed
-
- Al-Dujaili SA, Lau E, Al-Dujaili H, Tsang K, Guenther A, You L. Apoptotic osteocytes regulate osteoclast precursor recruitment and differentiation in vitro. J Cell Biochem. 2011;112(9):2412–2423. - PubMed
Publication types
MeSH terms
Substances
Grants and funding
LinkOut - more resources
Full Text Sources
Other Literature Sources
