. 2018;10(3):215-227.
doi: 10.1159/000487056. Epub 2018 Feb 23.

Neuroinflammation in Response to Intracerebral Injections of Different HMGB1 Redox Isoforms

Affiliations

Neuroinflammation in Response to Intracerebral Injections of Different HMGB1 Redox Isoforms

Hannah Aucott et al. J Innate Immun. 2018.

Abstract

Background: Neuroinflammation triggered by infection or trauma is the cause of central nervous system dysfunction. High-mobility group box 1 protein (HMGB1), released from stressed and dying brain cells, is a potent neuroinflammatory mediator. The proinflammatory functions of HMGB1 are tightly regulated by post-translational redox modifications, and we here investigated detailed neuroinflammatory responses induced by the individual redox isoforms.

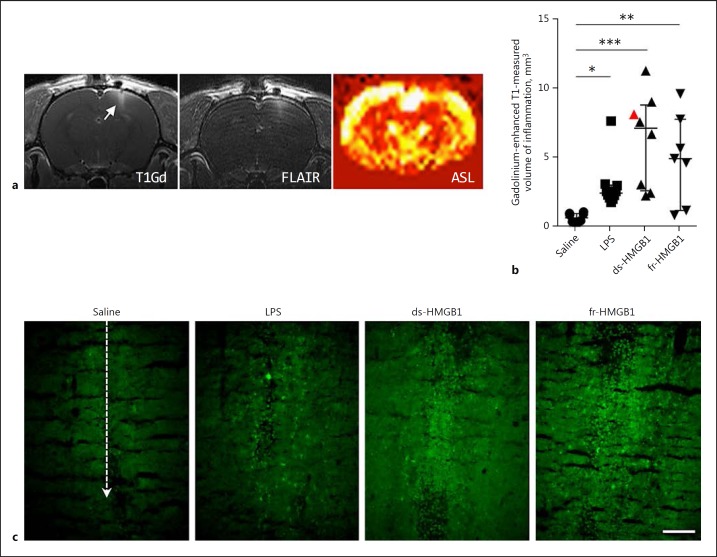
Methods: Male Dark Agouti rats received a stereotactic injection of saline, lipopolysaccharide, disulfide HMGB1, or fully reduced HMGB1, and were accessed for blood-brain barrier modifications using magnetic resonance imaging (MRI) and inflammatory responses by immunohistochemistry.

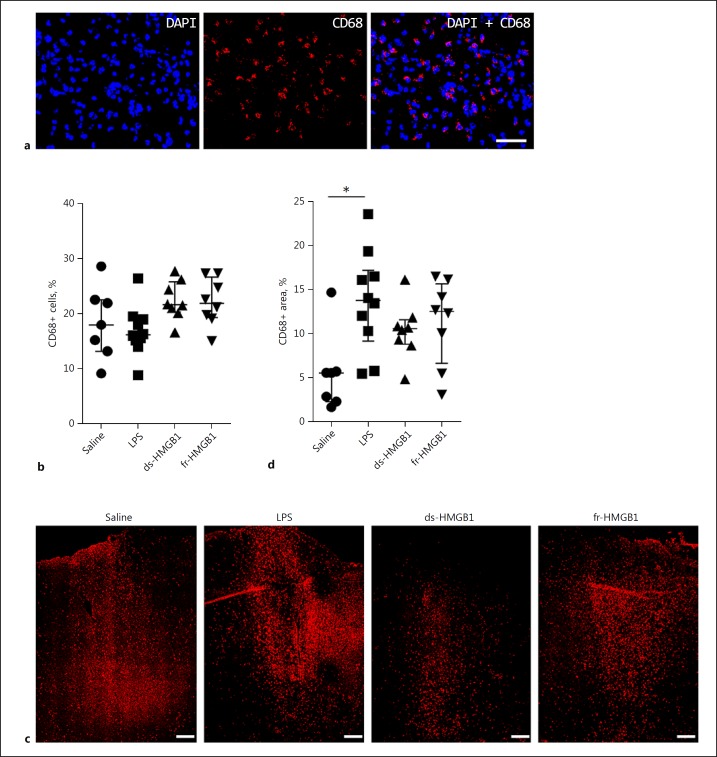
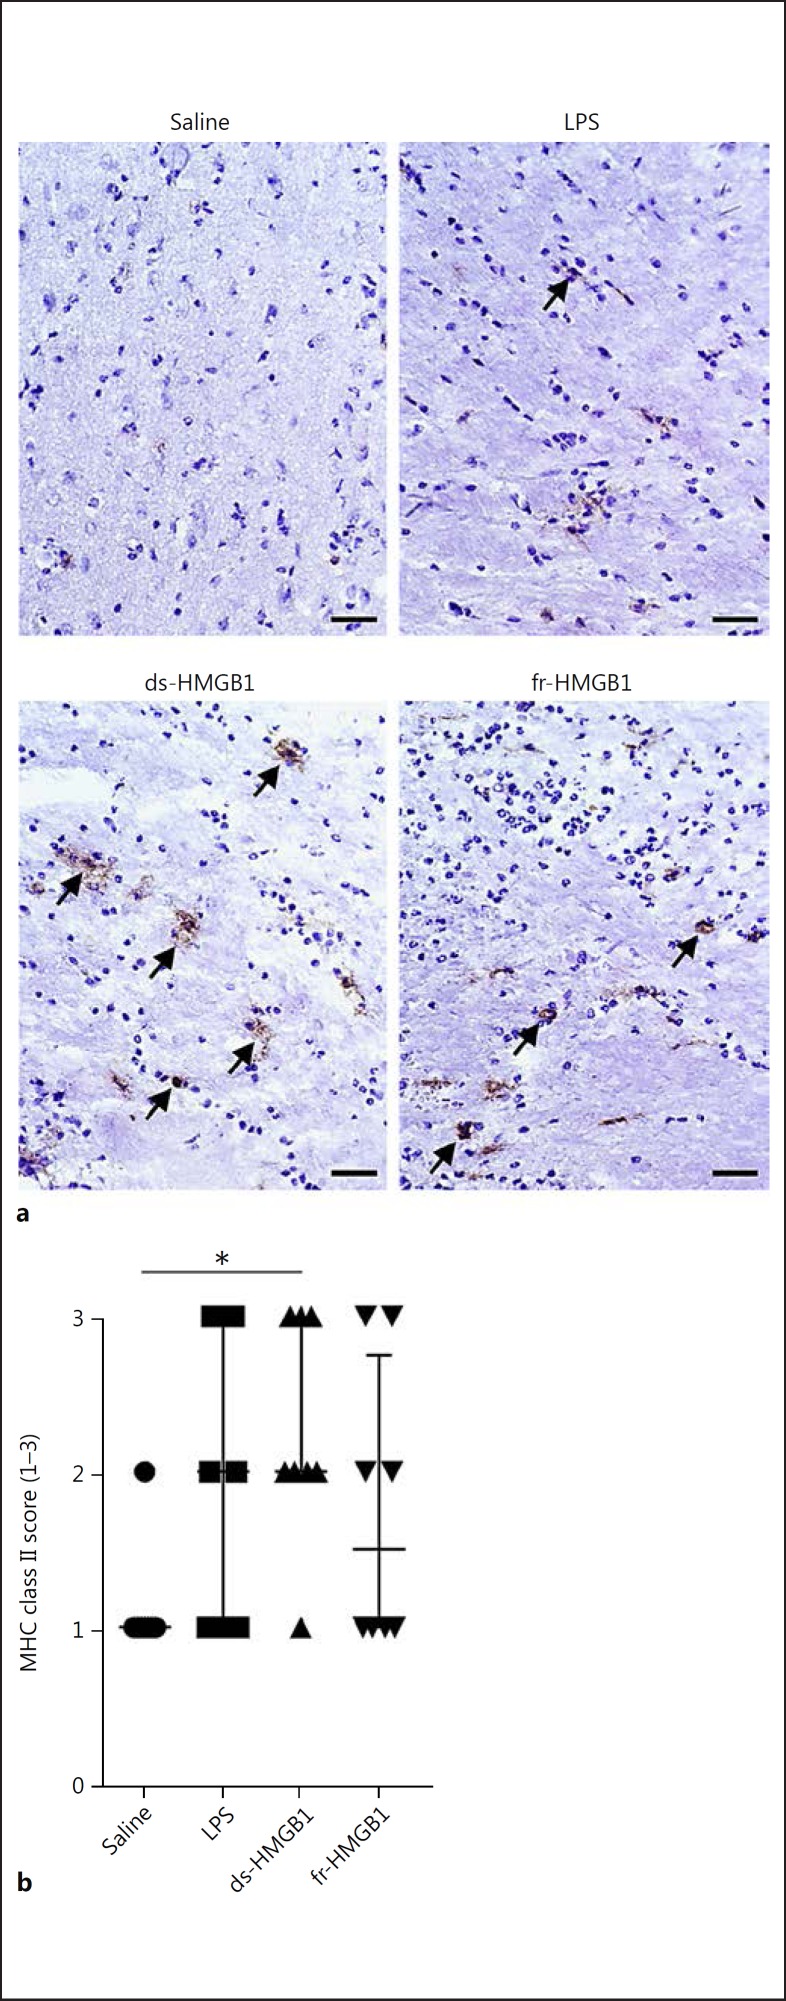
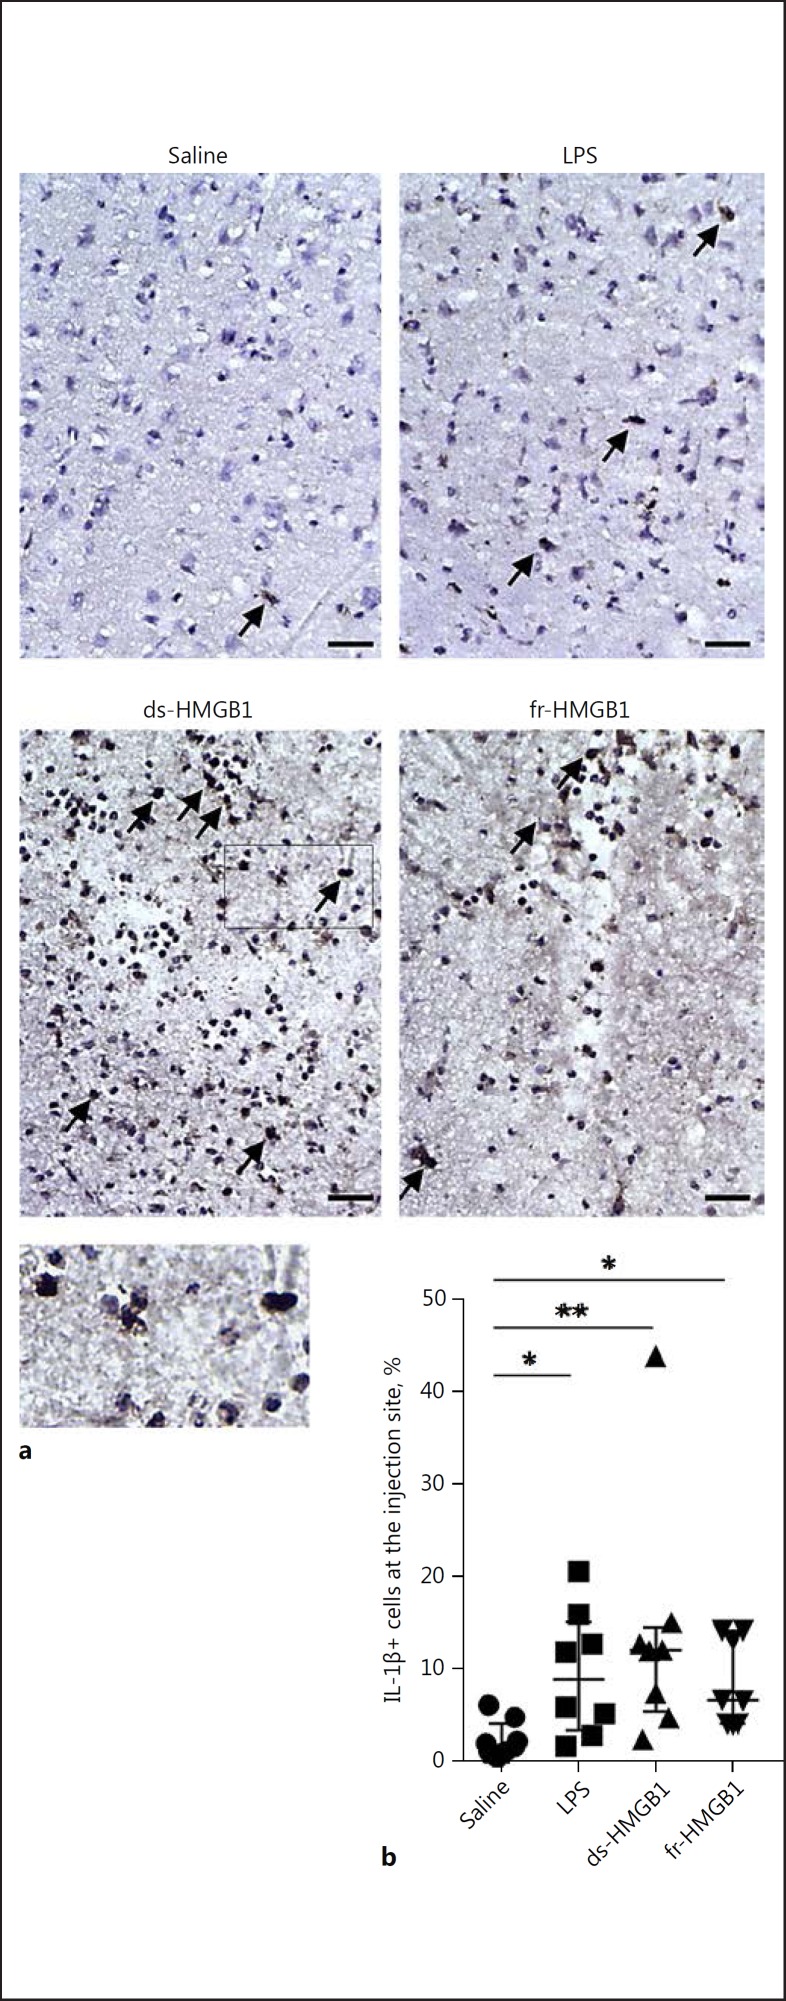
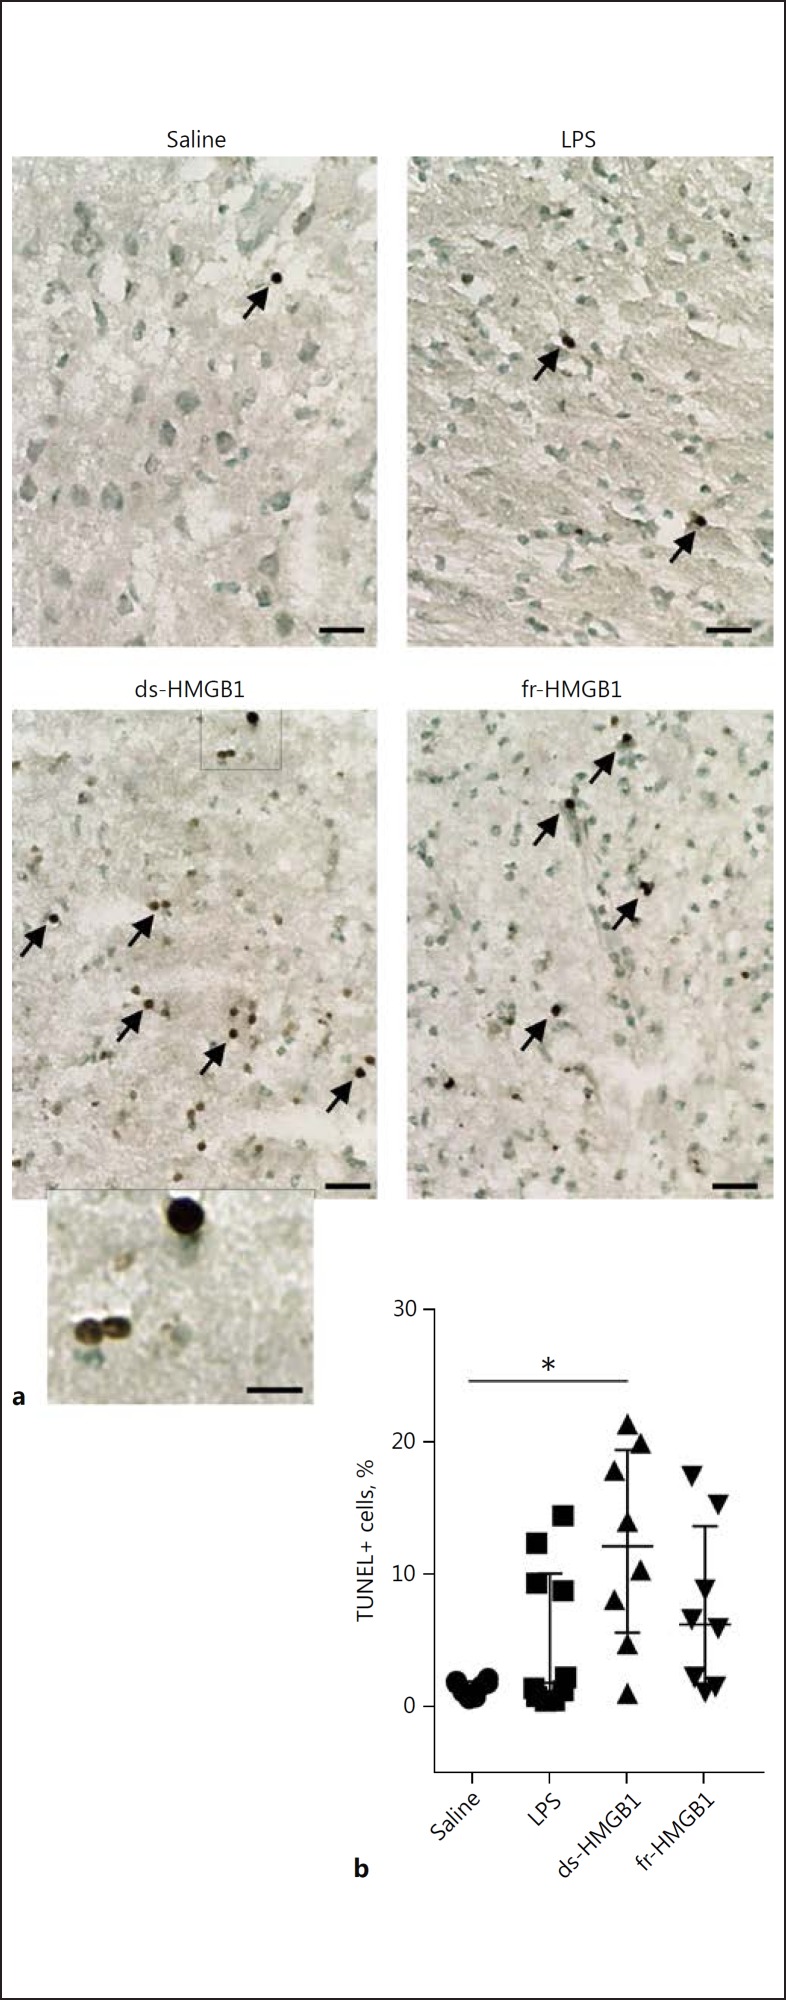
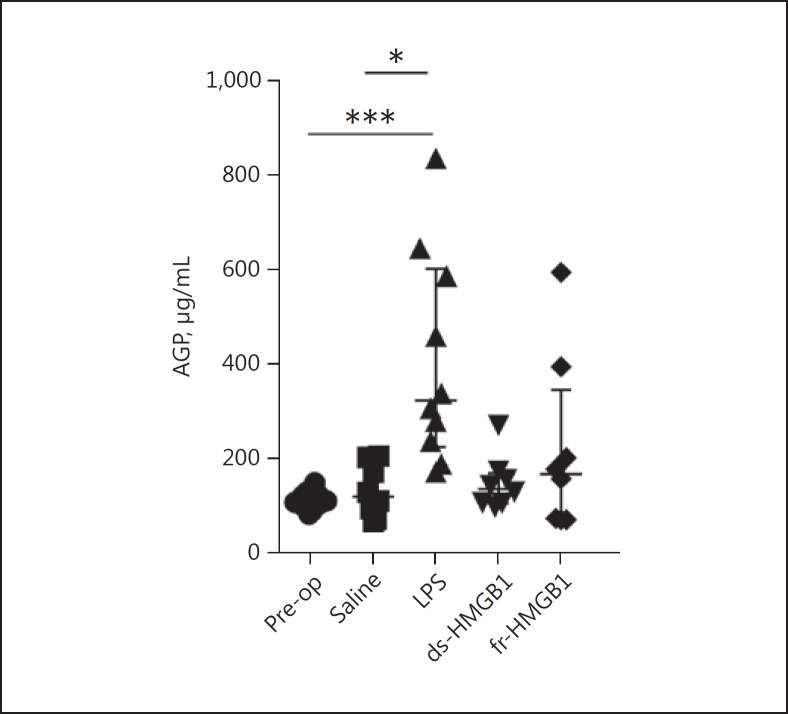
Results and conclusions: Significant blood-brain barrier disruption appeared 24 h after injection of lipopolysaccharide, disulfide HMGB1, or fully reduced HMGB1 compared to controls, as assessed in post-gadolinium T1-weighted MRI images and confirmed by increased uptake of FITC-conjugated dextran. Immunohistochemistry revealed that both HMGB1 isoforms also induced a local production of IL-1β. Additionally, disulfide HMGB1 increased major histocompatibility complex class II expression and apoptosis. Together, the results demonstrate that extracellular, cerebral HMGB1 causes significant blood-brain barrier disruption in a redox-independent manner and activates several components of neuroinflammation. Blocking HMGB1 might potentially improve clinical outcome in conditions such as stroke and traumatic brain injury.

Keywords: Blood-brain barrier; Brain; HMGB1; Neuroinflammation; Redox.


Figures

Fig. 1
Fig. 1
Intracerebral injection of HMGB1 induces blood-brain barrier leakage and neuroinflammation. HMGB1, high-mobility group box 1; LPS, lipopolysaccharide; ds, disulfide; fr, fully reduced. a Representative T1-weighted, FLAIR, and ASL images (non-tagged-tagged/non-tagged) collected after ds-HMGB1 injection (animal identified by a red triangle in b). T1-weighted and FLAIR images were collected after gadolinium. b Quantification of the volume of inflammation in gadolinium-enhanced T1-weighted images. LPS, ds-HMGB1, and fr-HMGB1 significantly increased gadolinium uptake compared to the saline controls (saline vs. LPS, p = 0.0413; saline vs. ds-HMGB1, p = 0.0002; saline vs. fr-HMGB1, p = 0.0076). Data are expressed as median ± IQR. p values were calculated using a Kruskal-Wallis test corrected for multiple comparisons using the Dunn test (n = 7–10 rats/group). * p ≤ 0.05, ** p ≤ 0.01, *** p ≤ 0.001. c Representative images showing extravasation of 70 kDa FITC-conjugated dextran. Dashed line indicates the location of the injection site (n = 3–4 rats/group). Scale bar, 100 µm.
Fig. 2
Fig. 2
CD68 protein levels are increased in response to cerebral LPS but not HMGB1. Representative sections showing the level of CD68 protein present at the injection site and in the ipsilateral hemisphere. See legend to Fig. 1 for abbreviations. a High-magnification images showing CD68+ staining at the injection site. Scale bar, 25 µm. b Quantification of CD68+ cells at the injection site. No significant differences were detected between the groups. c Low magnification image illustrating the distribution of CD68+ cells in the cerebral cortex of the ipsilateral hemisphere. Scale bar, 200 µm. d Total area positive for CD68 cells in the ipsilateral hemisphere. Rats injected with LPS had increased CD68 protein levels compared to the saline controls (p = 0.0116). The difference in the HMGB1-treated animals was not significant. Data are expressed as median ± IQR. p values were calculated using a Kruskal-Wallis test corrected for multiple comparisons using the Dunn test (n = 8–10 rats/group). * p ≤ 0.05, ** p ≤ 0.01, *** p ≤ 0.001.
Fig. 3
Fig. 3
ds-HMGB1 upregulates major histocompatibility complex (MHC) class II expression in the CNS. a Representative MHC class II staining in coronal brain sections. b Scoring of MHC class II levels in the ipsilateral hemisphere. Scale bar, 50 µm. Data are expressed as median ± IQR. p values were calculated using a Kruskal-Wallis test corrected for multiple comparisons using the Dunn test (n = 8–10 rats/group). * p ≤ 0.05, ** p ≤ 0.01, *** p ≤ 0.001. See legend to Fig. 1 for abbreviations.
Fig. 4
Fig. 4
Intracerebral extracellular HMGB1 and LPS induce proinflammatory cytokine production. a Representative sections stained using an anti-IL-1β antibody. Arrows indicate examples of positive cells. Scale bar, 50 µm. b Quantification of IL-1β-expressing cells along the injection site. Positive cells were IL-1β+/haematoxylin+. Cytokine levels were significantly increased in rats treated with LPS, ds-HMGB1, or fr-HMGB1 compared to the saline controls (p = 0.0271, 0.0055, and 0.0293, respectively). Data are expressed as median ± IQR. p values were calculated using a Kruskal-Wallis test corrected for multiple comparisons using the Dunn test (n = 8–10 rats/group). * p ≤ 0.05, ** p ≤ 0.01, *** p ≤ 0.001. See legend to Fig. 1 for abbreviations.
Fig. 5
Fig. 5
Extracellular intracerebral ds-HMGB1 induces cell death. a Representative sections stained for DNA fragmentation using the TUNEL assay. Arrows indicate examples of positive cells. Scale bar, 50 µm (20 µm in the high-magnification image). b Percentage of TUNEL+ cells present along the injection site in each animal. Rats injected with ds-HMGB1 had significantly more TUNEL+ cells present at the injection site (p = 0.01 vs. saline). Data are expressed as median ± IQR. p values were calculated using a Kruskal-Wallis corrected for multiple comparisons using the Dunn test (n = 8–10 rats/group). * p ≤ 0.05, ** p ≤ 0.01, *** p ≤ 0.001. See legend to Fig. 1 for abbreviations.
Fig. 6
Fig. 6
Intracerebral LPS induces systemic inflammation serum α1-acid glycoprotein (AGP) concentrations, as determined by ELISA. Significantly increased AGP levels were detected in LPS-treated animals, but not in HMGB1-treated animals (LPS vs. pre-op, p = 0.003; LPS vs. saline, p = 0.0129). Data are expressed as median ± IQR. p values were calculated using a Kruskal-Wallis test corrected for multiple comparisons using the Dunn test (n = 8–12 rats/group). * p ≤ 0.05, ** p ≤ 0.01, *** p ≤ 0.001. See legend to Fig. 1 for abbreviations.

References

    1. Gelderblom M, Sobey CG, Kleinschnitz C, Magnus T. Danger signals in stroke. Ageing Res Rev. 2015;24:77–82. - PubMed
    1. Thundyil J, Lim KL. DAMPs and neurodegeneration. Ageing Res Rev. 2015;24:17–28. - PubMed
    1. Wang H, Bloom O, Zhang M, Vishnubhakat JM, Ombrellino M, Che J, Frazier A, Yang H, Ivanova S, Borovikova L, Manogue KR, Faist E, Abraham E, Andersson J, Andersson U, Molina PE, Abumrad NN, Sama A, Tracey KJ. HMG-1 as a late mediator of endotoxin lethality in mice. Science. 1999;285:248–251. - PubMed
    1. Yang H, Lundback P, Ottosson L, Erlandsson-Harris H, Venereau E, Bianchi ME, Al-Abed Y, Andersson U, Tracey KJ, Antoine DJ. Redox modification of cysteine residues regulates the cytokine activity of high mobility group box-1 (HMGB1) Mol Med. 2012;18:250–259. - PMC - PubMed
    1. Hori O, Brett J, Slattery T, Cao R, Zhang J, Chen JX, Nagashima M, Lundh ER, Vijay S, Nitecki D, et al. The receptor for advanced glycation end products (RAGE) is a cellular binding site for amphoterin. Mediation of neurite outgrowth and co-expression of rage and amphoterin in the developing nervous system. J Biol Chem. 1995;270:25752–25761. - PubMed

Publication types

MeSH terms