Review
. 2019 Jan 20;30(3):443-486.
doi: 10.1089/ars.2017.7268. Epub 2018 Nov 22.

Carcinogenesis and Reactive Oxygen Species Signaling: Interaction of the NADPH Oxidase NOX1-5 and Superoxide Dismutase 1-3 Signal Transduction Pathways

Affiliations
Review

Carcinogenesis and Reactive Oxygen Species Signaling: Interaction of the NADPH Oxidase NOX1-5 and Superoxide Dismutase 1-3 Signal Transduction Pathways

Alessia Parascandolo et al. Antioxid Redox Signal. .

Abstract

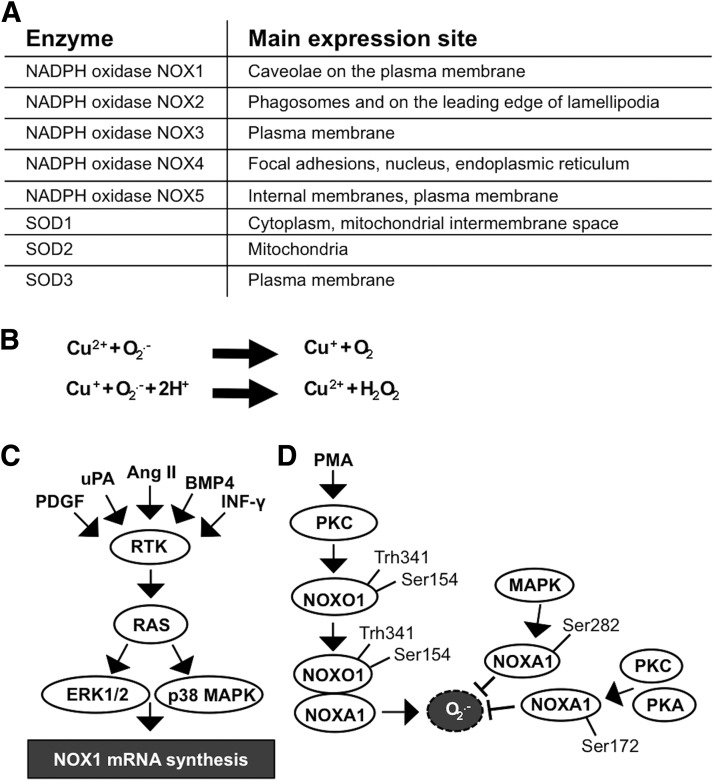
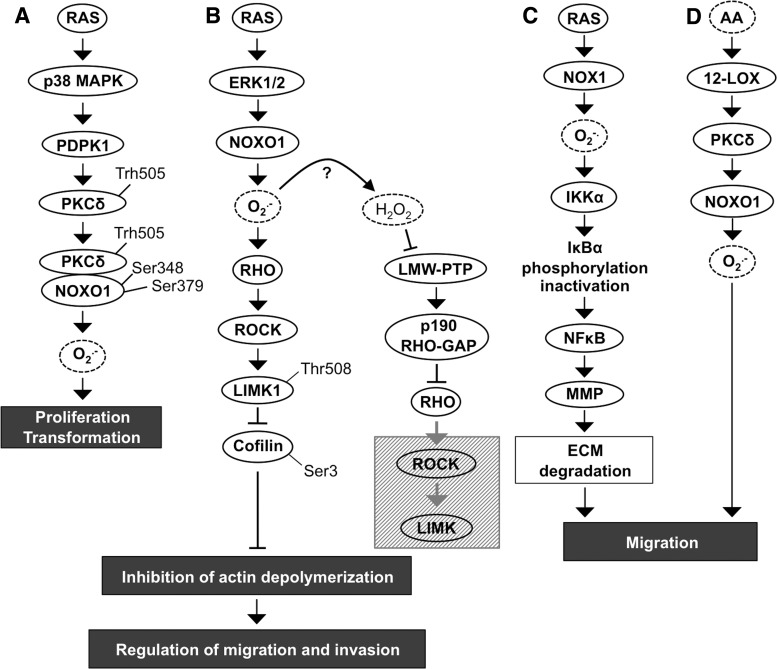
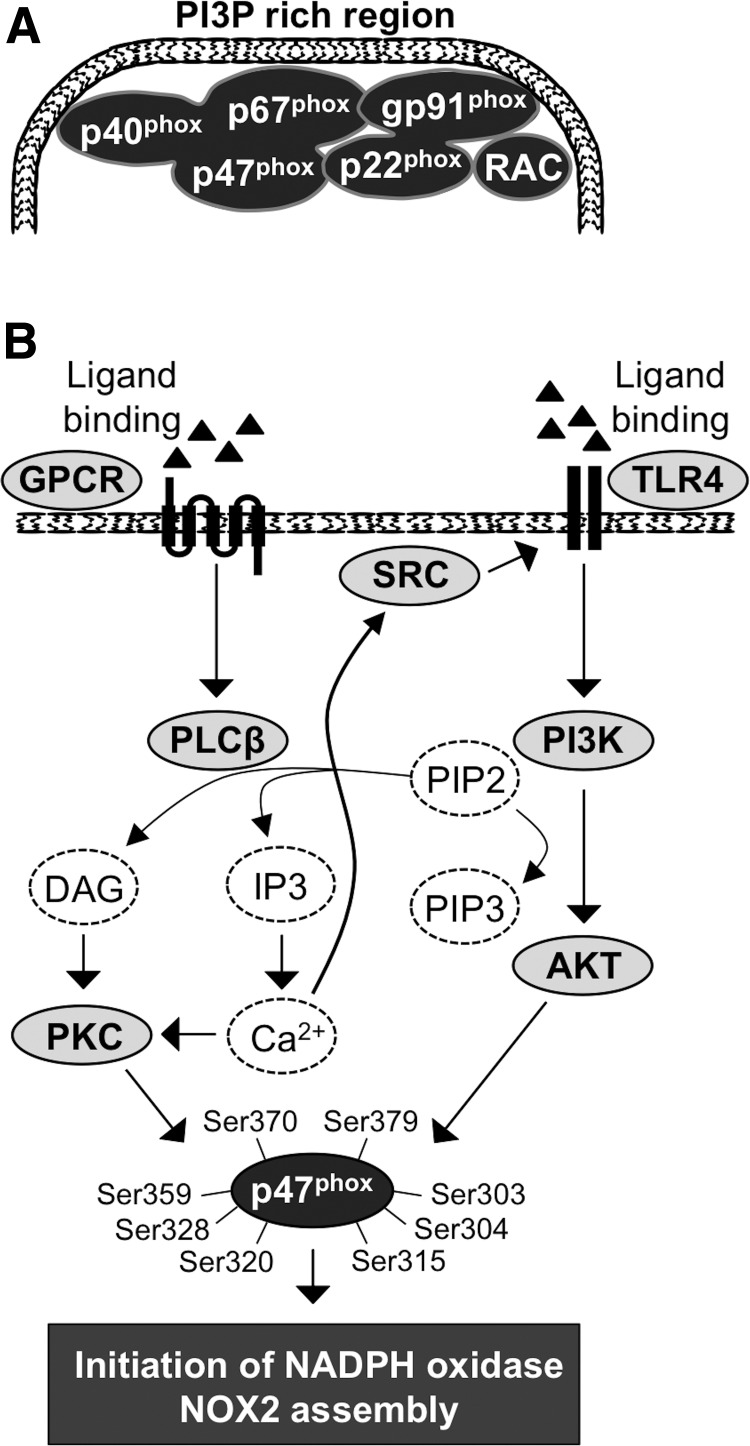
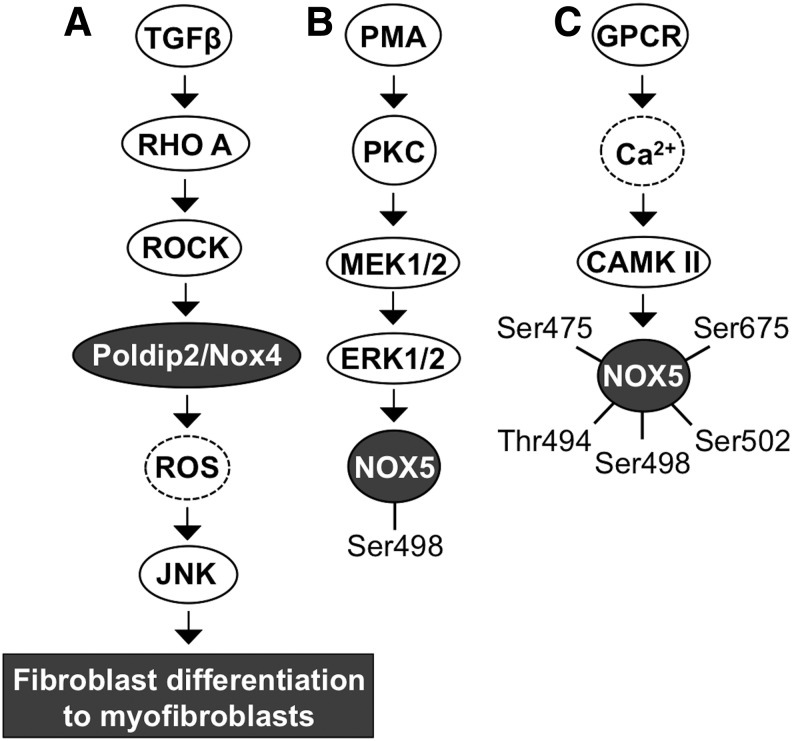
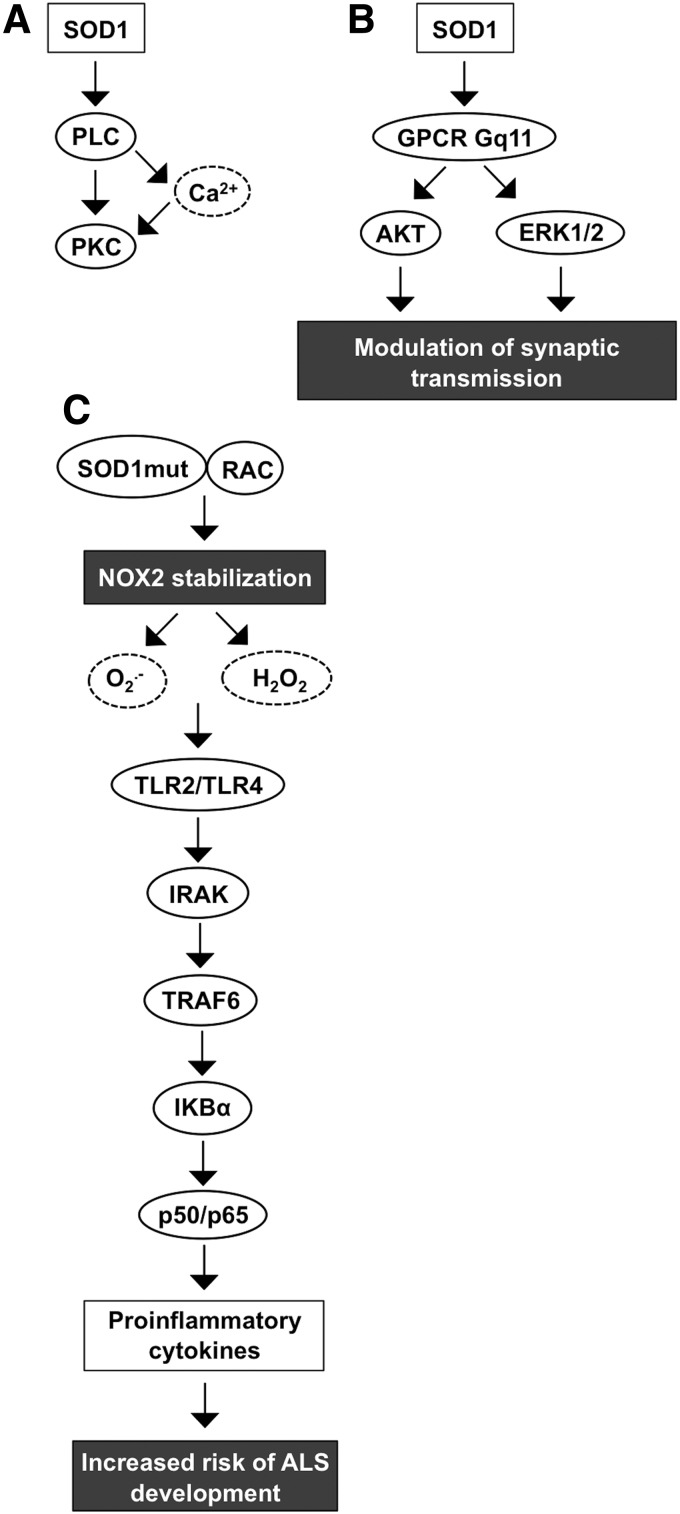
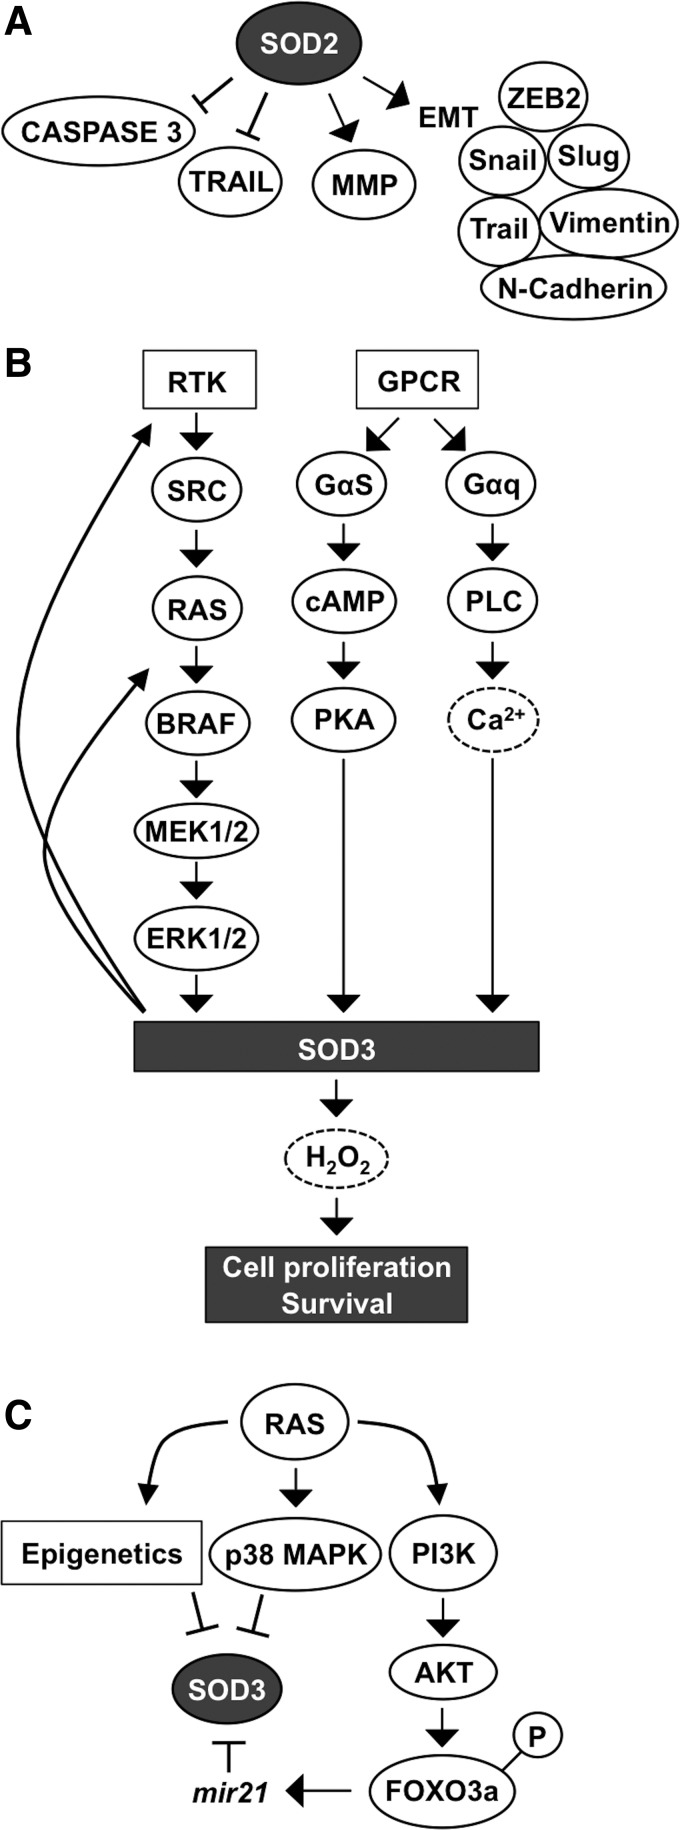
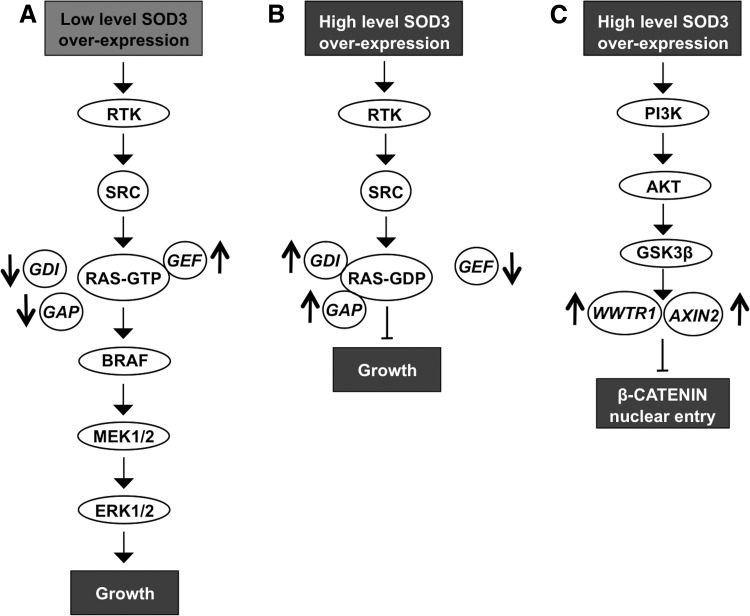
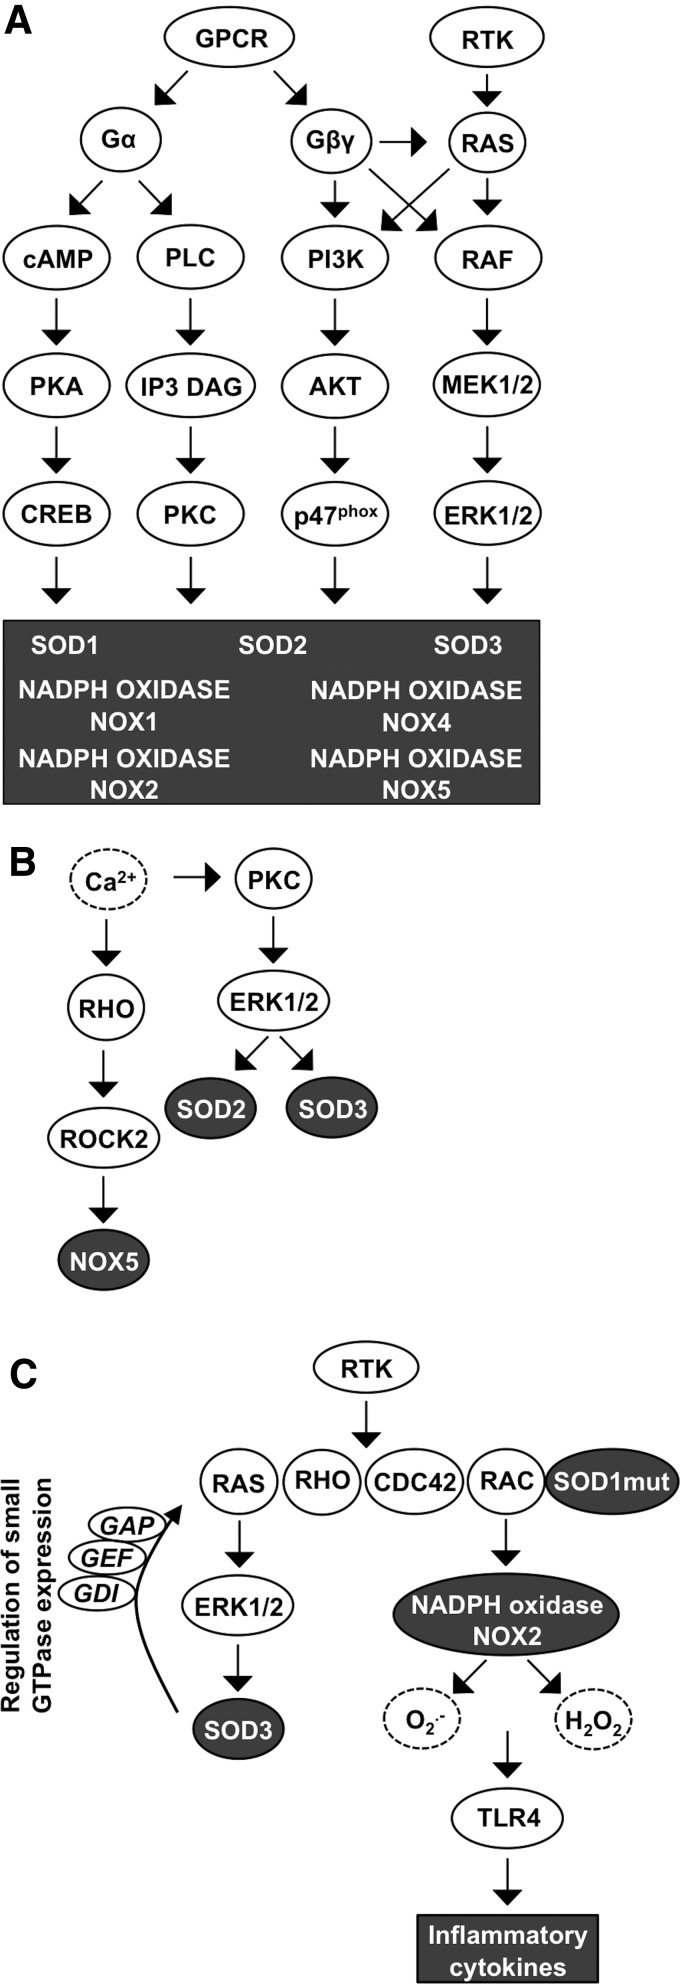
Significance: Reduction/oxidation (redox) balance could be defined as an even distribution of reduction and oxidation complementary processes and their reaction end products. There is a consensus that aberrant levels of reactive oxygen species (ROS), commonly observed in cancer, stimulate primary cell immortalization and progression of carcinogenesis. However, the mechanism how different ROS regulate redox balance is not completely understood. Recent Advances: In the current review, we have summarized the main signaling cascades inducing NADPH oxidase NOX1-5 and superoxide dismutase (SOD) 1-3 expression and their connection to cell proliferation, immortalization, transformation, and CD34+ cell differentiation in thyroid, colon, lung, breast, and hematological cancers.

Critical issues: Interestingly, many of the signaling pathways activating redox enzymes or mediating the effect of ROS are common, such as pathways initiated from G protein-coupled receptors and tyrosine kinase receptors involving protein kinase A, phospholipase C, calcium, and small GTPase signaling molecules.

Future directions: The clarification of interaction of signal transduction pathways could explain how cells regulate redox balance and may even provide means to inhibit the accumulation of harmful levels of ROS in human pathologies.

Keywords: G protein-coupled receptor; NADPH oxidase NOX; redox signaling; superoxide dismutase; tyrosine kinase receptor.


Figures

<b>FIG. 1.</b>
FIG. 1.
Redox enzyme NADPH oxidase 1–5 and SOD1–3 expression is influenced by various factors in different cellular localizations. (A) Primary expression sites at cell membranes and cellular organelles. (B) O2•− is dismutated to H2O2 in two half-reactions. (C) Stimulation of NOX1 expression. RTK activation induces RAS-ERK1/2 and RAS-p38MAPK signaling pathways, thereby stimulating NOX1 mRNA synthesis. (D) Mitogen stimulation of the PKC pathway induces NOXO1 phosphorylation at Thr154 and Thr341 causing dimer formation with NOXA1 and consequent O2•− formation, which is attenuated by MAPK, PKC, and PKA-induced phosphorylation of NOXA1 at Ser172 and Ser282. H2O2, hydrogen peroxide; mRNA, messenger RNA; NOXA1, NADPH oxidase activator 1 subunit; NOXO1, NADPH oxidase organizer 1 subunit; O2•−, superoxide anion; PKA/AKT, protein kinase A; PKC, protein kinase C; redox, reduction/oxidation; RTK, tyrosine kinase receptor; SOD, superoxide dismutase.
<b>FIG. 2.</b>
FIG. 2.
RAS induces the proliferation and migration of cancer cells via NOX1. (A) The RAS-p38MAPK signaling pathway induces PKCδ phosphorylation at Thr505, which causes consequent PKCδ-NOXO1 dimerization and phosphorylation of NOXO1 at Ser348 and Ser379. NADPH oxidase NOX1 produces O2•− thereby stimulating cancer cell migration. (B) RAS-ERK1/2 induced NOXO1 activation and increased O2•−-stimulated signaling downstream to the RHO-ROCK-LIMK1 pathway that then inhibits cofilin by phosphorylation at Ser3 and consequently impacts actin depolymerization. H2O2 produced after activation of NOXO1 may inactivate phosphotyrosine phosphatase LMW-PTP. Consequent increased expression of p190 RHO GAP enhances GTP removal from RHO small GTPase downregulating the downstream ROCK-LIMK1 pathway. (C) RAS-induced signaling through IKKα-NFκB induces local cancer cell migration by MMP activation and ECM degradation. (D) Migration is also stimulated by arachidonic acid and 12-lipoxygenase-induced PKCδ signaling that activates NOXO1 and increases O2•− production. ECM, extracellular matrix; GAP, small GTPase activator protein; IKKα, inhibitor of nuclear factor kappa-B kinase subunit α; LIMK, LIM kinase; LMW-PTP, low-molecular-weight phosphotyrosine phosphatase; MMP, matrix metalloproteinase; NFκB, nuclear factor kappa-light-chain-enhancer of activated B cells; PTP, protein tyrosine phosphatase; ROCK, RHO-associated, coiled-coil-containing protein kinase.
<b>FIG. 3.</b>
FIG. 3.
Activation of NADPH oxidase NOX2 assembly. (A) NADPH oxidase NOX2 is composed of a p40phox-p67phox-p47phox heterotrimer and a p22phox-gp91phox dimer that is activated at the cell membrane by association of small GTPase RAC into the complex. (B) GPCR activation stimulates PLCβ-DAG/IP3-Ca2+-PKC signaling that phosphorylates p47phox. Ca2+ may alternatively phosphorylate the SRC oncogene followed by activation of the TLR4-PI3K-AKT pathway, which further stimulates p47phox subunit phosphorylation. Ca2+, calcium; Ca2+-PKC, calcium-protein kinase C; DAG, diacylglycerol; GPCR, G protein-coupled receptor; IP3, inositol triphosphate; PI3K, phosphatidylinositol-4,5-bisphosphate 3-kinase; PLC, phospholipase C; TLR4, Toll-like receptor 4.
<b>FIG. 4.</b>
FIG. 4.
NOX4 and NOX5 activation. (A) TGFβ-driven activation of RHO-ROCK signaling increases NOX4 synthesis and consequent ROS production. (B) Mitogen stimulus caused by the PMA-activated PKC-MEK1/2-ERK1/2 signaling cascade stimulates NOX5 phosphorylation at Ser498. (C) GPCR activation increases Ca2+ influx, which then increases CAMKII and PKCα activation and consequently increases NOX5 phosphorylation at Ser475, Thr494, Ser498, Ser502, and Ser675. CAMKII, calcium/calmodulin-dependent kinase II; GPCR, G protein-coupled receptor; JNK, C-Jun N-terminal kinase; PMA, phorbol 12-myristate 13-acetate; ROS, reactive oxygen species; TGFβ, transforming growth factor β.
<b>FIG. 5.</b>
FIG. 5.
SOD1 signal transduction. (A) SOD1 activates PLC-Ca2+-PKC signaling. (B) Activation of GPCR Gq11 by SOD1 stimulates AKT and ERK1/2 signaling modulating synaptic transcriptions. (C) Mutant SOD1 binds to small GTPase RAC in an redox-insensitive manner causing NADPH oxidase NOX2 stabilization and increased proinflammatory cytokine production through TLR-IRAK-TRAF6 signal transduction. Increased cytokine production is a risk factor in ALS development. ALS, amyotrophic lateral sclerosis; IRAK, interleukin-1 receptor-associated kinase; TNF, tumor necrosis factor; TRAF6, TNF receptor-associated factor 6.
<b>FIG. 6.</b>
FIG. 6.
SOD2 and SOD3 in cell metastasis and in cell survival. (A) SOD2 promotes metastatic signaling molecule activation and inhibits apoptosis by downregulating caspase 3 and TRAIL, and by upregulating EMT mediating proteins and MMPs. (B) RTK-SRC-RAS-ERK1/2, GPCR-cAMP-PKA, and GPCR-PLC-Ca2+ signaling activate SOD3 production, thereby increasing cell proliferation and survival. Positive feedback signaling increases RTK phosphorylation and RAS GTP loading, thus maintaining activity of the RAS-ERK1/2 cascade. (C) RAS controls SOD3 expression through epigenetics, by p38MAPK activation, and by the PI3K-AKT-FOXO3a pathway. PI3K-AKT activation causes phosphorylation of the transcription factor, FOXO3a, resulting in its transfer from the nucleus to the cytoplasm, thereby increasing mir21 synthesis, which targets SOD3 mRNA. EMT, epithelial/mesenchymal transition; FOXO, forkhead box family; PI3K, phosphatidylinositol-4,5-bisphosphate 3-kinase; TRAIL, TNF-related apoptosis-inducing ligand.
<b>FIG. 7.</b>
FIG. 7.
SOD3 regulation of signal transduction. (A) Low level of SOD3 expression increases RTK and SRC phosphorylation and allows signaling through small GTPase RAS by increasing GEF expression and decreasing GAP and GDI expression. (B) High level of SOD3 expression increases RTK and SRC phosphorylation but inactivates small GPTase RAS by decreasing GEF expression and increasing GAP and GDI expression. Thereby, the signal does not proceed to mitogenic pathway. (C) High level of SOD3 expression increases WWTR1 and AXIN2 expression inhibiting β-CATENIN nuclear entry, which then attenuates growth. AXIN2, axis inhibition protein 2; GDI, guanine nucleotide disassociation inhibitor; GEF, guanine nucleotide exchange factor; WWTR1, WW domain containing transcription regulator 1.
<b>FIG. 8.</b>
FIG. 8.
Interaction of GPCR, Ca2+, RTK, and small GTPase signaling affecting redox gene expression. (A) GPCR Gα and Gβγ activation increases signaling through cAMP, PLC, small GTPases, PI3K-AKT, RAS, and RAF, which are among the redox-linked signal transduction molecules, thereby stimulating expression of SOD1–3 and NADPH oxidases NOX1, −2, −4, and −5. RTK activation occurs at the level of RAF and PI3K signaling molecules. (B) Ca2+ increases small GTPase RHO-ROCK signaling that stimulates NOX5 expression. Ca2+ activates also PKC-ERK1/2 pathway causing increased SOD2 and SOD3 production. (C) RTK and small GTPase activation stimulate ERK1/2 signal transduction that promotes SOD3 expression and formation of a regulatory loop affecting small GTPase activation. Mutant SOD1 binds to small GPTase RAC in a redox-insensitive manner causing continuous ROS production and inflammatory cytokine synthesis.
<b>FIG. 9.</b>
FIG. 9.
NOX1-5 and SOD1-3 gene expression inn thyroid cancers extracted from Oncomine Giordano database. Gene expression values were collected individually from the database in each thyroid cancer and presented as Log2 mediancentered intensity expression. The p-values (p < 0.05, p < 0.01, p < 0.001) were determined by two-tail independent samples t-tests comparing to normal thyroid expression level.
<b>FIG. 10.</b>
FIG. 10.
NOX1–5 and SOD1–3 gene expression in papillary thyroid cancer extracted from Oncomine He database. Gene expression values in papillary thyroid cancer were compared with the normal thyroid expression values of the same patients. The results are shown as percentage change of the Log2 median-centered intensity expression level.
<b>FIG. 11.</b>
FIG. 11.
NOX1–5 and SOD1–3 gene expression in colon tumors extracted from Oncomine Sabates-Bellver and Ki databases. (A) NOX1–5 and SOD1–3 expression in benign colon adenoma normalized against the normal colon tissue of the same patient. The data suggest high differences between individuals in redox gene expression. (B) NOX1–5 and SOD1–3 expression in primary colon adenocarcinoma tumor and in metastasis extracted from Ki colon database. Database analysis suggests increased SOD1, NOX4, and NOX5 expression in metastasis, stable SOD2 expression, and decreased SOD3 and NOX2 expression in metastasis.
<b>FIG. 12.</b>
FIG. 12.
NOX1–5 and SOD1–3 gene expression in breast tumors extracted from the Oncomine Ma database. (A) NOX1–5 and SOD1–3 expression in normal breast, in ductal breast carcinoma in situ, and in invasive ductal breast carcinoma of the same patient. NOX4 expression is significantly (p < 0.001) increased in both in situ and invasive ductal breast carcinomas. (B–I) Percentage change in NOX1–5 and SOD1–3 expression in ductal breast carcinoma in situ and in invasive ductal breast carcinoma as normalized against the normal breast tissue of the same patient. p-Values (p < 0.05, p < 0.01, p < 0.001) were determined by two-tail independent sample t-tests.
<b>FIG. 13.</b>
FIG. 13.
NOX1–5 and SOD1–3 gene expression in lung tumors extracted from the Oncomine Landi database. (A) NOX1–5 and SOD1–3 expression in normal lung and in lung adenocarcinoma of the same patient. (B) Percentage change of NOX1–5 and SOD1–3 expression in lung adenocarcinoma normalized against the normal lung tissue of the same patient.
<b>FIG. 14.</b>
FIG. 14.
NOX1–5 and SOD1–3 gene expression in CD34+ cells and in AML extracted from Oncomine Valk database. Gene expression values were collected from BM, peripheral blood CD34+, and AML cells. NOX2, NOX4, NOX5, SOD2, and SOD3 redox gene expression values show differences between hypoxic BM and circulating CD34+ primitive hematopoietic progenitor cells. NOX2 and SOD1 show the highest expression values in collected samples. AML, acute myeloid leukemia; BM, bone marrow.

References

    1. Abdel-Mageed AS, Senagore AJ, Pietryga DW, Connors RH, Giambernardi TA, Hay RV, and Deng W. Intravenous administration of mesenchymal stem cells genetically modified with extracellular superoxide dismutase improves survival in irradiated mice. Blood 113: 1201–1203, 2009. - PubMed
    1. Abrahamsson T, Brandt U, Marklund SL, and Sjoqvist PO. Vascular bound recombinant extracellular superoxide dismutase type C protects against the detrimental effects of superoxide radicals on endothelium-dependent arterial relaxation. Circ Res 70: 264–271, 1992. - PubMed
    1. Adachi T, Toishi T, Takashima E, and Hara H. Infliximab neutralizes the suppressive effect of TNF-alpha on expression of extracellular-superoxide dismutase in vitro. Biol Pharm Bull 29: 2095–2098, 2006. - PubMed
    1. Adachi T, Yamada H, Futenma A, Kato K, and Hirano K. Heparin-induced release of extracellular-superoxide dismutase form (V) to plasma. J Biochem 117: 586–590, 1995. - PubMed
    1. Adachi Y, Shibai Y, Mitsushita J, Shang WH, Hirose K, and Kamata T. Oncogenic Ras upregulates NADPH oxidase 1 gene expression through MEK-ERK-dependent phosphorylation of GATA-6. Oncogene 27: 4921–4932, 2008. - PubMed

Publication types

LinkOut - more resources