

A Comparison of Bone Marrow and Cord Blood Mesenchymal Stem Cells for Cartilage Self-Assembly
- PMID: 29478385
- PMCID: PMC6080118
- DOI: 10.1089/ten.TEA.2017.0424
A Comparison of Bone Marrow and Cord Blood Mesenchymal Stem Cells for Cartilage Self-Assembly
Abstract
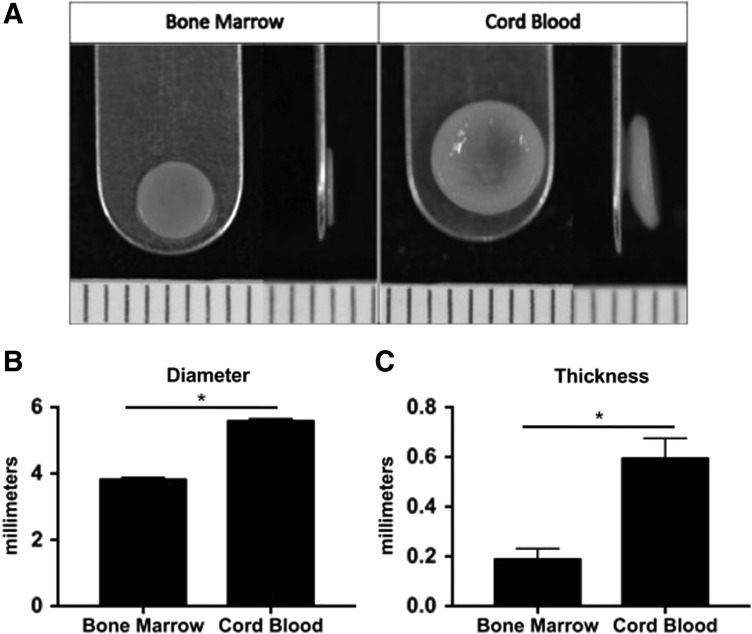
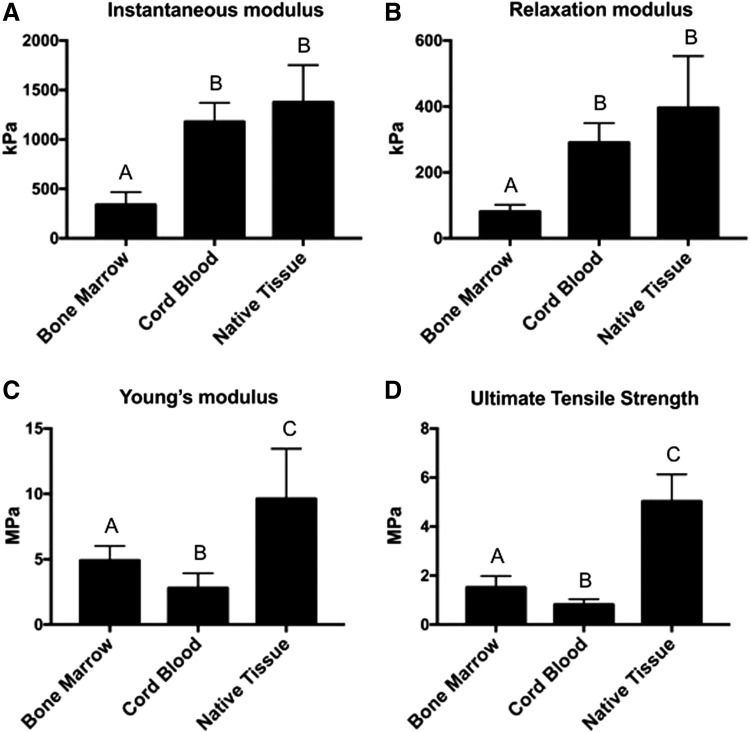
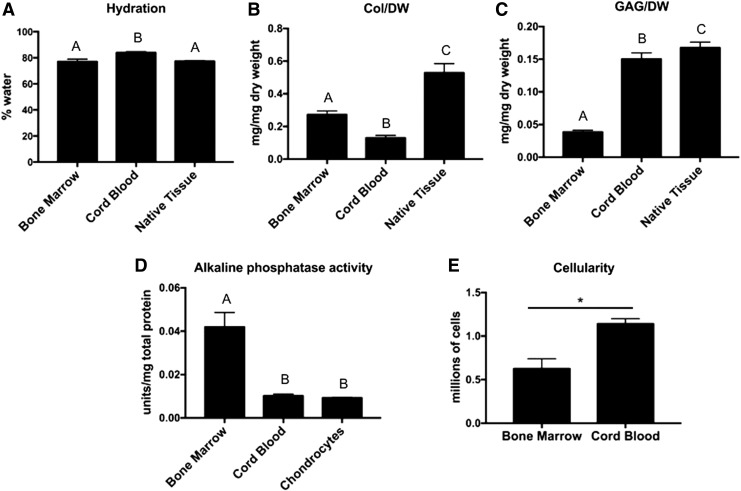
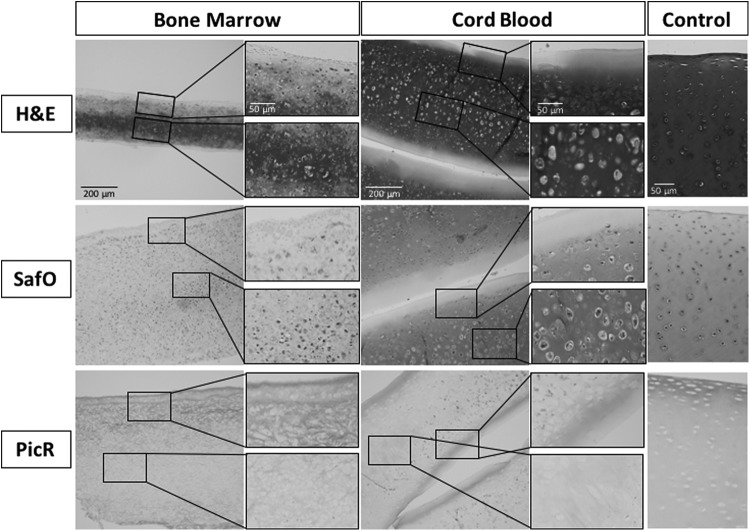
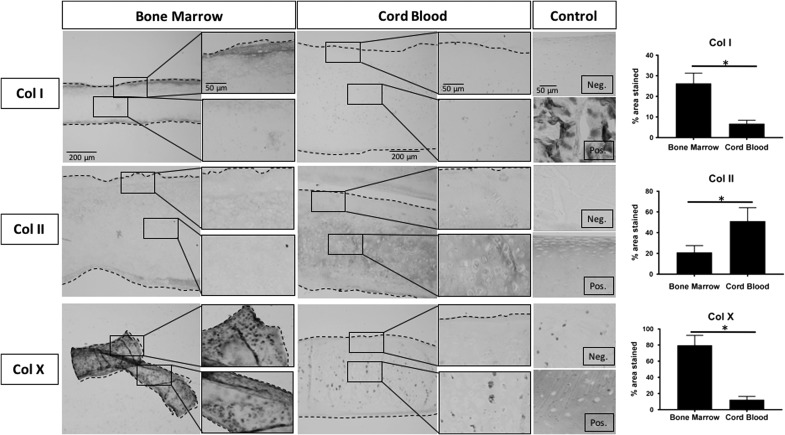
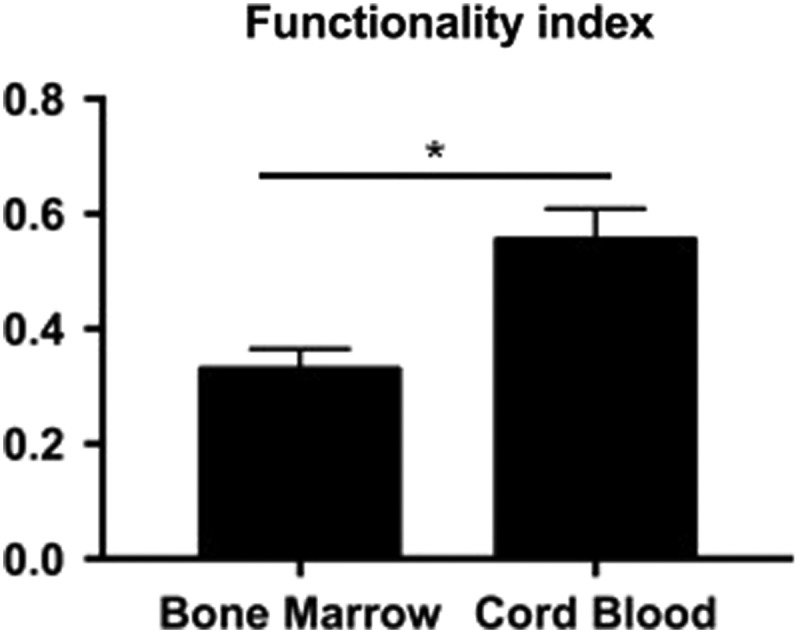
Joint injury is a common cause of premature retirement for the human and equine athlete alike. Implantation of engineered cartilage offers the potential to increase the success rate of surgical intervention and hasten recovery times. Mesenchymal stem cells (MSCs) are a particularly attractive cell source for cartilage engineering. While bone marrow-derived MSCs (BM-MSCs) have been most extensively characterized for musculoskeletal tissue engineering, studies suggest that cord blood MSCs (CB-MSCs) may elicit a more robust chondrogenic phenotype. The objective of this study was to determine a superior equine MSC source for cartilage engineering. MSCs derived from bone marrow or cord blood were stimulated to undergo chondrogenesis through aggregate redifferentiation and used to generate cartilage through the self-assembling process. The resulting neocartilage produced from either BM-MSCs or CB-MSCs was compared by measuring mechanical, biochemical, and histological properties. We found that while BM constructs possessed higher tensile properties and collagen content, CB constructs had superior compressive properties comparable to that of native tissue and higher GAG content. Moreover, CB constructs had alkaline phosphatase activity, collagen type X, and collagen type II on par with native tissue suggesting a more hyaline cartilage-like phenotype. In conclusion, while both BM-MSCs and CB-MSCs were able to form neocartilage, CB-MSCs resulted in tissue more closely resembling native equine articular cartilage as determined by a quantitative functionality index. Therefore, CB-MSCs are deemed a superior source for the purpose of articular cartilage self-assembly.
Keywords: MSCs; cartilage; equine; mesenchymal stem cells; tissue engineering.
Conflict of interest statement
No competing financial interests exist.
Figures
Similar articles
-
Comparison of the Chondrogenic Potential of Mesenchymal Stem Cells Derived from Bone Marrow and Umbilical Cord Blood Intended for Cartilage Tissue Engineering.Stem Cell Rev Rep. 2020 Feb;16(1):126-143. doi: 10.1007/s12015-019-09914-2. Stem Cell Rev Rep. 2020. PMID: 31745710
-
Characterization and use of Equine Bone Marrow Mesenchymal Stem Cells in Equine Cartilage Engineering. Study of their Hyaline Cartilage Forming Potential when Cultured under Hypoxia within a Biomaterial in the Presence of BMP-2 and TGF-ß1.Stem Cell Rev Rep. 2017 Oct;13(5):611-630. doi: 10.1007/s12015-017-9748-y. Stem Cell Rev Rep. 2017. PMID: 28597211
-
Chondrogenic potential of mesenchymal stromal cells derived from equine bone marrow and umbilical cord blood.Vet Comp Orthop Traumatol. 2009;22(5):363-70. doi: 10.3415/VCOT-08-10-0107. Epub 2009 Aug 28. Vet Comp Orthop Traumatol. 2009. PMID: 19750290
-
Mechanical stimulation of mesenchymal stem cells: Implications for cartilage tissue engineering.J Orthop Res. 2018 Jan;36(1):52-63. doi: 10.1002/jor.23670. Epub 2017 Aug 11. J Orthop Res. 2018. PMID: 28763118 Review.
-
Chondrogenesis of mesenchymal stem cells: role of tissue source and inducing factors.Stem Cell Res Ther. 2010 Oct 13;1(4):31. doi: 10.1186/scrt31. Stem Cell Res Ther. 2010. PMID: 20959030 Free PMC article. Review.
Cited by
-
Considerations for translation of tissue engineered fibrocartilage from bench to bedside.J Biomech Eng. 2018 Dec 5;141(7):0708021-07080216. doi: 10.1115/1.4042201. Online ahead of print. J Biomech Eng. 2018. PMID: 30516244 Free PMC article.
-
Enhancement in sustained release of antimicrobial peptide and BMP-2 from degradable three dimensional-printed PLGA scaffold for bone regeneration.RSC Adv. 2019 Apr 4;9(19):10494-10507. doi: 10.1039/c8ra08788a. eCollection 2019 Apr 3. RSC Adv. 2019. PMID: 35515290 Free PMC article.
-
Human umbilical cord mesenchymal stem cells overexpressing RUNX1 promote tendon-bone healing by inhibiting osteolysis, enhancing osteogenesis and promoting angiogenesis.Genes Genomics. 2024 Apr;46(4):461-473. doi: 10.1007/s13258-023-01478-3. Epub 2024 Jan 5. Genes Genomics. 2024. PMID: 38180714
-
Chondrogenic potential of mesenchymal stem cells from horses using a magnetic 3D cell culture system.World J Stem Cells. 2021 Jun 26;13(6):645-658. doi: 10.4252/wjsc.v13.i6.645. World J Stem Cells. 2021. PMID: 34249233 Free PMC article.
-
A cell bank paradigm for preclinical evaluation of an analogous cellular product for an allogeneic cell therapy.Biofabrication. 2024 Jun 3;16(3):10.1088/1758-5090/ad4de2. doi: 10.1088/1758-5090/ad4de2. Biofabrication. 2024. PMID: 38768586 Free PMC article.
References
-
- Ristolainen L., Heinonen A., Turunen H., et al. . Type of sport is related to injury profile: a study on cross country skiers, swimmers, long-distance runners and soccer players. A retrospective 12-month study. Scand J Med Sci Sports 20, 384, 2009 - PubMed
-
- Penell J.C., Egenvall A., Bonnett B.N., Olson P., and Pringle J. Specific causes of morbidity among Swedish horses insured for veterinary care between 1997 and 2000. Vet Rec 157, 470, 2005 - PubMed
Publication types
MeSH terms
Grants and funding
LinkOut - more resources
Full Text Sources
Other Literature Sources
