. 2018 Apr:68:57-74.
doi: 10.1016/j.npep.2018.02.003. Epub 2018 Feb 15.

Determination of neurotensin projections to the ventral tegmental area in mice

Affiliations

Determination of neurotensin projections to the ventral tegmental area in mice

Hillary L Woodworth et al. Neuropeptides. 2018 Apr.

Abstract

Pharmacologic treatment with the neuropeptide neurotensin (Nts) modifies motivated behaviors such as feeding, locomotor activity, and reproduction. Dopamine (DA) neurons of the ventral tegmental area (VTA) control these behaviors, and Nts directly modulates the activity of DA neurons via Nts receptor-1. While Nts sources to the VTA have been described in starlings and rats, the endogenous sources of Nts to the VTA of mice remain incompletely understood, impeding determination of which Nts circuits orchestrate specific behaviors in this model. To overcome this obstacle we injected the retrograde tracer Fluoro-Gold into the VTA of mice that express GFP in Nts neurons. Identification of GFP-Nts cells that accumulate Fluoro-Gold revealed the Nts afferents to the VTA in mice. Similar to rats, most Nts afferents to the VTA of mice arise from the medial and lateral preoptic areas (POA) and the lateral hypothalamic area (LHA), brain regions that are critical for coordination of feeding and reproduction. Additionally, the VTA receives dense input from Nts neurons in the nucleus accumbens shell (NAsh) of mice, and minor Nts projections from the amygdala and periaqueductal gray area. Collectively, our data reveal multiple populations of Nts neurons that provide direct afferents to the VTA and which may regulate specific aspects of motivated behavior. This work lays the foundation for understanding endogenous Nts actions in the VTA, and how circuit-specific Nts modulation may be useful to correct motivational and affective deficits in neuropsychiatric disease.

Keywords: Dopamine; Fluoro-Gold; Lateral hypothalamic area; Motivation; Nucleus accumbens; Preoptic area; Retrograde tracing; Reward.


Figures

Fig. 1
Fig. 1
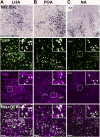
Validation of NtsCre;GFP mouse model. Side-by-side comparison of Nts mRNA expression via in situ hybridization (ISH) from the Allen Brain Atlas (Lein et al., 2007) to NtsCre;GFP mice treated with colchicine and co-stained for Nts peptide using immunofluorescence (magenta). Representative images from the A) LHA, B) POA, and C) NA are shown. Scale bars = 100um. LPO = lateral preoptic area, MPO = medial preoptic area, aca = anterior commissure. (For interpretation of the references to colour in this figure legend, the reader is referred to the web version of this article.)
Fig. 2
Fig. 2
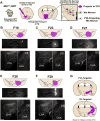
Confirmation of VTA targeting in NtsCre;GFP mice injected unilaterally with FG. A) NtsCre;GFP reporter mice were injected unilaterally in the VTA with FG allowing for simultaneous visualization of neurons that project to the VTA (FG positive neurons), Nts neurons (GFP positive neurons) and Nts afferents to the VTA (GFP/FG+ double-positive neurons). B–F). Midbrain images of the five VTA-targeted NtsCre;GFP mice included in the final analysis. The approximate spread of FG is shown in magenta. FG-labeled cell bodies of VTA-targeted animals are confined to the LHA, ZI, CeA, and absent from the DS. G) Expected afferent patterns to the VTA or SN based on Uchida (Watabe-Uchida et al., 2012). Scale bars = 200um. (For interpretation of the references to colour in this figure legend, the reader is referred to the web version of this article.)
Fig. 3
Fig. 3
Schematic illustration of Nts afferents to the VTA. Distribution patterns of Nts neurons and VTA afferents at different bregma coordinates. Green ovals represent GFP-labeled neurons, pink ovals represent FG-labeled neurons, and yellow stars indicate colocalized Nts/FG+ neurons. Only the sub-regions included in analysis are outlined in black and labeled, and blank regions do not necessarily indicate lack of GFP or FG. (For interpretation of the references to colour in this figure legend, the reader is referred to the web version of this article.)
Fig. 4
Fig. 4
Quantification of Nts-expressing afferents to the VTA by anatomical sub-region. Cell bodies colocalized with GFP and FG were counted in one of four coronal series through the brain. Bars thus represent approximately one quarter of the total number of colocalized GFP/FG+ neurons within each region, averaged across all 5 study mice described in Fig. 2B–F. This quantification method is the most conservative method to compare relative neuronal abundance between different brain areas, without oversampling that might occur if the counts were multiplied by 4 to approximate the total number of cells throughout the entire brain region. Areas that contained ≤1 colocalized neuron per section were not included in the quantification.
Fig. 5
Fig. 5
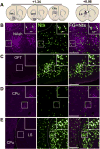
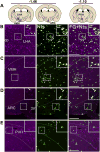
The NA shell contains clusters of Nts neurons that project to the VTA. A) Schematic of brain regions analyzed according to distance from Bregma. B) Many Nts/FG+ neurons were found in the NAsh (yellow arrows), but not NAc (Case F19). C) Nts expression in the OFT, an area that does not provide significant VTA input and hence few FG+ neuron was observed (Case F29). D) Representative expression of Nts and FG in the CPu shows little to no colocalization (Case F19). E) Nts neurons were numerous in the LS, an area that does not provide substantial input to the VTA (Case F29). Scale bar = 100uM. NAsh = nucleus accumbens shell, OFT = olfactory tubercle, CPu = caudate/putamen, LS = lateral septum. (For interpretation of the references to colour in this figure legend, the reader is referred to the web version of this article.)
Fig. 6
Fig. 6
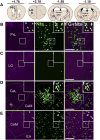
Cortical Nts inputs to the VTA originate in the CeA but not neocortex. A). Schematic of brain regions analyzed according to distance from Bregma. Representative images show the absence of FG and Nts co-labeling in the B) PFC and C) LO (Case 27). D) A dense population of Nts neurons resided in the lateral division of the caudal CeA, but these neurons were unlikely to project to the VTA (Case 27). E) Some Nts neurons in the medial CeA project colocalized with FG (yellow arrows) (Case 29). Scale bar = 100um. PrL = prelimbic cortex, LO = lateral orbital cortex CeM = medial division of CeA, CeL = lateral division of CeA, ec = external capsule, EA = extended amygdala. (For interpretation of the references to colour in this figure legend, the reader is referred to the web version of this article.)
Fig. 7
Fig. 7
Nts neurons in the IPAC, pallidum, and ST that project to the VTA. A) Schematic of brain regions analyzed according to distance from Bregma. B) Nts/FG+ neurons were observed in the lateral IPAC (yellow arrows) while the adjacent VP contained low numbers of Nts neurons (Case F19). C) Nts/FG+ neurons were observed in the ST (yellow arrows) (Case F27). Scale bar = 100um. IPAC = interstitial nucleus of the posterior limb of the anterior commissure, VP = ventral pallidum, stl = lateral division of bed of stria terminalis. (For interpretation of the references to colour in this figure legend, the reader is referred to the web version of this article.)
Fig. 8
Fig. 8
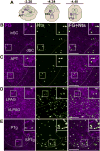
Nts-expressing inputs from the ZI and STN. A) Schematic of brain regions analyzed according to distance from Bregma. B) Caudal section of the hypothalamus showing Nts/FG+ neurons in the ZI (yellow arrows) but not the C) STN (both Case F19). Scale bar = 100um. pSTN = para-subthalamic nucleus, ZI = zona incerta, cp = cerebral peduncle. (For interpretation of the references to colour in this figure legend, the reader is referred to the web version of this article.)
Fig. 9
Fig. 9
Nts projections to the VTA from the POA. A) Schematic of brain regions analyzed according to distance from Bregma. B) A dense Nts population resided in the caudal MPO and many of these were Nts/FG+ neurons that projected to the VTA (yellow arrows) (Case F28). C) Numerous Nts/FG+ neurons were also observed in the rostral LPO (yellow arrows) (Case F23). Scale bars = 100um. MPN = median preoptic nucleus, MPO = medial preoptic area, LPO = lateral preoptic area. (For interpretation of the references to colour in this figure legend, the reader is referred to the web version of this article.)
Fig. 10
Fig. 10
Nts inputs from the LHA, VMH, ARC, and PVH. A) Schematic of brain regions analyzed according to distance from Bregma. B) The LHA contained a large number of Nts/FG+ neurons (yellow arrows). C) The VMH and D) ARC did not provide many Nts afferents to the VTA. E) The PVH contained minimal Nts neurons and was not a major source of Nts input to the VTA. All images from Case F28. Scale bars = 100um. cp = cerebral peduncle, LHA = lateral hypothalamic area, VMH = ventromedial hypothalamus, ARC = arcuate nucleus, 3V = third ventricle, PVH = paraventricular hypothalamus. (For interpretation of the references to colour in this figure legend, the reader is referred to the web version of this article.)
Fig. 11
Fig. 11
Brainstem Nts inputs to the VTA. A) Schematic of brain regions analyzed according to distance from Bregma. Few colocalized neurons were detected in the B) SC, C) APT (both Case F19), D) PAG (Case F27) and E) PTg (Case F19). Scale bar = 100um. inSC = inferior superior colliculus, dSC = dorsal superior colliculus, APT = anterior pretectal nucleus, LPAG = lateral periaqueductal grey, VLPAG = ventrolateral periaqueductal grey, PTg = pedunculopontine tegmental nucleus, SPTg = subpeduncular tegmental nucleus.
Fig. 12
Fig. 12
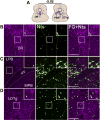
Brainstem Nts inputs to the VTA from the DR, PBN, and LDTg. A) Schematic of brain regions analyzed according to distance from Bregma. Few colcoalized neurons were detected in the B) DR, C) PB (both Case F23), and D) LDTg (Case F27). Scale bar = 100um. DR = dorsal raphe, LPB = lateral parabrachial nucleus, MPB = medial parabrachial nucleus, scp = superior cerebellar peduncle, LDTg = laterodorsal tegmental nucleus.
Fig. 13
Fig. 13
Minimal Nts expression in the VTA. NtsCre;GFP mice (n = 6) were used to determine the number and distribution of VTA Nts neurons and whether or not they co-express TH. A, B, C) Representative images of GFP-identified Nts neurons across three different bregma coordinates in the VTA of NtsCre;GFP mice (scale bar = 200um). Insets highlight individual Nts neurons and the presence or absence of colocalization with TH (greyarrows = TH+ Nts neurons, green arrows = TH- Nts neurons). These data demonstrate that of the few GFP+ cells found in the VTA, the majority do not colocalize with TH and are not DAergic. ml = medial lemniscus, ip = interpeduncular nucleus, fr = fasciculus retroflexus, mt = mammillothalamic tract. (For interpretation of the references to colour in this figure legend, the reader is referred to the web version of this article.)

Similar articles

Cited by

References

    1. Alexander MJ, Miller MA, Dorsa DM, Bullock BP, Melloni RH, Jr, Dobner PR, Leeman SE. Distribution of neurotensin/neuromedin N mRNA in rat fore-brain: unexpected abundance in hippocampus and subiculum. Proc Natl Acad Sci U S A. 1989;86:5202–5206. - PMC - PubMed
    1. Bayer VE, Towle AC, Pickel VM. Vesicular and cytoplasmic localization of neurotensin-like immunoreactivity (NTLI) in neurons postsynaptic to terminals containing NTLI and/or tyrosine hydroxylase in the rat central nucleus of the amygdala. J Neurosci Res. 1991;30:398–413. - PubMed
    1. Beaudet A, Woulfe J. Morphological substrate for neurotensin-dopamine interactions in the rat midbrain tegmentum. Ann N Y Acad Sci. 1992;668:173–185. - PubMed
    1. Beck B, Burlet A, Nicolas JP, Burlet C. Neurotensin in microdissected brain nuclei and in the pituitary of the lean and obese Zucker rats. Neuropeptides. 1989;13:1–7. - PubMed
    1. Beier KT, Steinberg EE, DeLoach KE, Xie S, Miyamichi K, Schwarz L, Gao XJ, Kremer EJ, Malenka RC, Luo L. Circuit architecture of VTA dopamine neurons revealed by systematic input-output mapping. Cell. 2015;162(3):622–634. - PMC - PubMed

MeSH terms

LinkOut - more resources