. 2018 Apr 4;26(4):1008-1019.
doi: 10.1016/j.ymthe.2018.01.019. Epub 2018 Jan 31.

Pre-existing Immunity to Oncolytic Virus Potentiates Its Immunotherapeutic Efficacy

Affiliations

Pre-existing Immunity to Oncolytic Virus Potentiates Its Immunotherapeutic Efficacy

Jacob M Ricca et al. Mol Ther. .

Abstract

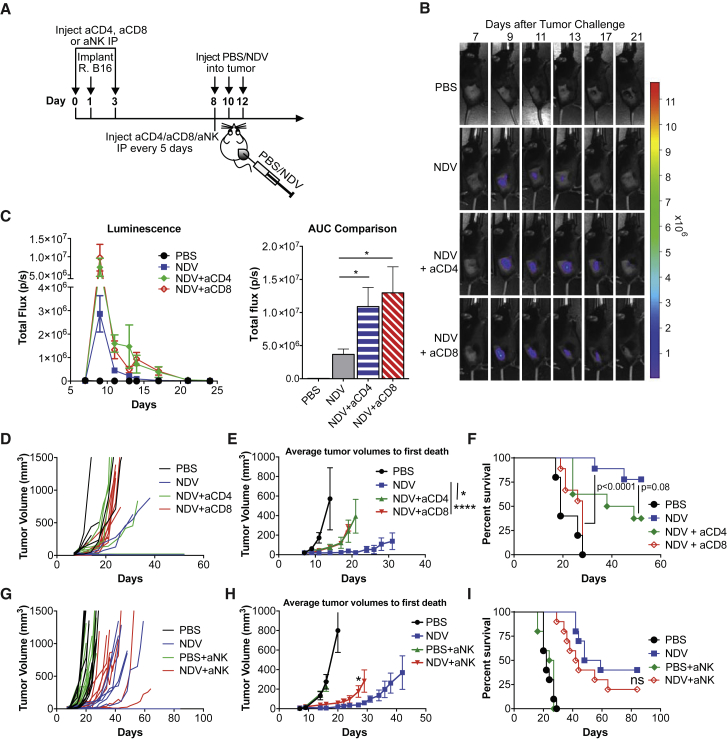
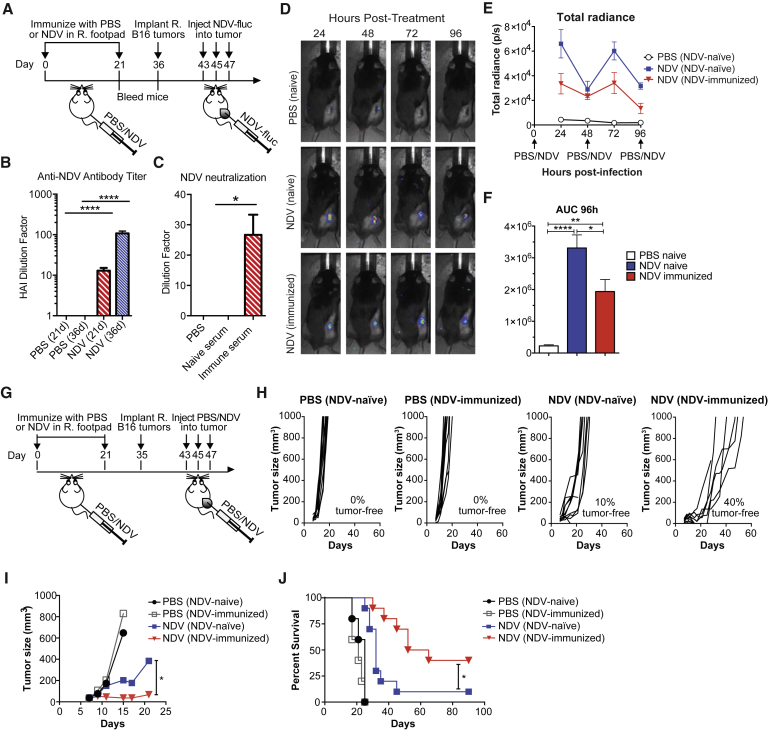
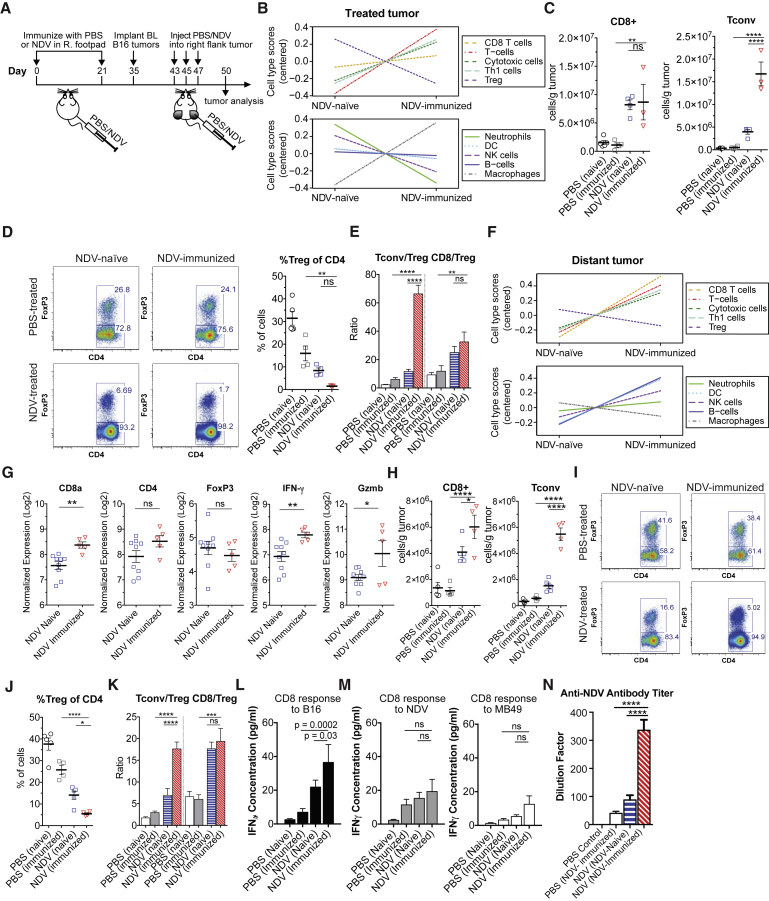
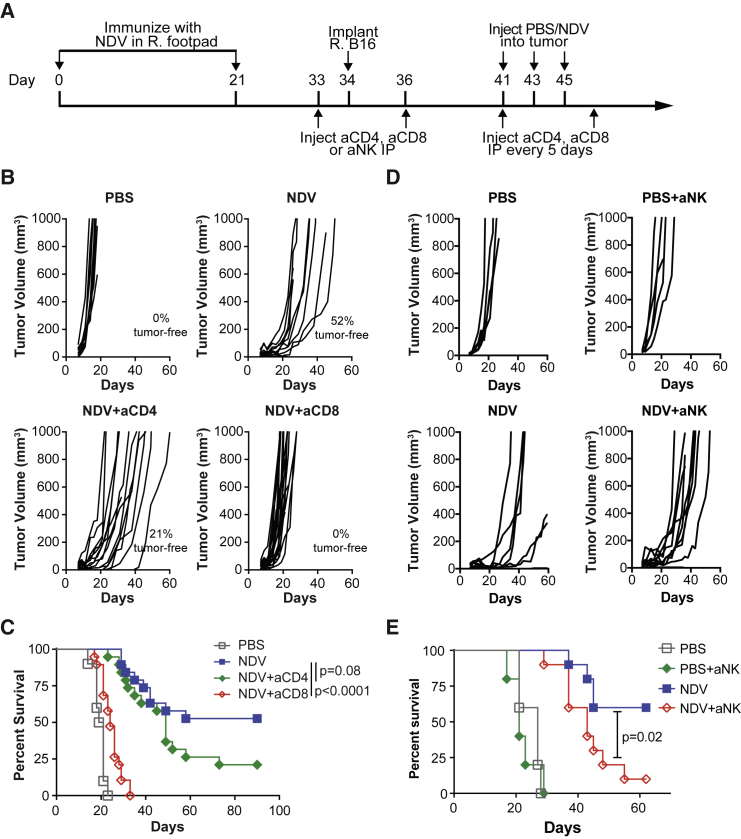
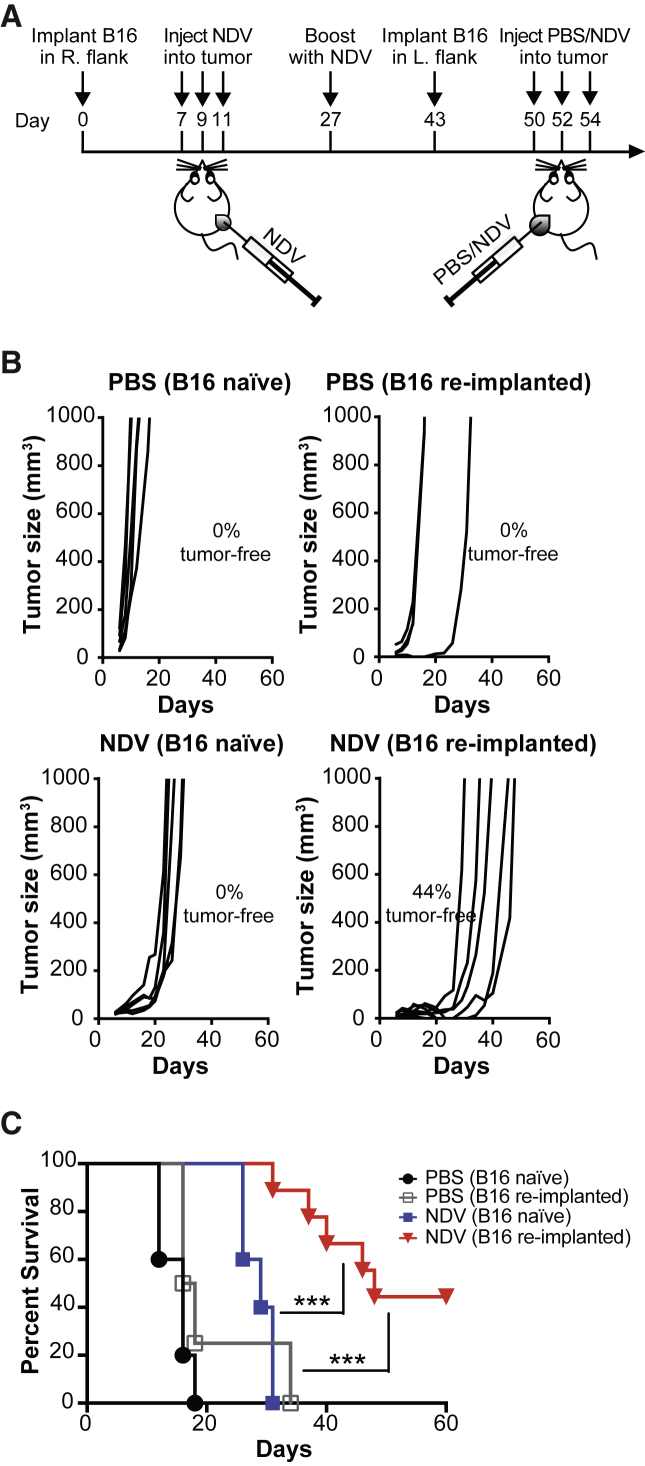
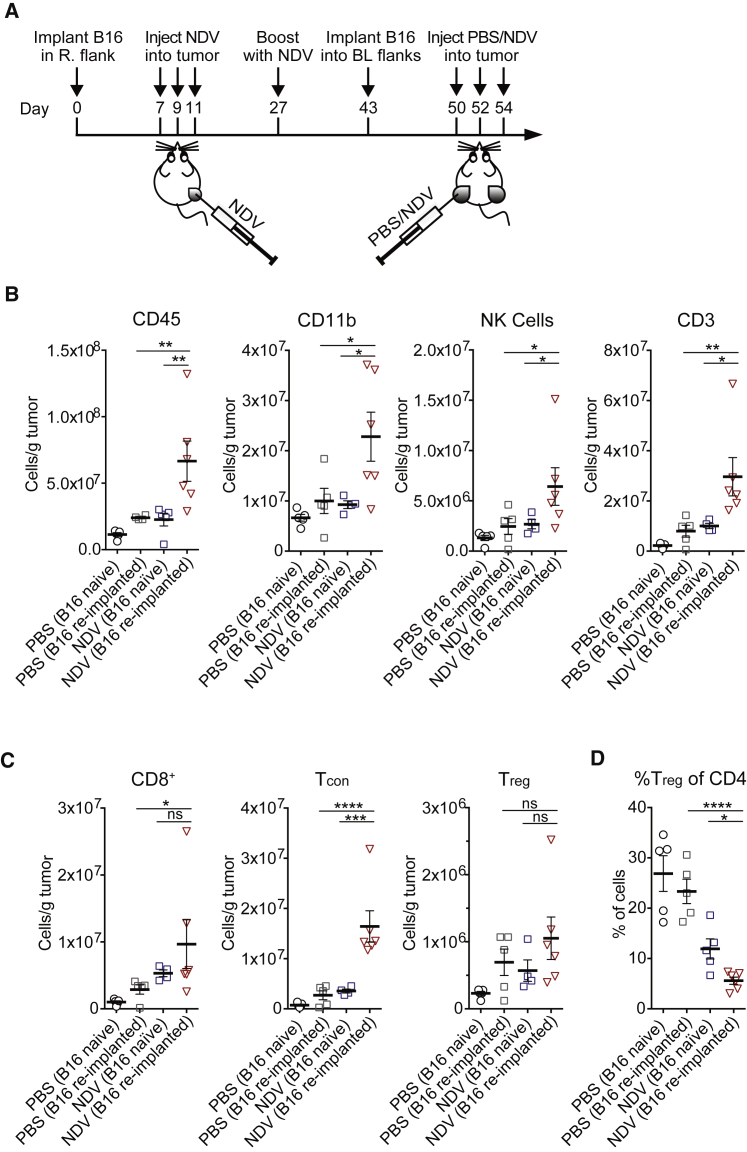
Anti-viral immunity presents a major hurdle for systemically administered oncolytic viruses (OV). Intratumoral OV therapy has a potential to overcome this problem through activation of anti-tumor immune response, with local and abscopal effects. However, the effects of anti-viral immunity in such a setting are still not well defined. Using Newcastle Disease Virus (NDV) as a model, we explore the effects of pre-existing anti-viral immunity on therapeutic efficacy in syngeneic mouse tumor models. Unexpectedly, we find that while pre-existing immunity to NDV limits its replication in tumors, tumor clearance, abscopal anti-tumor immune effects, and survival are not compromised and, on the contrary, are superior in NDV-immunized mice. These findings demonstrate that pre-existing immunity to NDV may increase its therapeutic efficacy through potentiation of systemic anti-tumor immunity, which provides clinical rationale for repeated therapeutic dosing and prompts investigation of such effects with other OVs.

Keywords: NDV; Newcastle Disease Virus; cancer immunotherapy; immuno-oncology; oncolytic virus; pre-existing immunity; tumor immunology.


Figures

Figure 1
Figure 1
Therapeutic Efficacy of Intratumoral NDV Is Dependent on Adaptive Immunity (A) Treatment scheme. Tumors were established by implantation of 1 × 105 (B–F) or 2 × 105 B16-F10 cells in the right flank. (B) Representative luminescence images from animals treated with NDV-fluc. (C) Quantification of average luminescence from the tumor sites at the indicated time points. Left, average luminescence. Right, area under curve (AUC) calculated from the curves on the left. (D) Individual tumor growth curves. (E) Average tumor volumes followed until first death in each treatment group. Indicated statistical comparisons were performed using t test using the average tumor volumes on the last day of measurement before the first death. (F) Overall survival with CD4 or CD8 depletion. (G) Individual tumor growth curves with NK cell depletion. (H) Average tumor volumes followed until first death in each treatment group. (I) Overall survival with NK depletion. Data in (A)–(F) and (G)–(I) each represent one of two independent experiments with n = 5–10 per group. Mean ± SEM is shown. ns, not significant; *p < 0.05; ****p < 0.0001.
Figure 2
Figure 2
Prior Immunity to NDV Potentiates Its Therapeutic Efficacy with Intratumoral Administration (A) Prime-boost immunization scheme. Tumors were established by implantation of 2 × 105 B16-F10 cells in the right flank. (B) Anti-NDV antibody serum titers determined by hemagglutination inhibition (HI) assay at 21 and 36 days after immunization. The y axis indicates the dilution factor at which HI is no longer seen. (C) Neutralization of NDV by day 21 serum, as determined by infectivity of A549 cells. The y axis indicates the dilution factor at which NDV neutralization is no longer seen. (D) Representative luminescence images from animals treated with NDV-fluc. (E) Quantification of average luminescence from the tumor sites 24, 48, 72, and 96 hr after initial treatment. (F) AUC calculated from the data in (D). (G) Survival experiment treatment scheme. Tumors were established by implantation of 2 × 105 B16-F10 cells in the right flank. (H and I) Growth of individual injected tumors (H) and average B16-F10 tumor growth until first death in each group (I). (J) Overall survival of the treated B16-F10 tumor-bearing mice. Data for (D)–(F) represent one of two experiments with n = 5 per group. Data for (G)–(J) show representative results from one of four experiments with n = 10 per group. Mean ± SEM is shown. ns, not significant; *p < 0.05; **p < 0.01; ****p < 0.0001. R, right.
Figure 3
Figure 3
Pre-existing Immunity to NDV Potentiates Local, Abscopal, and Systemic Anti-tumor Immune Responses (A) Treatment scheme. Tumors were established by implantation of 2 × 105 B16-F10 cells in the right and left flanks. (B) Relative cell type gene signature scores from the NDV-treated tumors of NDV-naive and NDV-immunized mice (all n = 5). (C) Absolute number of tumor-infiltrating CD8+ and CD4+FoxP3 (Tcon) cells per gram of tumor calculated from flow cytometry of treated tumors. (D) Representative flow cytometry plots of percentages of Tcon and Treg cells (left) and average percentages of Treg cells (right). (E) Calculated CD8+:Treg and Tcon:Treg ratios in the treated tumors. (F) Relative cell type gene signature scores from the distant tumors of NDV-naive (n = 9) and NDV-immunized (n = 5) mice treated with NDV. (G) Relative expression of genes related to T cell response in the distant tumors of NDV-treated NDV-naive and NDV-treated NDV-immunized mice. (H) Absolute number of tumor-infiltrating CD8+ and Tcon cells per gram of tumor calculated from flow cytometry of distant tumors. (I and J) Representative flow cytometry plots with percentages of Tcon and Treg cells (I) and average percentages of Treg cells calculated from flow cytometry in distant tumors (J). (K) Calculated CD8+:Treg and Tcon:Treg ratios. (L and M) Production of IFNγ in response to re-stimulation of splenic CD8+ lymphocytes with (L) B16-F10 cells or (M) with MB49 cells infected with NDV (left) and non-infected MB49 cells (right). (N) Anti-NDV antibody serum titers (day 50) determined by HI. Data from (B), (F), and (G) represent results from one experiment. Data from (C)–(E) and (H)–(J) represent results from one of three independent experiments with n = 3–5 animals per group. Data from (K) represent combined results from two independent experiments with 8–14 animals per group. Data from (N) represent results from one of three independent experiments with n = 8–10 per group. Mean ± SEM is shown. ns, not significant; *p < 0.05; **p < 0.01; ***p < 0.001; ****p < 0.0001. R, right; BL, bilateral.
Figure 4
Figure 4
Therapeutic Efficacy of NDV Is Dependent on CD8+ Cells and NK Cells but Not CD4+ Lymphocytes Mice immunized and treated with NDV were depleted for CD4 or CD8 lymphocytes (B and C) or NK cells (D and E). (A) Treatment scheme. Tumors were established by implantation of 2 × 105 B16-F10 cells in the right flank. (B) Individual tumor growth curves after CD4 or CD8 depletion. (C) Overall survival after CD4 or CD8 depletion. (D) Individual tumor growth curves after NK depletion. (E) Overall survival after NK depletion. (B and C) Data represent cumulative results from two experiments with n = 10 (PBS), n = 19 (NDV + aCD4), and n = 19 (NDV + aCD8). (D and E) Data represent results of one experiment with n = 5 (PBS and PBS + aNK groups) and n = 10 (NDV and NDV + aNK groups). R, right; IP; intraperitoneal.
Figure 5
Figure 5
Efficacy of NDV in a Setting of Recurrent Tumor in the Presence of Anti-NDV Immunity (A) Treatment scheme. Primary tumors were established by implantation of 1 × 105 B16-F10 cells in the right flank. Recurrent tumors were modeled by implantation of 4 × 105 B16-F10 cells in the left flank. (B) Individual tumor growth. (C) Overall survival. Data represent one of two independent experiments with n = 5 (B16-naive PBS), n = 4 (B16 re-implanted PBS), n = 5 (B16 naive NDV), and n = 9 (B16 re-implanted NDV) mice per group. ***p < 0.001.
Figure 6
Figure 6
In a Setting of Recurrent Tumor, Prior Immunity to NDV Potentiates Immune Infiltration in Distant Tumors (A) Treatment scheme in the bilateral flank tumor model. Primary tumors were established by implantation of 1 × 105 B16-F10 cells in the right flank. Recurrent tumors were modeled by implantation of 4 × 105 B16-F10 cells in the bilateral flanks. (B) Absolute number of tumor-infiltrating CD45+, CD11b+, NK, and CD3+ cells in distant tumors, calculated from flow cytometry. (C) Absolute number of tumor-infiltrating CD8+, Tcon, and Treg cells per gram of tumor in distant tumors, calculated from flow cytometry. (D) Relative percentages of tumor-infiltrating Tregs out of CD4+ cells. Data represent one of two independent experiments with n = 5, n = 5, n = 5, and n = 6, as above. Mean ± SEM is shown. ns, not significant; *p < 0.05; **p < 0.01; ***p < 0.001; ****p < 0.0001. R, right; L, left; BL, bilateral.

Comment in

References

    1. Kaufman H.L., Kohlhapp F.J., Zloza A. Oncolytic viruses: a new class of immunotherapy drugs. Nat. Rev. Drug Discov. 2015;14:642–662. - PMC - PubMed
    1. Russell S.J., Peng K.W., Bell J.C. Oncolytic virotherapy. Nat. Biotechnol. 2012;30:658–670. - PMC - PubMed
    1. Prestwich R.J., Errington F., Diaz R.M., Pandha H.S., Harrington K.J., Melcher A.A., Vile R.G. The case of oncolytic viruses versus the immune system: waiting on the judgment of Solomon. Hum. Gene Ther. 2009;20:1119–1132. - PMC - PubMed
    1. Chen Y., Yu D.C., Charlton D., Henderson D.R. Pre-existent adenovirus antibody inhibits systemic toxicity and antitumor activity of CN706 in the nude mouse LNCaP xenograft model: implications and proposals for human therapy. Hum. Gene Ther. 2000;11:1553–1567. - PubMed
    1. Ferguson M.S., Lemoine N.R., Wang Y. Systemic delivery of oncolytic viruses: hopes and hurdles. Adv. Virol. 2012;2012:805629. - PMC - PubMed

Publication types

MeSH terms