. 2018 Mar 14;23(3):302-311.e3.
doi: 10.1016/j.chom.2018.01.005. Epub 2018 Feb 22.

Commensal Microbes Induce Serum IgA Responses that Protect against Polymicrobial Sepsis

Affiliations

Commensal Microbes Induce Serum IgA Responses that Protect against Polymicrobial Sepsis

Joel R Wilmore et al. Cell Host Microbe. .

Abstract

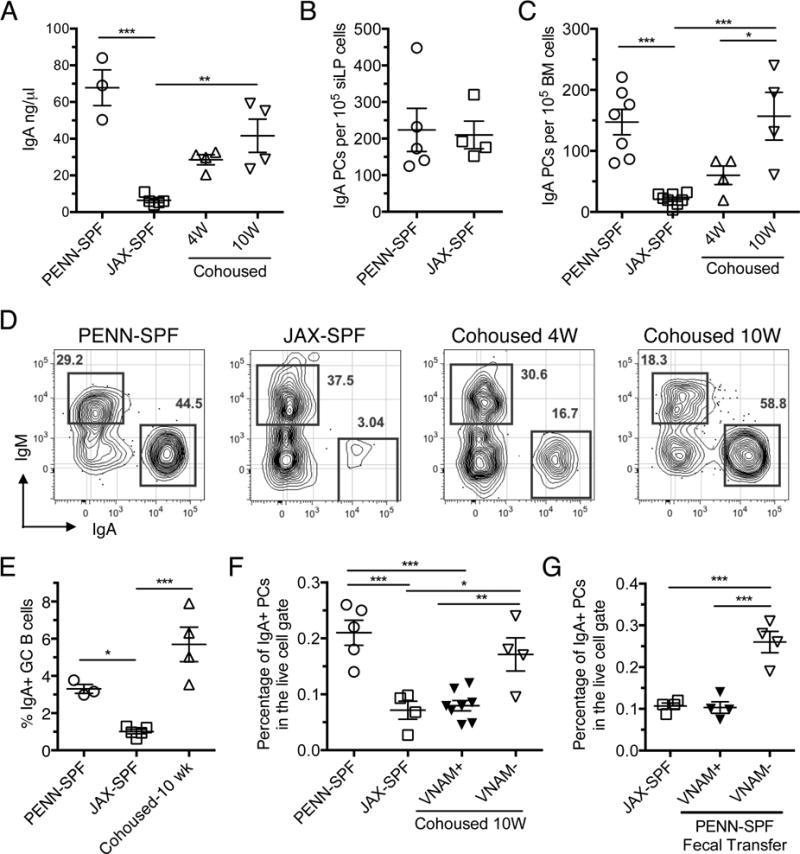
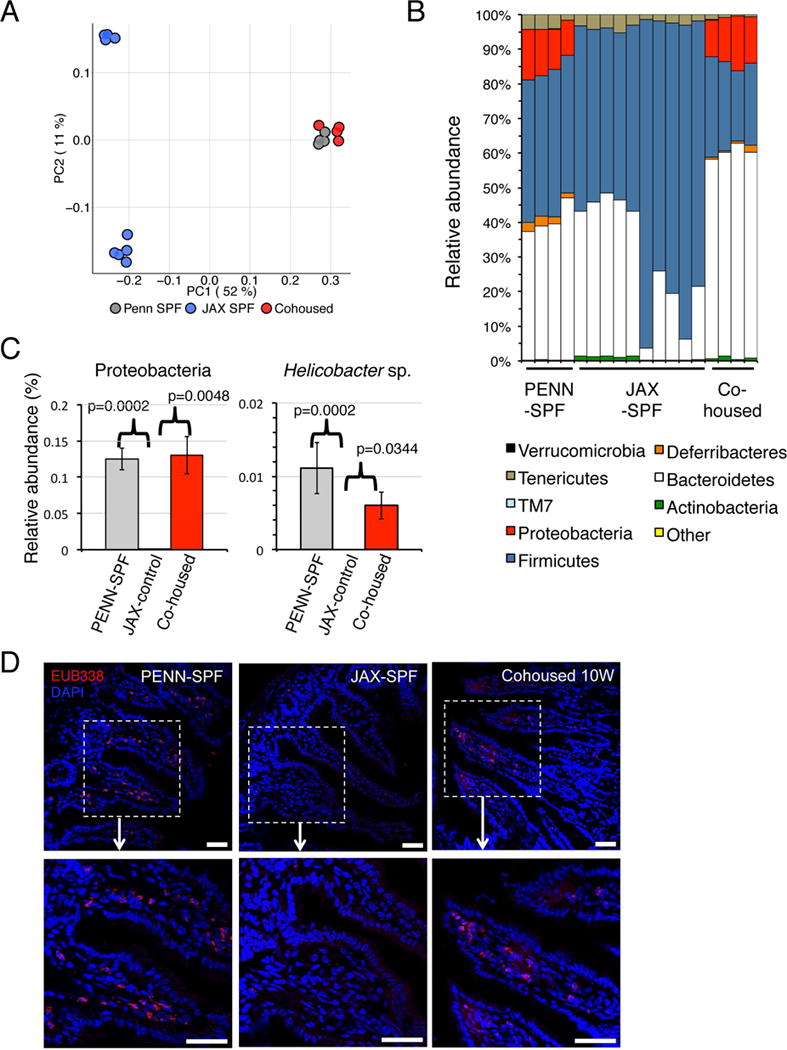
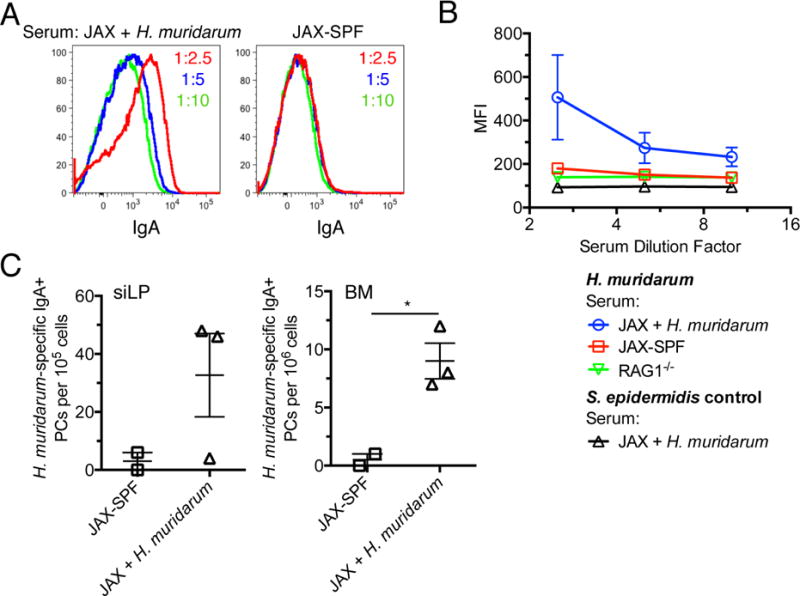
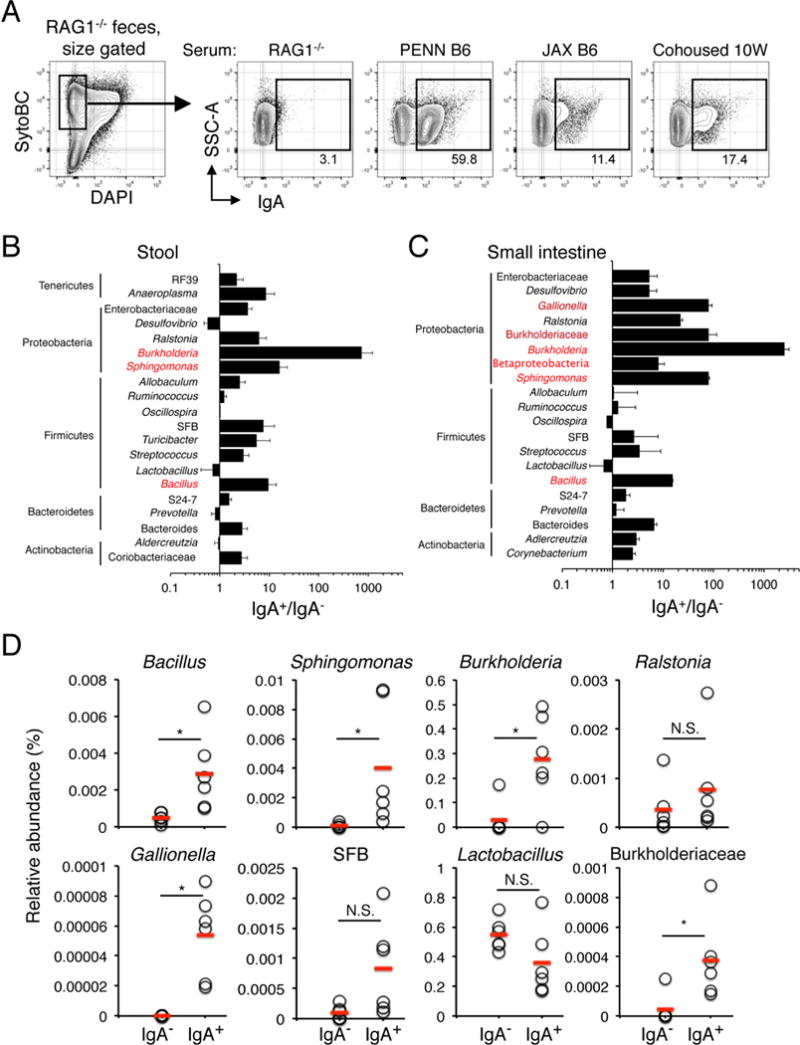
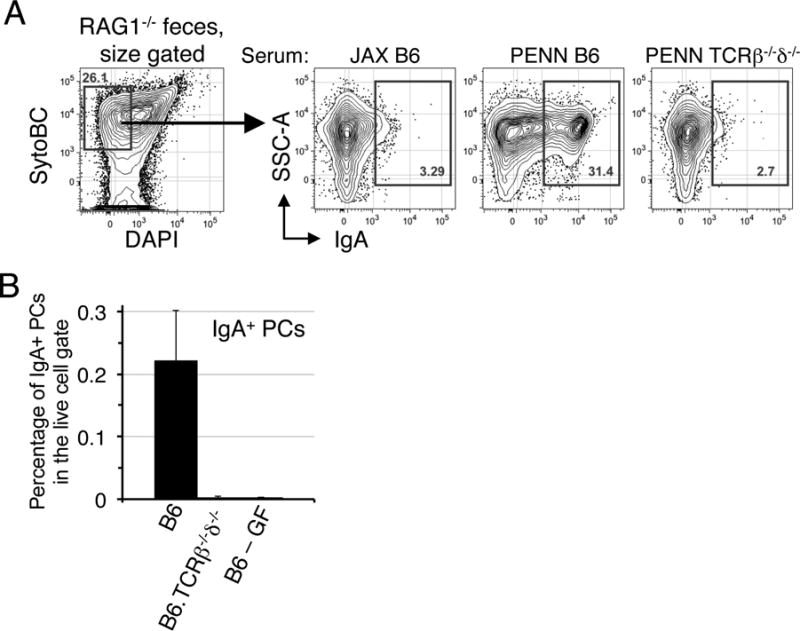
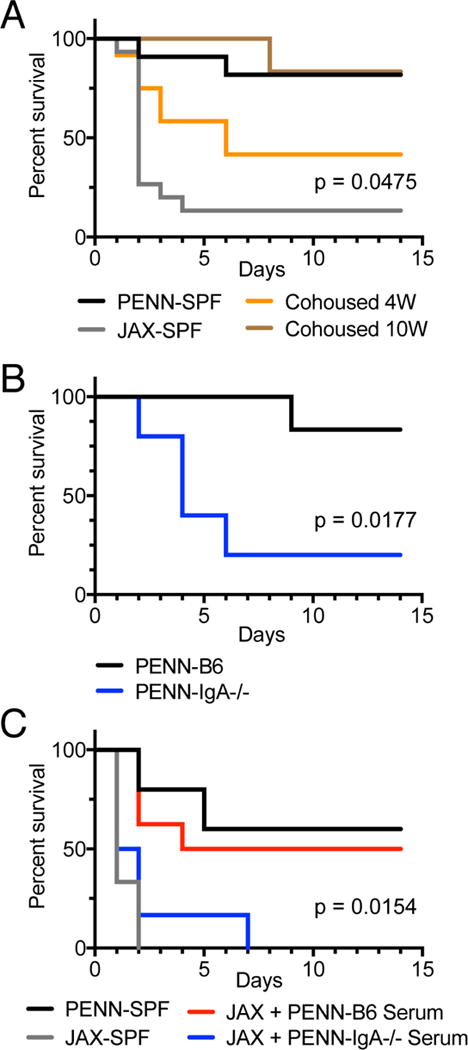
Serum immunoglobulin A (IgA) antibodies are readily detected in mice and people, but the mechanisms underlying the induction of serum IgA and its role in host protection remain uncertain. We report that select commensal bacteria induce several facets of systemic IgA-mediated immunity. Exposing conventional mice to a unique but natural microflora that included several members of the Proteobacteria phylum led to T cell-dependent increases in serum IgA levels and the induction of large numbers of IgA-secreting plasma cells in the bone marrow. The resulting serum IgA bound to a restricted collection of bacterial taxa, and antigen-specific serum IgA antibodies were readily induced after intestinal colonization with the commensal bacterium Helicobacter muridarum. Finally, movement to a Proteobacteria-rich microbiota led to serum IgA-mediated resistance to polymicrobial sepsis. We conclude that commensal microbes overtly influence the serum IgA repertoire, resulting in constitutive protection against bacterial sepsis.

Keywords: B cell; IgA; antibodies; microbiota; plasma cell; sepsis; serum.


Conflict of interest statement

Declaration of Interests

The authors declare no competing interests.

Figures

Figure 1
Figure 1. Serum IgA concentration and BM IgA+ plasma cell numbers are dependent on housing conditions
(A) Serum ELISA performed to determine the concentration of IgA from PENN-SPF, JAX-SPF, and cohoused mice, with 3-5 mice per group. (B) Cells from siLP of PENN-SPF or JAX-SPF B6 adults were plated onto ELISpot plates pre-coated with anti-Ig(H+L) and spots were developed using IgA-specific antibodies. (C) BM cells from PENN-SPF, JAX-SPF or JAX-SPF cohoused with PENN-SPF for 4 or 10 weeks were plated onto ELISpot plates as in (B) and detected with IgA-specific antibodies. (D) BM samples from the groups indicated in (C) were stained with the indicated antibodies and 2×10⁶ events collected on an LSR2 flow cytometer. (E) Frequencies of Peyer’s patch GC B cells (CD19+ IgD CD38 PNA+) in the indicated mice. Means and SEMs are shown for 3-5 mice/grp. (F) Percentages of IgA+ plasma cells within the live cell gate of the BM were determined for mice cohoused with PENN-SPF mice pretreated with VNAM or JAX-SPF, PENN-SPF, and cohoused controls. (G) JAX-SPF mice were gavaged with fecal slurry from PENN-SPF and the treated with VNAM or maintained as controls. Displayed are percentages of IgA+ plasma cells within the live cell gate of the BM. Means and standard error are indicated for at least 3 mice per group. * p <0.05, ** p<0.01, *** p<0.001 determined by one-way ANOVA with Tukey’s posttest or t-test where appropriate. Data are representative of 3 independent experiments.
Figure 2
Figure 2. 16S sequencing of JAX-SPF mice demonstrates a lack of commensal bacteria the phylum Proteobacteria
(A-C) Stool samples from JAX-SPF, PENN-SPF, and co-housed mice were subjected to 16S V4 rDNA gene sequencing. (A) Principle coordinate analysis illustrating degree of variance for the indicated mice within each group. (B) Relative abundance of each bacterial phylum for each sample. (C) Comparison of JAX-SPF, PENN-SPF, and co-housed JAX-SPF mice for relative abundance of the phylum Proteobacteria and the genus Helicobacter. (D) Confocal images of FISH analyses performed on sections of the small intestine from JAX-SPF, 10 week cohoused, or PENN-SPF B6 adults. 16S probe EUB338 staining is shown in red, with nuclear (DAPI) in blue. Dashed boxes outlined enlarged areas displayed on the right. Scale bars: 40 μm. Images are representative of 2 different areas of the intestine from 4 mice from each group. P values calculated using one-way ANOVA with Tukey’s posttest. Experiments contain at least 4 mice per group and are representative of 2 independent experiments.
Figure 3
Figure 3. Marrow IgA+ plasma cells induced by a commensal bacterium
(A) JAX-SPF mice were colonized with Helicobacter muridarum by oral gavage 4 weeks previously; cultured H. muridarum was stained with sera from JAX-SPF controls housed in isolation or JAX-SPF mice colonized with H. muridarum 4 weeks earlier. Bacteria were then stained with PE-anti-IgA and analyzed on an LSR2 flow cytometer. (B) Graphical representation of data presented in (A) with B6.RAG1−/− serum and Staphylococcus epidermidis used as negative controls. S. epidermidis was stained with serum from JAX-SPF H. muridarum mice because it is not found by 16S sequencing in the feces of PENN-SPF or JAX-SPF mice. (C) H. muridarum-specific ELISpot analysis performed using siLP and BM cells from (A). Experiments contain at least 3 H. muridarum treated mice per group and are representative of 2 independent experiments.
Figure 4
Figure 4. Serum IgA binding to select commensal bacteria including Proteobacteria
(A) Fecal bacteria from B6.RAG1−/− mice were stained with sera from the indicated mice, and IgA+ bacteria were identified with PE-anti-IgA antibodies by flow cytometry. Bacterial viability was determined by positive staining with SytoBC and minimal DAPI staining, as shown. (B) Fecal bacteria from RAG1−/− mice were stained with sera from PENN-B6 adults and both IgA+ and IgA fraction sorted twice. DNA from these samples was then subjected to 16S V4 sequencing. The ratio of the relative abundance for each taxon in each fraction (IgA+, IgA) was used to identify taxa enriched for IgA binding. Bacterial genera that were highly enriched (IgA+/IgA ≥ 10) are highlighted in red. Genera shown were selected because they possessed ICI scores above or below 3, or because of potential relevance based on previous studies. (C) Small intestine fecal samples from B6.RAG1−/− mice were stained, sorted, and sequenced as in (B). (D) Relative abundance of the indicated taxa for the serum IgA+ and serum IgA fraction derived from the data in (C). Red lines indicate means for each group. N.S., not significant, *p < 0.05 (Wilcoxon rank-sum).
Figure 5
Figure 5. Systemic IgA responses are T cell dependent
(A) Fecal bacteria from B6.RAG1−/− mice were stained with sera from the indicated mice as in Figure 4A, then IgA-bound bacteria were detected with anti-IgA antibody. Data are representative of 2 independent experiments with 3-4 mice per group. (B) Percentages of IgA+ plasma cells within the live cell gate of the BM were determined by flow cytometry for PENN-SPF B6, B6. TCRβ−/−δ−/−, and germ-free B6 female adults. Data are representative of 2 independent experiments with 4-5 mice per group.
Figure 6
Figure 6. Serum-IgA mediated protection from induced sepsis
(A) JAX-SPF and PENN-SPF were cohoused for 1.5 (labeled JAX-SPF), 4, or 10 weeks to allow for mice to achieve similar intestinal microflora and in the case of the 4 and 10 week cohoused groups to develop increased serum IgA. Mice were then subjected to CLP surgery with a 1cm ligation followed by 2 punctures with a 21G needle. Survival was monitored daily for 14 days. JAX-SPF n = 15, PENN-SPF n = 11, Cohoused 4W n = 12, and Cohoused 10W n = 6. Reported p value is between JAX-SPF and cohoused 4W. (B) PENN-SPF B6 and PENN-SPF B6.IgA−/− mice were subjected to CLP as in (A). B6 n = 6 and B6.IgA−/− n = 5. (C) CLP was performed on PENN-SPF and JAX-SPF control mice as in (A) while additional JAX-SPF mice received sera from B6 or B6.IgA−/− PENN-SPF mice; 400μl on day zero, and 300μl daily for the next 4 days. Reported p value is between B6 and B6.IgA−/− serum transfer groups. Sample sizes were as follows: Penn-SPF controls, n = 5; JAX-SPF controls, n = 6; JAX-SPF + B6 serum, n = 8; JAX-SPF + B6.IgA−/− serum, n = 6. P values were determined using a log-rank test. Representative of 2 independent experiments.

Comment in

References

    1. Amann RI, Binder BJ, Olson RJ, Chisholm SW, Devereux R, Stahl DA. Combination of 16S rRNA-targeted oligonucleotide probes with flow cytometry for analyzing mixed microbial populations. Appl Environ Microbiol. 1990;56:1919–1925. - PMC - PubMed
    1. Atarashi K, Tanoue T, Ando M, Kamada N, Nagano Y, Narushima S, Suda W, Imaoka A, Setoyama H, Nagamori T, et al. Th17 Cell Induction by Adhesion of Microbes to Intestinal Epithelial Cells. Cell. 2015;163:367–380. - PMC - PubMed
    1. Bemark M, Hazanov H, Stromberg A, Komban R, Holmqvist J, Koster S, Mattsson J, Sikora P, Mehr R, Lycke NY. Limited clonal relatedness between gut IgA plasma cells and memory B cells after oral immunization. Nat Commun. 2016;7:12698. - PMC - PubMed
    1. Ben-Amor K, Heilig H, Smidt H, Vaughan EE, Abee T, de Vos WM. Genetic diversity of viable, injured, and dead fecal bacteria assessed by fluorescence-activated cell sorting and 16S rRNA gene analysis. Appl Environ Microbiol. 2005;71:4679–4689. - PMC - PubMed
    1. Blanc P, Moro-Sibilot L, Barthly L, Jagot F, This S, de Bernard S, Buffat L, Dussurgey S, Colisson R, Hobeika E, et al. Mature IgM-expressing plasma cells sense antigen and develop competence for cytokine production upon antigenic challenge. Nat Commun. 2016;7:13600. - PMC - PubMed

MeSH terms