. 2018 Apr;123(4):501-510.
doi: 10.1016/j.ymgme.2018.02.007. Epub 2018 Feb 17.

ACE phenotyping in Gaucher disease

Affiliations

ACE phenotyping in Gaucher disease

Sergei M Danilov et al. Mol Genet Metab. 2018 Apr.

Abstract

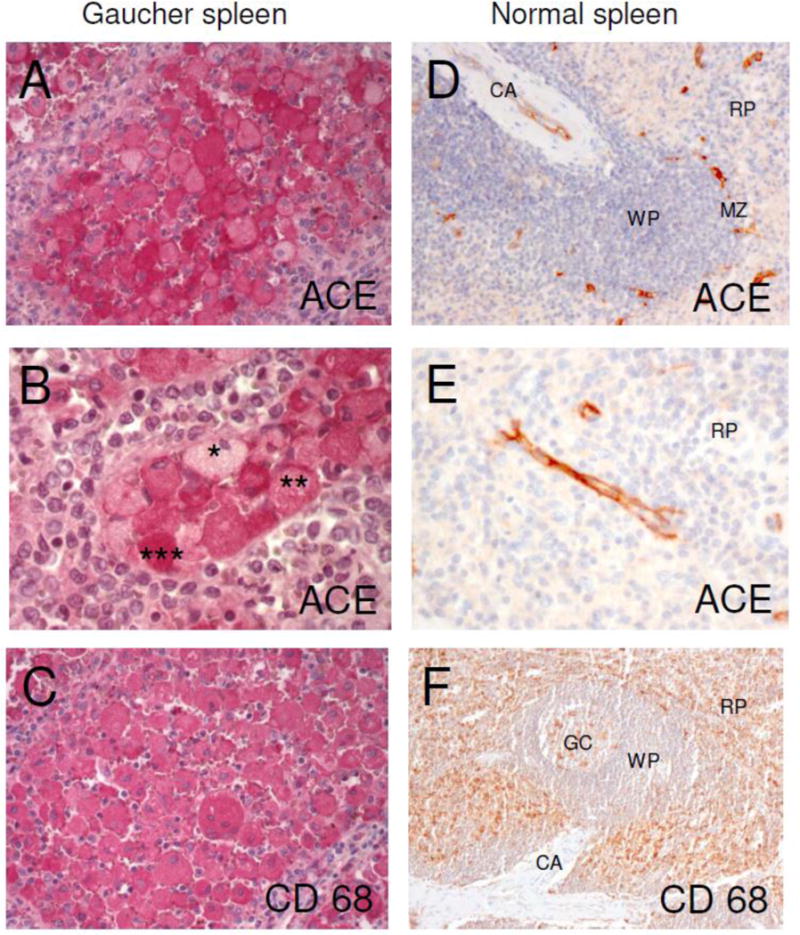
Background: Gaucher disease is characterized by the activation of splenic and hepatic macrophages, accompanied by dramatically increased levels of angiotensin-converting enzyme (ACE). To evaluate the source of the elevated blood ACE, we performed complete ACE phenotyping using blood, spleen and liver samples from patients with Gaucher disease and controls.

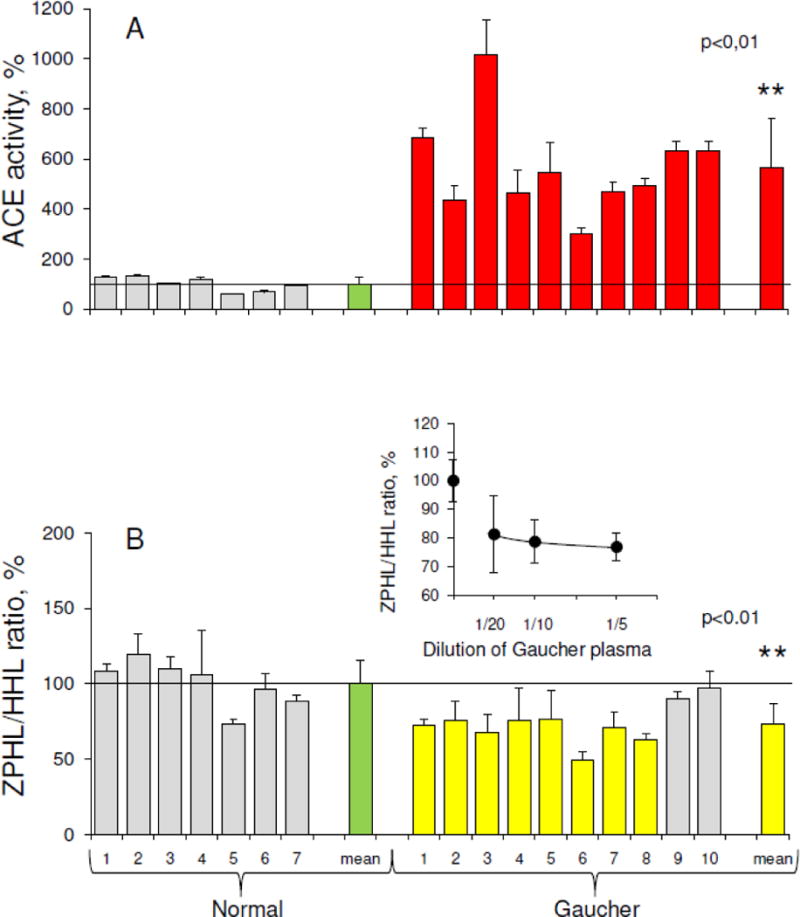
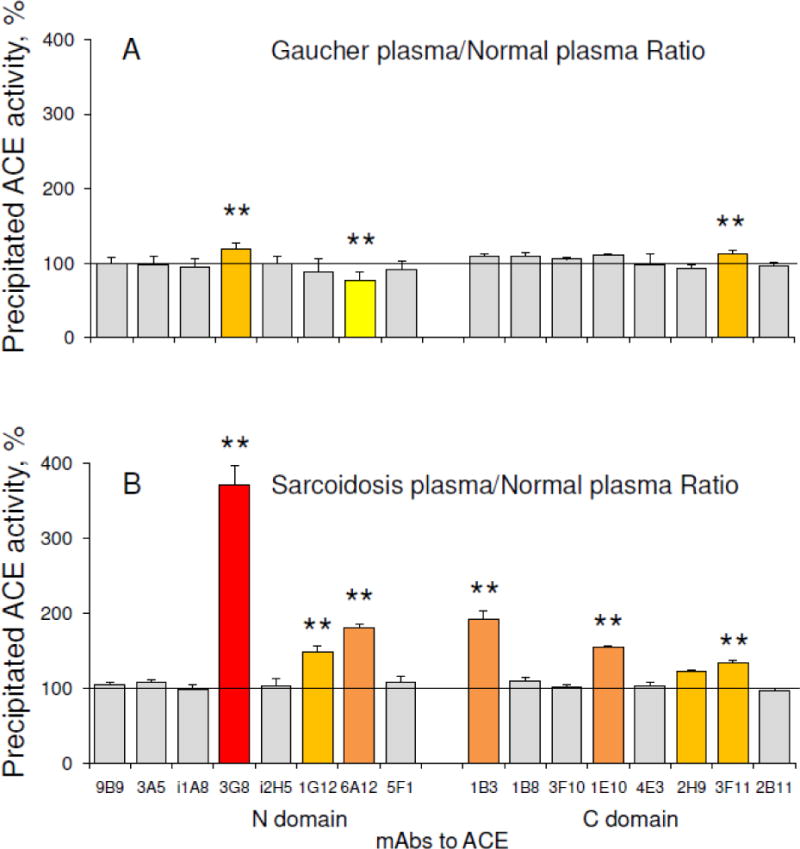
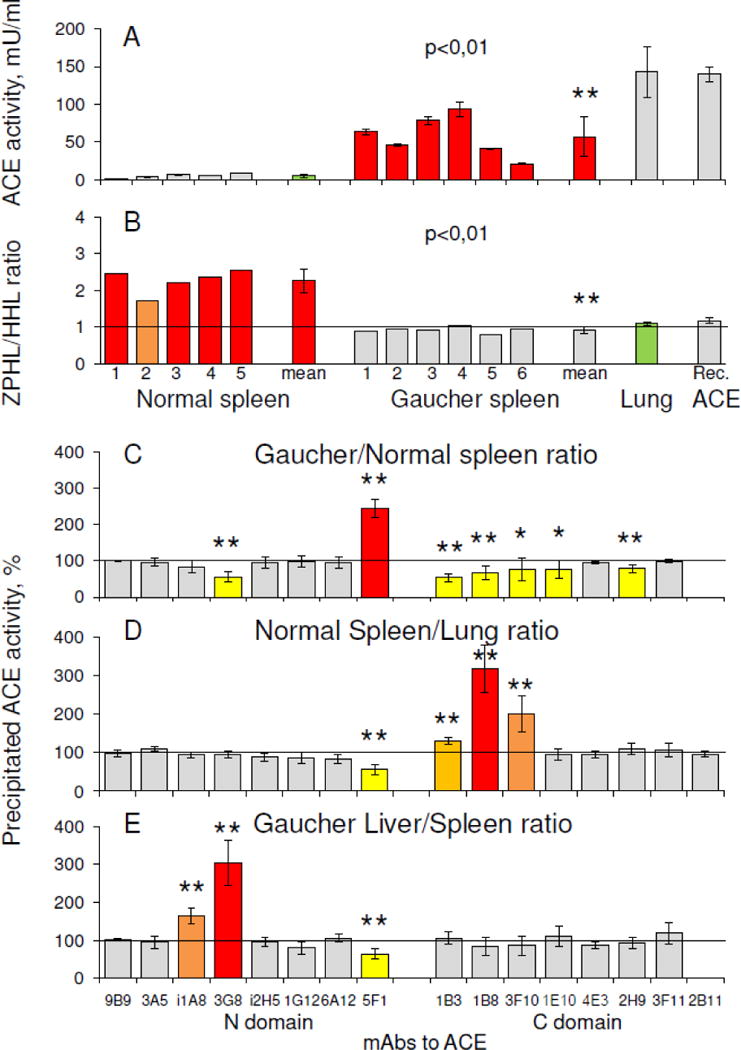
Methods: ACE phenotyping included 1) immunohistochemical staining for ACE; 2) measuring ACE activity with two substrates (HHL and ZPHL); 3) calculating the ratio of the rates of substrate hydrolysis (ZPHL/HHL ratio); 4) assessing the conformational fingerprint of ACE by evaluating the pattern of binding of monoclonal antibodies to 16 different ACE epitopes.

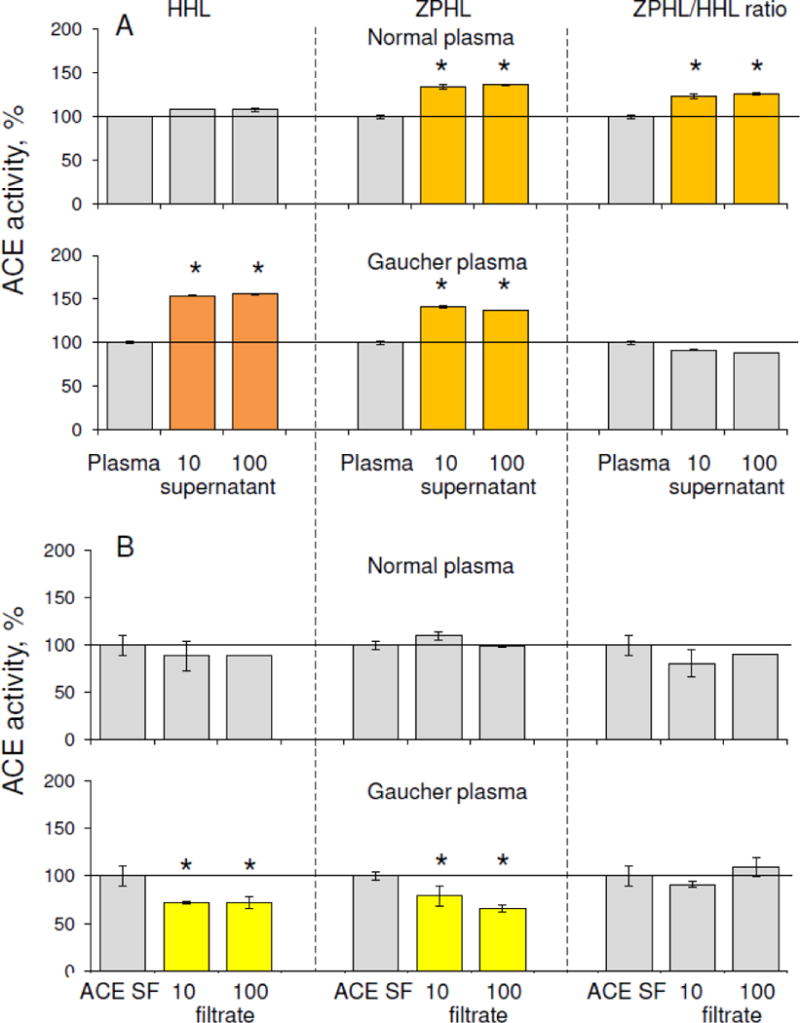
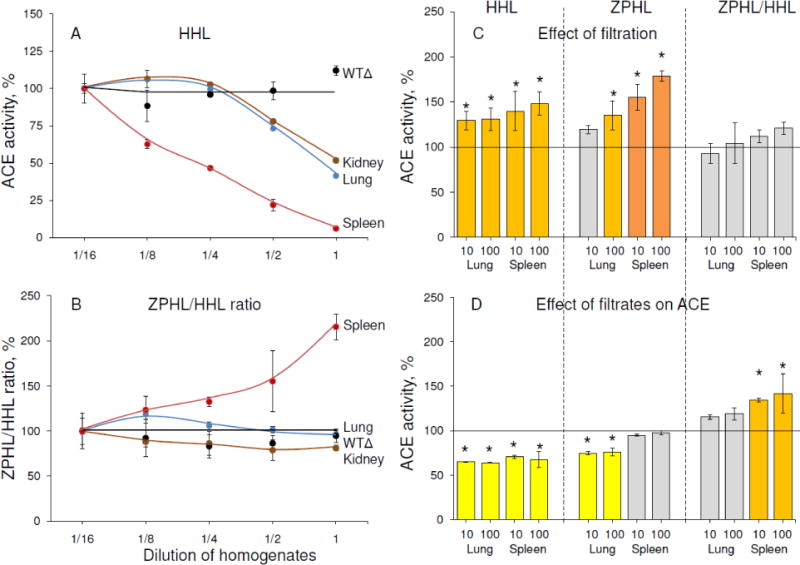
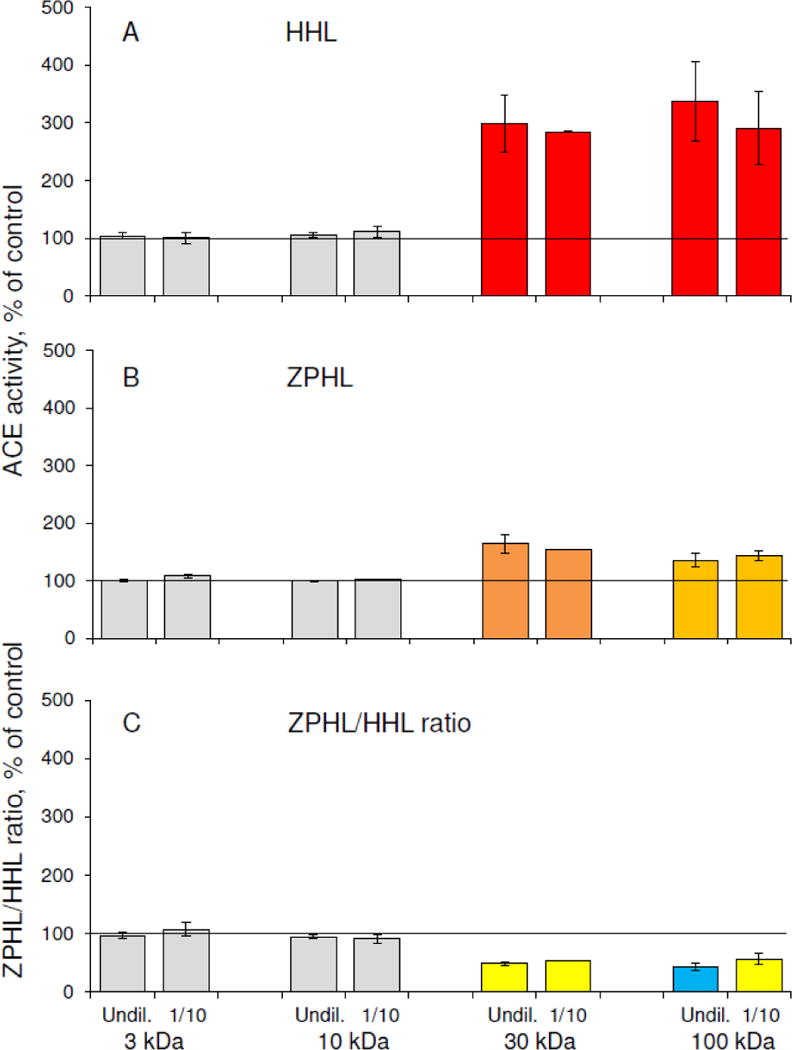
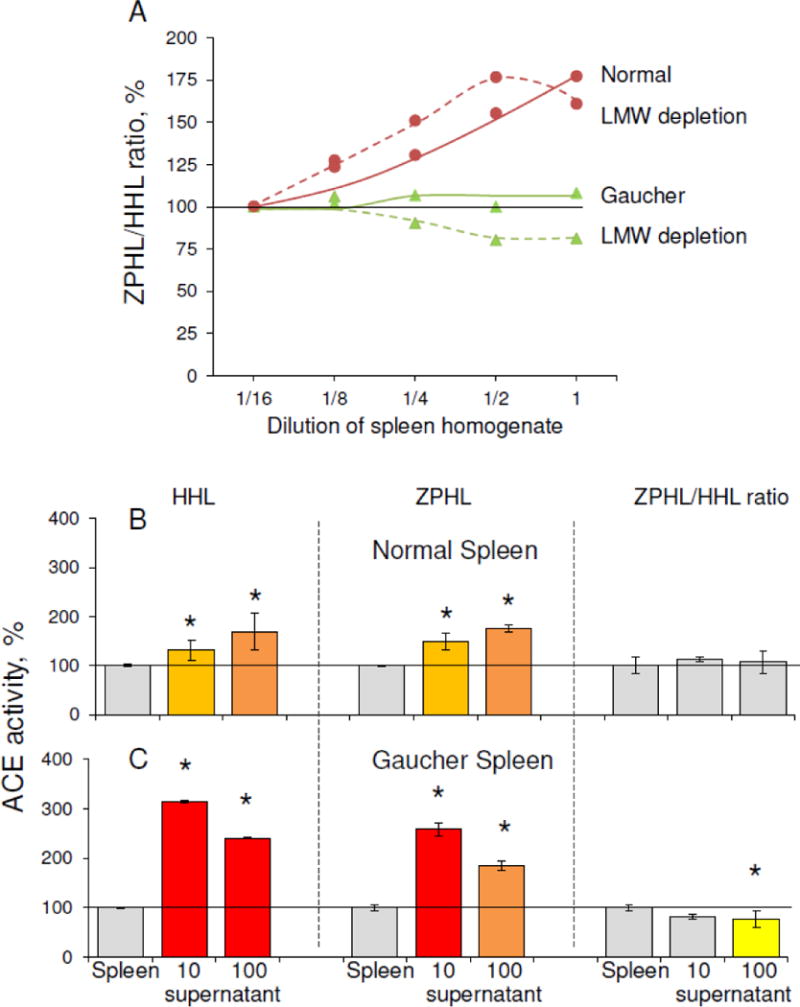
Results: We show that in patients with Gaucher disease, the dramatically increased levels of ACE originate from activated splenic and/or hepatic macrophages (Gaucher cells), and that both its conformational fingerprint and kinetic characteristics (ZPHL/HHL ratio) differ from controls and from patients with sarcoid granulomas. Furthermore, normal spleen was found to produce high levels of endogenous ACE inhibitors and a novel, tightly-bound 10-30 kDa ACE effector which is deficient in Gaucher spleen.

Conclusions: The conformation of ACE is tissue-specific. In Gaucher disease, ACE produced by activated splenic macrophages differs from that in hepatic macrophages, as well as from macrophages and dendritic cells in sarcoid granulomas. The observed differences are likely due to altered ACE glycosylation or sialylation in these diseased organs. The conformational differences in ACE may serve as a specific biomarker for Gaucher disease.

Keywords: ACE inhibitors; Angiotensin I-converting enzyme; CD143; Conformation; Gaucher disease; Monoclonal antibodies; Tissue specificity.


Figures

Figure 1
Figure 1. ACE expression in Gaucher spleen
Serial sections of paraffin-embedded sections of Gaucher and control spleen were stained with mAb CG2 to human ACE and with mAb KP1 to human CD68. ACE expression and localization are shown in red. A: ACE in splenic Gaucher cells. ACE is seen in the cytoplasm and on the cell membrane. mAb CG2, original magnification ×20. B: ACE is expressed heterogeneously in splenic Gaucher cells. A few Gaucher cells show a low (*) amount of ACE, most cells present a moderate (**) amount of ACE and some Gaucher cells show very strong (***) ACE expression. mAb CG2, original magnification ×40. C: Serial section of tissue shown in A. The macrophage marker CD68 is expressed homogenously in splenic Gaucher cells. mAb KP1, original magnification ×20. D: ACE in control spleen is present only in endothelial cells of terminal trabecular arteries, central arterioles (CA), marginal zone (MZ) sinuses and arterioles of the red pulp. mAb CG2, original magnification ×20. E: ACE in endothelial cells of arterioles of the red pulp (RP) in control spleen. mAb CG2, original magnification ×40. F: CD68 in control spleen is predominantly found in macrophages of the red pulp (RP). A few macrophages are stained within the germinal center (GC) of the white pulp (WP). CA, central arteriole. mAb KP1, original magnification ×10.
Figure 2
Figure 2. ACE activity in Gaucher plasma
ACE activity in 10 plasma samples from patients with Gaucher disease (shown on right) and 7 unrelated controls (left) was quantified using a spectrofluorometric assay with HHL (5 mM) and ZPHL (2 mM) as substrates. A. Data is expressed as % of individual ACE activity from mean value for normal patients (30.3 mU/ml with ZPHL). Bars highlighted in red are samples with ACE activity 2-fold higher than mean for healthy controls (shown in green). B. Ratio of the rate of the hydrolysis of two substrates (ZPHL/HHL ratio) in the tested samples. Data is expressed as % of individual ZPHL/HHL ratio from mean control value (green). Bars highlighted in yellow are samples with ZPHL/HHL ratios 20% less than mean. ** p<0.01 indicates significantly different ZPHL/HHL ratio in the disease and in normal conditions. Insert. ZPHL/HHL ratio for Gaucher plasma ACE (mean of 3) at different plasma dilutions presented as % of corresponding value for control samples (mean of 5).
Figure 3
Figure 3. Effect of filtrations of Gaucher and normal plasma on ACE activity
A. ACE activity was measured in plasma from Gaucher patients versus normal plasma with two substrates, ZPHL and HHL, after filtration with 10 and 100 kDa pore filters. Data are expressed as % from control. Each value is a mean of several (2–3) experiments in duplicates. Orange indicates ACE activity > 20% higher than the mean, dark orange indicates > 50% higher than the mean. B. ACE activity of ACE purified from seminal fluid (ACE SF) was measured after incubation with 95% of filtrates (10 and 100 kDa limits) of control and Gaucher plasma. Bars in yellow are samples with ACE activity 20% less than mean. Each value is a mean of several (2–3) experiments in duplicates. * p<0.05 indicates significantly different ACE activity in supernatants obtained as a result of filtration of Gaucher and normal plasma or different activity of pure ACE in the presence of filtrates of Gaucher and normal plasma.
Figure 4
Figure 4. Conformational fingerprint of ACE in plasma
A. Conformational fingerprinting of ACE using sixteen monoclonal antibodies (mAbs) to precipitate ACE from heparinized Gaucher plasma. Immunoprecipitated ACE activity is presented as a normalized value (“binding ratio”) to highlight differences in immunoprecipitation patterns (“conformational fingerprint”) of ACE from different plasma samples. Pools of 10 Gaucher and of 7 control plasmas were used as a representative of each group. B. Conformational fingerprint of ACE from plasma of patients with sarcoidois versus normal plasma. Pools of 4 plasma from patients with sarcoidosis and 5 controls were used as a representative of each group (adapted from Fig. 7 in [33]). Data presented is the mean of at least 3 independent experiments in duplicate. Ratios increased more than 20% are highlighted in orange, more than 50% – in dark orange, more than 100% – in red, while less than 20% – in yellow. * p<0.05 indicates significantly different mAbs binding to ACE from normal plasma and Gaucher/Sarcoidosis plasma.
Figure 5
Figure 5. ACE activity and conformation in Gaucher spleen
A–B. ACE activity (A-with ZPHL as a substrate), determined on 6 Gaucher and 5 control spleen homogenates (prepared 1:9 (weight: volume), and further diluted 10-fold) and the corresponding ZPHL/HHL ratios (B) compared to 3 control lung homogenates as well as for the culture medium of CHO cells expressing soluble human ACE without transmembrane anchor – WTΔ (57). ** p<0.01 indicates significantly different ACE activity in Gaucher disease and control spleen. C–E. Conformational fingerprinting of ACE in spleen, lung and liver homogenates. Immunoprecipitated ACE activity is presented as a normalized value – Gaucher/Normal ratio for spleen (C), Control Spleen/Lung ratio (D) and Gaucher Liver/Spleen ratio (E) to highlight differences in immunoprecipitation patterns of ACE from different homogenates. Data is presented as the mean of at least 2–3 independent experiments in duplicate. The colors correspond to those used in Fig. 4. The mean values for control spleen homogenates (A) and lung homogenates (B) are shown in green. ** p<0.01 and * p<0.05. These values indicate significantly different patterns of mAbs binding to ACE in different tissues in Controls and in Gaucher patients.
Figure 6
Figure 6. Effects of dilution and filtration on ACE activity in tissue homogenates
A–B. Apparent ACE activity was measured in the homogenates (1:9, weight: volume) of spleen, lung and kidney from postmortem specimens. Human recombinant ACE from CHO-cells expressing soluble wild-type ACE without transmembrane anchor – WTΔ [39] was used as a negative control. These homogenates (and culture medium with recombinant ACE) were serially diluted and ACE activity determined using two substrates, ZPHL and HHL (A) and the ZPHL/HHL ratio was calculated (B). Data are expressed as % of ACE activity in homogenates diluted 1/16. Each value is the mean of several (2–3) experiments in duplicates. C. ACE activity was measured in supernatants after filtration of spleen and lung homogenates on filters with different pores (10 and 100 kDa) and reconstituted to the initial volume. D. ACE activity of purified seminal fluid ACE was determined after incubation with 95% filtrates from spleen and lung homogenates (10 and 100 kDa limit). Effect of filtration and filtrates was presented as a % from control. Each value is a mean of several (2–3) experiments in duplicates. Bars coloring is as in Fig.4. * p<0.05 indicates significantly different ACE activity in supernatants obtained as a result of filtration of lung and spleen homogenates or different activity of pure ACE in the presence of filtrates of lung and spleen homogenates.
Figure 7
Figure 7. The effect of the ACE inhibitor enalaprilat with subsequent filtration on different filters on ACE activity in spleen homogenates
Spleen homogenates were incubated with 1 μM enalaprilat, filtered on 3, 10, 30 or 100 kDa filters and, finally, dialyzed extensively to remove enalaprilat. ACE activity was measured as in the legend to Fig. 2. A. ACE activity towards substrate HHL. B. ACE activity towards substrate ZPHL. C. ZPHL/HHL ratio.
Figure 8
Figure 8. Effect of dilution and filtration on ACE activity in spleen homogenates
A. Apparent ACE activity was measured in Gaucher and control spleen homogenates at different dilutions using two substrates, ZPHL and HHL (as in Fig. 2), with and without LMW depletion (performed on ZEBA columns with 7000 Da limit). Data are expressed as % of ACE activity in homogenates diluted 1/16. Each value is the mean of several (2–3) experiments in duplicates. B. ACE activity was measured in the Gaucher and control spleen homogenates after filtration on filters with different pores (10 and 100 kDa limit). Data are expressed as % of control. Each value is the mean of several (2–3) experiments in duplicates. Color key is as in Fig. 4 * p<0.05 indicates significantly different ACE activity in supernatants obtained as a result of filtration of Gaucher and normal spleen.

Similar articles

Cited by

References

    1. Beutler E, Grabowski GA. The Metabolic and Molecular Bases of Inherited Disease III. McGraw-Hill; New York: 2001. Gaucher Diseases; pp. 3635–3668.
    1. Adar T, Ilan Y, Elstein D, Zimran A. Liver involvement in Gaucher disease – Review and clinical approach. Blood Cells Mol Dis. 2018;68:66–73. doi: 10.1016/j.bcmd.2016.10.001. - DOI - PubMed
    1. Hruska KS, LaMarca ME, Scott CR, Sidransky E. Gaucher disease: mutation and polymorphism spectrum in the glucocerebrosidase gene (GBA) Hum Mutat. 2008;29:567–583. doi: 10.1002/humu.20676. - DOI - PubMed
    1. Mistry PK, Lopez G, Schiffman R, Barton NW, Weinreb NJ, Sidransky E. Gaucher disease: progress and ongoing challenges. Mol Genet Metab. 2017;120:8–21. doi: 10.1016/j.ymgme.2016.11.006. - DOI - PMC - PubMed
    1. Aerts JM, Kallemeijn WW, Wegdam W, Joao Ferraz M, van Breemen MJ, Dekker N, et al. Biomarkers in the diagnosis of lysosomal storage disorders: proteins, lipids, and inhibodies. J Inherit Metab Dis. 2011;34:605–619. doi: 10.1007/s10545-011-9308-6. - DOI - PMC - PubMed

Publication types